Chronic arsenic exposure induces malignant transformation of human HaCaT cells through both deterministic and stochastic changes in transcriptome expression
- PMID: 38373578
- PMCID: PMC10994602
- DOI: 10.1016/j.taap.2024.116865
Chronic arsenic exposure induces malignant transformation of human HaCaT cells through both deterministic and stochastic changes in transcriptome expression
Abstract
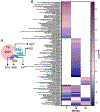
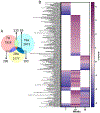
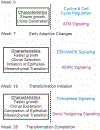
Biological processes are inherently stochastic, i.e., are partially driven by hard to predict random probabilistic processes. Carcinogenesis is driven both by stochastic and deterministic (predictable non-random) changes. However, very few studies systematically examine the contribution of stochastic events leading to cancer development. In differential gene expression studies, the established data analysis paradigms incentivize expression changes that are uniformly different across the experimental versus control groups, introducing preferential inclusion of deterministic changes at the expense of stochastic processes that might also play a crucial role in the process of carcinogenesis. In this study, we applied simple computational techniques to quantify: (i) The impact of chronic arsenic (iAs) exposure as well as passaging time on stochastic gene expression and (ii) Which genes were expressed deterministically and which were expressed stochastically at each of the three stages of cancer development. Using biological coefficient of variation as an empirical measure of stochasticity we demonstrate that chronic iAs exposure consistently suppressed passaging related stochastic gene expression at multiple time points tested, selecting for a homogenous cell population that undergo transformation. Employing multiple balanced removal of outlier data, we show that chronic iAs exposure induced deterministic and stochastic changes in the expression of unique set of genes, that populate largely unique biological pathways. Together, our data unequivocally demonstrate that both deterministic and stochastic changes in transcriptome-wide expression are critical in driving biological processes, pathways and networks towards clonal selection, carcinogenesis, and tumor heterogeneity.
Keywords: Arsenic; Carcinogenesis; Cellular Transformation; In Vitro Model; Stochasticity; Transcriptomics.
Copyright © 2024. Published by Elsevier Inc.
Conflict of interest statement
Declaration of competing interest The authors declare that they have no competing conflict of interests regarding this work other than acknowledged grants supporting the work.
Figures


Similar articles
-
Dysregulation of mRNA expression by hsa-miR-186 overexpression in arsenic-induced skin carcinogenesis.Toxicol Appl Pharmacol. 2025 Feb;495:117209. doi: 10.1016/j.taap.2024.117209. Epub 2024 Dec 22. Toxicol Appl Pharmacol. 2025. PMID: 39719251 Free PMC article.
-
Chronic arsenic exposure and hsa-miR-186 overexpression causes transcriptome-wide differential alternative splicing contributing to skin carcinogenesis in human HaCaT cell line.Arch Toxicol. 2025 Jun 13. doi: 10.1007/s00204-025-04104-1. Online ahead of print. Arch Toxicol. 2025. PMID: 40512198
-
Delineating the Effects of Passaging and Exposure in a Longitudinal Study of Arsenic-Induced Squamous Cell Carcinoma in a HaCaT Cell Line Model.Toxicol Sci. 2022 Jan 24;185(2):184-196. doi: 10.1093/toxsci/kfab129. Toxicol Sci. 2022. PMID: 34730829 Free PMC article.
-
A Systems Toxicology-based Approach Reveals Biological Pathways Dysregulated by Prenatal Arsenic Exposure.Ann Glob Health. 2016 Jan-Feb;82(1):189-96. doi: 10.1016/j.aogh.2016.01.015. Ann Glob Health. 2016. PMID: 27325076 Free PMC article. Review.
-
Arsenic-Induced Carcinogenesis: The Impact of miRNA Dysregulation.Toxicol Sci. 2018 Oct 1;165(2):284-290. doi: 10.1093/toxsci/kfy128. Toxicol Sci. 2018. PMID: 29846715 Free PMC article. Review.
Cited by
-
Dysregulation of mRNA expression by hsa-miR-186 overexpression in arsenic-induced skin carcinogenesis.Toxicol Appl Pharmacol. 2025 Feb;495:117209. doi: 10.1016/j.taap.2024.117209. Epub 2024 Dec 22. Toxicol Appl Pharmacol. 2025. PMID: 39719251 Free PMC article.
-
Chronic arsenic exposure and hsa-miR-186 overexpression causes transcriptome-wide differential alternative splicing contributing to skin carcinogenesis in human HaCaT cell line.Arch Toxicol. 2025 Jun 13. doi: 10.1007/s00204-025-04104-1. Online ahead of print. Arch Toxicol. 2025. PMID: 40512198
References
Publication types
MeSH terms
Substances
Grants and funding
LinkOut - more resources
Full Text Sources
Medical

