. 2024 Feb 19;24(1):175.
doi: 10.1186/s12877-024-04690-2.

Inflammatory markers and frailty in home-dwelling elderly, a cross-sectional study

Affiliations

Inflammatory markers and frailty in home-dwelling elderly, a cross-sectional study

Pia Bålsrud et al. BMC Geriatr. .

Abstract

Background: Low-grade, chronic inflammation during ageing, ("inflammageing"), is suggested to be involved in the development of frailty in older age. However, studies on the association between frailty, using the frailty index definition, and inflammatory markers are limited. The aim of this study was to investigate the relationship between inflammatory markers and frailty index (FI) in older, home-dwelling adults.

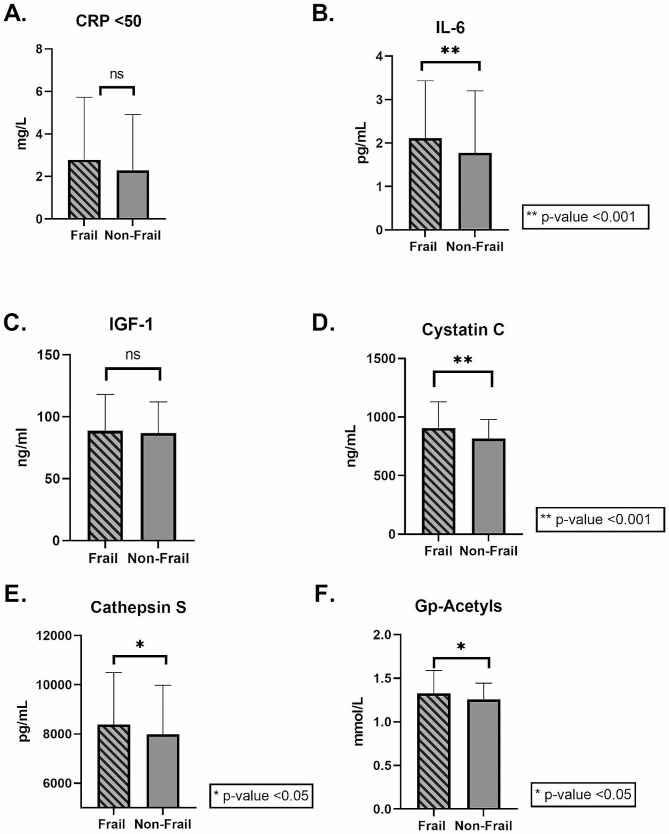
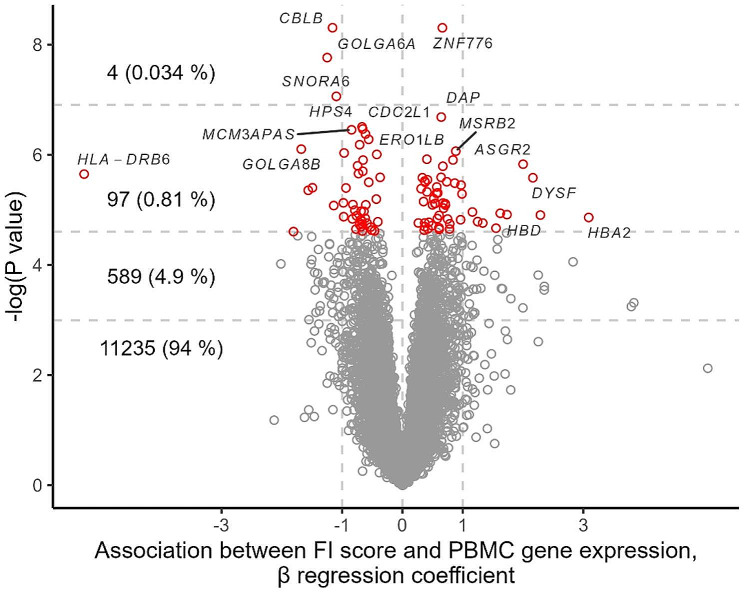
Method: Home-dwelling men and women aged ≥ 70 years old, living in South-East Norway were recruited and included in a cross-sectional study. The FI used in the current study was developed according to Rockwood's frailty index and included 38 variables, resulting in an FI score between 0 and 1 for each participant. Circulating inflammatory markers (IL-6, CRP, IGF-1, cystatin C, cathepsin S, and glycoprotein Acetyls) were analyzed from non-fasting blood samples using ELISA. Whole-genome PBMC transcriptomics was used to study the association between FI score and inflammation.

Results: The study population comprised 403 elderly (52% women), with a median age of 74 years and a mean BMI of 26.2 kg/m2. The mean FI score for the total group was 0.15 (range 0.005-0.56). The group was divided into a frail group (FI score ≥ 0.25) and non-frail group. After adjusting for BMI, age, sex, and smoking in the whole group, IL-6, cathepsin S, cystatin C, and Gp-acetyls remained significant associated to FI score (IL-6: 0.002, 95% CI: 0.001, 0.002, cathepsin S: 6.7e-06, 95% CI 2.44e-06, 0.00001, cystatin C: 0.004, 95% CI: 0.002, 0.006, Gp- Acetyls: 0.09, 95% CI: 0.05, 0.13, p < 0.01 for all), while CRP and IGF-1 were not (0.0003, 95% CI: -00001, 0.0007, p = 0.13, (-1.27e-06), 95% CI: (-0.0003), 0.0003, p = 0.99). There was a significant association between FI score and inflammatory markers, and FI score and monocyte-specific gene expression.

Conclusions: We found an association between FI score and inflammatory markers, and between FI score and monocyte-specific gene expression among elderly subjects above 70 years of age. Whether inflammation is a cause or consequence of frailty and whether the progression of frailty can be attenuated by reducing inflammation remains to be clarified.

Keywords: Ageing; Cross-sectional; Frailty; Frailty Index; Gene expression; Home-dwelling; Inflammageing; Inflammation; PBMC.


Conflict of interest statement

During the past 5 years, S. M. U. has received research grants from Mills DA and Olympic Seafood, none of which are related to the content of this manuscript. During the past 5 years, K. B. H. has received research grants or honoraria from Sanofi, not related to the contents of this manuscript. J.J.C. has received research grants and/or personal fees from Mills DA, none of which is related to the content of this manuscript. P.B. and I.O. has no conflict of interest.

Figures

Fig. 1
Fig. 1
The composition of the frailty index. The pie chart shows the sub-headings to categorize the 38 deficits included in the fraity index. An even distribution of deficits to each category will ensure that the index cover a range of systems
Fig. 2
Fig. 2
Inflammatory markers in frail vs. non-frail group. The bar charts show the differences in the concentration of inflammatory markers in the frailty groups, for; A.) CRP, B.) IL-6, C.) IGF-1, D.) cystatin C, E.) cathepsin S, and F.) Gp-acetyls. The data are an illustration of supplementary Table 3a and show significantly higher levels of IL-6 cystatin C, cathepsin S, and Gp-acetyls in the frail group, compared to the non-frail group. There were no significant differences in CRP or IGF-1 between the two groups. The cut-off value to be categorized as “frail” was set to ≥ 0.25. CRP levels ≥ 50 were excluded from the analysis. * P<0.05, **P<0.001. CRP, C-reactive protein; IL-6, interleukin 6; IGF-1, insulin growth factor 1; Gp-acetyls, Glycoprotein acetyls
Fig. 3
Fig. 3
Association between frailty index score and PBMC gene expression. The volcano plot shows the β regression coefficient (x-axis) and–log P-value (y-axis) for each gene transcript (total number of 11 925 transcripts). Horizontal lines correspond to (from the bottom) P-value thresholds 0.05, 0.01, and 0.001; the labels display the counts and proportions of the total number of transcripts within each P-value category. The annotated genes are a random subset among genes with P < 0.01. Abbreviations: FI, frailty index; PBMC, peripheral blood mononuclear cells
Fig. 4
Fig. 4
Association between Frailty index score and CIBERSORT-predicted cell types. The forest plot shows the unadjusted and adjusted (for age and BMI) β regression coefficients with 95% confidence intervals (CIs), colored by P-value. Abbreviations: CD4, cluster of differentiation 4; CD8, cluster of differentiation 8; FI, frailty index; NK, natural killer
Fig. 5
Fig. 5
Association between serum inflammatory biomarkers and monocyte-specific genes. The heatmap shows β regression coefficients between serum inflammatory biomarkers and PBMC gene expression for the top 30 monocyte-specific genes, as derived from a CIBERSORT analysis. The models were adjusted for age and BMI; to aid comparison, we scaled both inflammatory biomarkers and genes to a standard normal distribution (with mean zero and standard deviation one). Rows and columns are clustered by hierarchical clustering (Euclidean distance). Abbreviations: CRP, C-reactive protein; IGF1, insulin-like growth factor-1; IL6, interleukin 6; Gp-acetyls, glycoprotein acetyls. * P < 0.05, ** P < 0.01, *** P < 0.001

References

    1. WHO. Ageing and health www.who.int: World Health Organization (WHO); 2022 [updated 1. October 2022. Available from: https://www.who.int/news-room/fact-sheets/detail/ageing-and-health.
    1. Searle SD, Mitnitski A, Gahbauer EA, Gill TM, Rockwood K. A standard procedure for creating a frailty index. BMC Geriatr. 2008;8:24. doi: 10.1186/1471-2318-8-24. - DOI - PMC - PubMed
    1. Rockwood K, Mitnitski A. Frailty in relation to the accumulation of deficits. The Journals of Gerontology Series A Biological Sciences and Medical Sciences. 2007;62(7):722–7. doi: 10.1093/gerona/62.7.722. - DOI - PubMed
    1. Franceschi C, Campisi J. Chronic inflammation (inflammaging) and its potential contribution to age-associated diseases. The Journals of Gerontology Series A Biological Sciences and Medical Sciences. 2014;69 Suppl 1:S4–9. doi: 10.1093/gerona/glu057. - DOI - PubMed
    1. Franceschi C, Bonafè M, Valensin S, Olivieri F, De Luca M, Ottaviani E, et al. Inflamm-aging. An evolutionary perspective on immunosenescence. Ann N Y Acad Sci. 2000;908:244–54. doi: 10.1111/j.1749-6632.2000.tb06651.x. - DOI - PubMed

Publication types