

Development of a novel mycobiome diagnostic for fungal infection
- PMID: 38373963
- PMCID: PMC10875777
- DOI: 10.1186/s12866-024-03197-5
Development of a novel mycobiome diagnostic for fungal infection
Abstract
Background: Amplicon-based mycobiome analysis has the potential to identify all fungal species within a sample and hence could provide a valuable diagnostic assay for use in clinical mycology settings. In the last decade, the mycobiome has been increasingly characterised by targeting the internal transcribed spacer (ITS) regions. Although ITS targets give broad coverage and high sensitivity, they fail to provide accurate quantitation as the copy number of ITS regions in fungal genomes is highly variable even within species. To address these issues, this study aimed to develop a novel NGS fungal diagnostic assay using an alternative amplicon target.
Methods: Novel universal primers were designed to amplify a highly diverse single copy and uniformly sized DNA target (Tef1) to enable mycobiome analysis on the Illumina iSeq100 which is a low cost, small footprint and simple to use next-generation sequencing platform. To enable automated analysis and rapid results, a streamlined bioinformatics workflow and sequence database were also developed. Sequencing of mock fungal communities was performed to compare the Tef1 assay and established ITS1-based method. The assay was further evaluated using clinical respiratory samples and the feasibility of using internal spike-in quantitative controls was assessed.
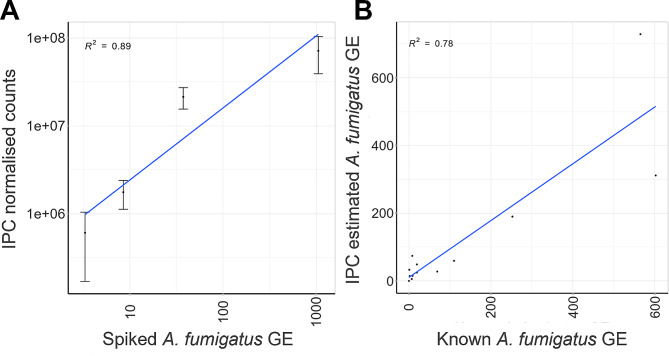
Results: The Tef1 assay successfully identified and quantified Aspergillus, Penicillium, Candida, Cryptococcus, Rhizopus, Fusarium and Lomentospora species from mock communities. The Tef1 assay was also capable of differentiating closely related species such as A. fumigatus and A. fischeri. In addition, it outperformed ITS1 at identifying A. fumigatus and other filamentous pathogens in mixed fungal communities (in the presence or absence of background human DNA). The assay could detect as few as 2 haploid genome equivalents of A. fumigatus from clinical respiratory samples. Lastly, spike-in controls were demonstrated to enable semi-quantitation of A. fumigatus load in clinical respiratory samples using sequencing data.
Conclusions: This study has developed and tested a novel metabarcoding target and found the assay outperforms ITS1 at identifying clinically relevant filamentous fungi. The assay is a promising diagnostic candidate that could provide affordable NGS analysis to clinical mycology laboratories.
Keywords: Amplicon sequencing; Diagnostics; Fungal infection; Mycobiome.
© 2024. The Author(s).
Conflict of interest statement
MJB is a director and shareholder of Syngenics Limited, PiQ laboratories Ltd and inpepcide Ltd. He is also a consultant for Rostra Ltd and had received funds from F2g Ltd outside the submitted work. MR is a shareholder in Richardson Bio-Tech. The remaining authors declare that they have no competing interests.
Figures


Similar articles
-
Porcine fungal mock community analyses: Implications for mycobiome investigations.Front Cell Infect Microbiol. 2023 Feb 8;13:928353. doi: 10.3389/fcimb.2023.928353. eCollection 2023. Front Cell Infect Microbiol. 2023. PMID: 36844394 Free PMC article.
-
EnsembleSeq: a workflow towards real-time, rapid, and simultaneous multi-kingdom-amplicon sequencing for holistic and resource-effective microbiome research at scale.Microbiol Spectr. 2024 Jun 4;12(6):e0415023. doi: 10.1128/spectrum.04150-23. Epub 2024 Apr 30. Microbiol Spectr. 2024. PMID: 38687072 Free PMC article.
-
Mycobiome Sequencing and Analysis Applied to Fungal Community Profiling of the Lower Respiratory Tract During Fungal Pathogenesis.Front Microbiol. 2019 Mar 15;10:512. doi: 10.3389/fmicb.2019.00512. eCollection 2019. Front Microbiol. 2019. PMID: 30930884 Free PMC article.
-
The Mycobiome in Health and Disease: Emerging Concepts, Methodologies and Challenges.Mycopathologia. 2020 Apr;185(2):207-231. doi: 10.1007/s11046-019-00413-z. Epub 2020 Jan 1. Mycopathologia. 2020. PMID: 31894501 Free PMC article. Review.
-
Resistance in human pathogenic yeasts and filamentous fungi: prevalence, underlying molecular mechanisms and link to the use of antifungals in humans and the environment.Dan Med J. 2016 Oct;63(10):B5288. Dan Med J. 2016. PMID: 27697142 Review.
Cited by
-
Recent developments in Aspergillus fumigatus research: diversity, drugs, and disease.Microbiol Mol Biol Rev. 2025 Mar 27;89(1):e0001123. doi: 10.1128/mmbr.00011-23. Epub 2025 Feb 10. Microbiol Mol Biol Rev. 2025. PMID: 39927770 Review.
-
Prevalence and genetic diversity of Parechovirus.Virus Res. 2024 Nov;349:199461. doi: 10.1016/j.virusres.2024.199461. Epub 2024 Sep 18. Virus Res. 2024. PMID: 39278352 Free PMC article.
-
The Significance of Fungal Specialized Metabolites in One Health Perspectives.Int J Mol Sci. 2025 Mar 28;26(7):3120. doi: 10.3390/ijms26073120. Int J Mol Sci. 2025. PMID: 40243890 Free PMC article. Review.
References
-
- Bongomin F, Gago S, Oladele RO, Denning DW. Global and Multi-National Prevalence of Fungal Diseases-Estimate Precision. J Fungi Basel Switz [Internet]. 2017 Dec 1 [cited 2022 Sep 27];3(4). Available from: https://pubmed.ncbi.nlm.nih.gov/29371573/. - PMC - PubMed
-
- World Health Organization. WHO fungal priority pathogens list to guide research, development and public health action [Internet]. 2022. Available from: https://www.who.int/publications/i/item/9789240060241.
-
- Friedman DZP, Schwartz IS. Emerging Fungal Infections: New Patients, New Patterns, and New Pathogens. J Fungi Basel Switz [Internet]. 2019 Sep 1 [cited 2022 Sep 27];5(3). Available from: https://pubmed.ncbi.nlm.nih.gov/31330862/. - PMC - PubMed
MeSH terms
Substances
Grants and funding
LinkOut - more resources
Full Text Sources
Medical
