. 2024 Feb 19;17(1):44.
doi: 10.1186/s13048-024-01368-6.

High levels of fatty acid-binding protein 5 excessively enhances fatty acid synthesis and proliferation of granulosa cells in polycystic ovary syndrome

Affiliations

High levels of fatty acid-binding protein 5 excessively enhances fatty acid synthesis and proliferation of granulosa cells in polycystic ovary syndrome

Jingyu Liu et al. J Ovarian Res. .

Retraction in

Abstract

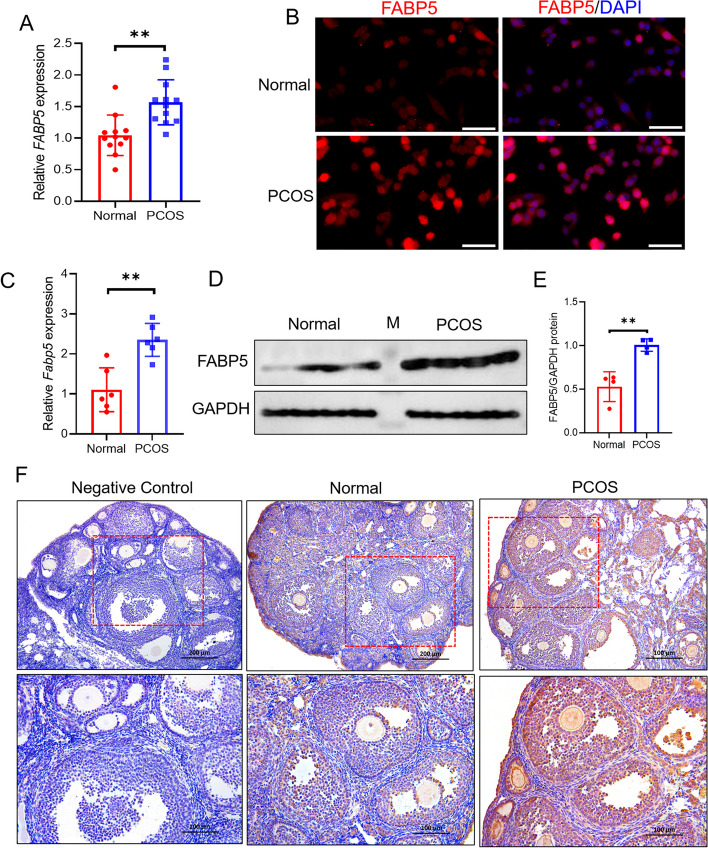
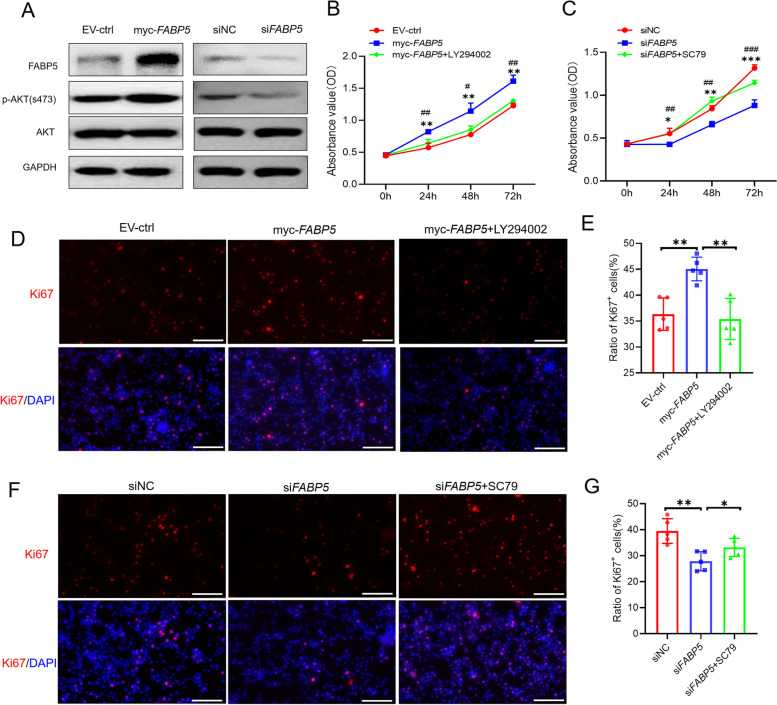
Background: Polycystic ovary syndrome (PCOS) is one of the most complex endocrine disorders in women of reproductive age. Abnormal proliferation of granulosa cells (GCs) is an important cause of PCOS. This study aimed to explore the role of fatty acid-binding protein 5 (FABP5) in granulosa cell (GC) proliferation in polycystic ovary syndrome (PCOS) patients.

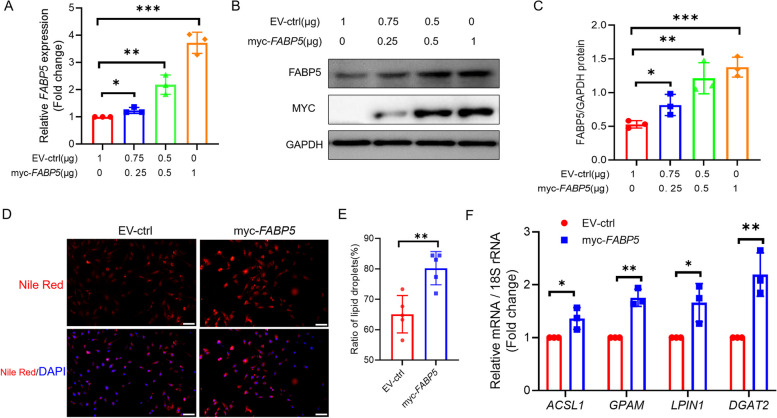
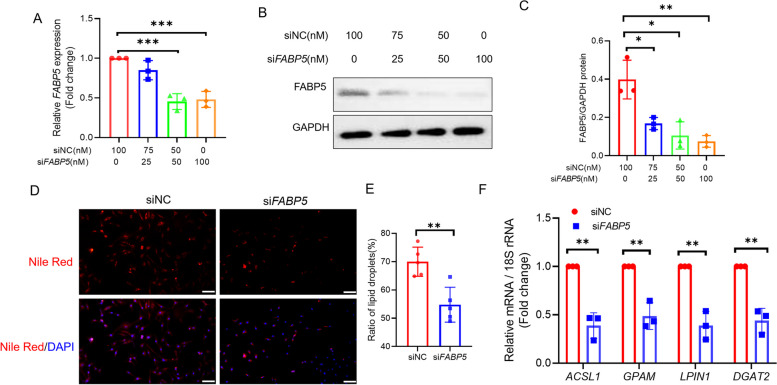
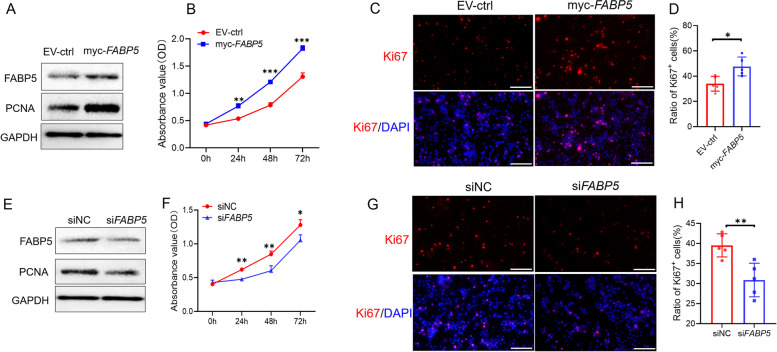
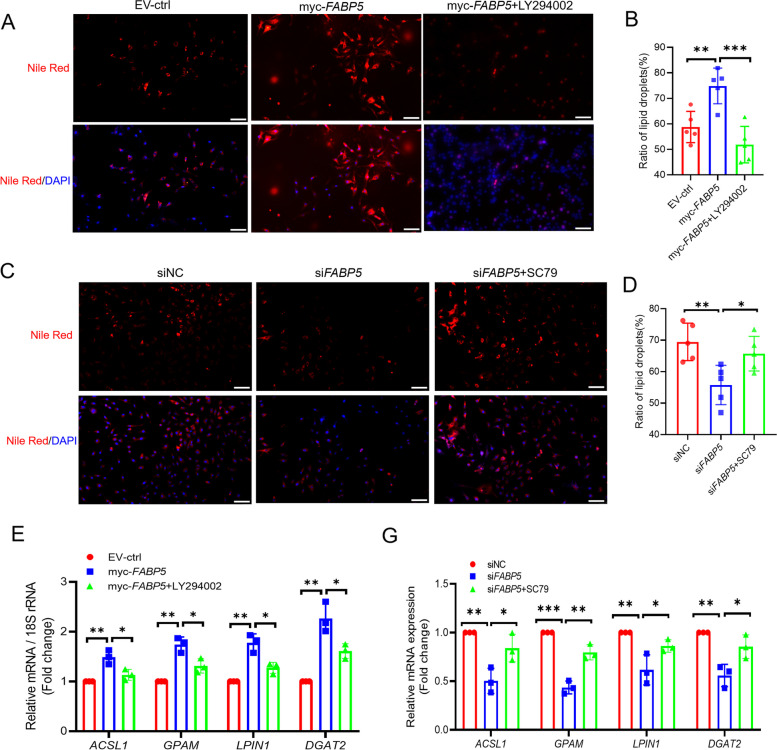
Methods: The FABP5 gene, which is related to lipid metabolism, was identified through data analysis of the gene expression profiles of GSE138518 from the Gene Expression Omnibus (GEO) database. The expression levels of FABP5 were measured by quantitative real-time PCR (qRT‒PCR) and western blotting. Cell proliferation was evaluated with a cell counting kit-8 (CCK-8) assay. Western blotting was used to assess the expression of the proliferation marker PCNA, and immunofluorescence microscopy was used to detect Ki67 expression. Moreover, lipid droplet formation was detected with Nile red staining, and qRT‒PCR was used to analyze fatty acid storage-related gene expression.

Results: We found that FABP5 was upregulated in ovarian GCs obtained from PCOS patients and PCOS mice. FABP5 knockdown suppressed lipid droplet formation and proliferation in a human granulosa-like tumor cell line (KGN), whereas FABP5 overexpression significantly enhanced lipid droplet formation and KGN cell proliferation. Moreover, we determined that FABP5 knockdown inhibited PI3K-AKT signaling by suppressing AKT phosphorylation and that FABP5 overexpression activated PI3K-AKT signaling by facilitating AKT phosphorylation. Finally, we used the PI3K-AKT signaling pathway inhibitor LY294002 and found that the facilitation of KGN cell proliferation and lipid droplet formation induced by FABP5 overexpression was inhibited. In contrast, the PI3K-AKT signaling pathway agonist SC79 significantly rescued the suppression of KGN cell proliferation and lipid droplet formation caused by FABP5 knockdown.

Conclusions: FABP5 promotes active fatty acid synthesis and excessive proliferation of GCs by activating PI3K-AKT signaling, suggesting that abnormally high expression of FABP5 in GCs may be a novel biomarker or a research target for PCOS treatment.

Keywords: FABP5; Fatty acid synthesis; Granulosa cell; PCOS; PI3K-AKT; Proliferation.


Conflict of interest statement

The authors declare no competing interests.

Figures

Fig. 1
Fig. 1
Bioinformatic analysis of DEGs with significant differences in the GSE138518 dataset. A Volcano plot filtering of the SEGs and DEGs with significant differences in the GSE138518 dataset. B Cluster heatmap of significant DEGs. C Top 30 enriched GO terms of the significant DEGs. D The 30 pathways associated with the significant DEGs. E Cluster heatmap of the key significant DEGs involved in lipid metabolism
Fig. 2
Fig. 2
Aberrantly increased expression of FABP5 in GCs of patients and ovaries of mice with PCOS. A Bar plot showing FABP5 mRNA expression in the human primary ovarian GCs of PCOS patients and healthy individuals, as measured by qRT‒PCR (n = 12). B Immunofluorescence staining of FABP5 in human primary ovarian GCs of PCOS patients and healthy individuals. Scale bar, 50 μm. C Bar plot showing the expression of Fabp5 mRNA in the ovaries of mice with PCOS measured by qRT‒PCR (n = 6). D, E Immunoblot plot (D) and bar plot of the statistical analysis (E) showing the expression of FABP5 in the ovaries of mice with PCOS determined by Western blot analysis (n = 4). F Immunohistochemical plot of FABP5 expression and localization in the ovaries of mice with PCOS. A two-tailed unpaired t test was used for all the statistical analyses in this section. ** P < 0.01
Fig. 3
Fig. 3
Overexpression of FABP5 promotes fatty acid synthesis in KGN cells. A Bar plot showing the expression of FABP5 in KGN cells after transfection with the PCS2-myc-FABP5 or empty vector plasmids for 48 h, as determined via qRT‒PCR. B, C Immunoblotting plot (B) and bar plot of statistical analysis (C) showing the expression of FABP5 in KGN cells transfected with PCS2-myc-FABP5 or empty vector plasmids for 48 h. D Nile red staining of KGN cells after 48 h of FABP5 overexpression. The red signal indicates the formation of lipid droplets. All the samples were also stained with DAPI. Scale bar, 100 μm. E Statistical analysis of the number of lipid droplets. Five fields of view were randomly selected. F Bar plot showing the ACSL1, GPAM1, LPIN1 and DGAT2 mRNA expression in KGN cells after 48 h of FABP5 expression. A two-tailed unpaired t test was used for all the statistical analyses in this section. * P < 0.05, ** P < 0.01, ***P < 0.001. The groups transfected with the empty vector control or pCS2-myc-FABP5 plasmids were referred to as the EV-ctrl and myc-FABP5 groups, respectively
Fig. 4
Fig. 4
Knockdown of FABP5 inhibits fatty acid synthesis in KGN cells. A Bar plot showing the expression of FABP5 in KGN cells after transfection with FABP5 or negative control siRNAs for 48 h. B, C Immunoblot plot (B) and bar plot of the statistical analysis (C) showing the expression of FABP5 in KGN cells transfected with FABP5 or negative control siRNAs for 48 h. D Nile red staining diagram of KGN cells after transfection with FABP5 siRNA for 48 h. The red signal indicates the formation of lipid droplets. All the samples were also stained with DAPI. Scale bar, 100 μm. E Statistical analysis of the number of lipid droplets. Five fields of view were randomly selected. F Bar plot showing ACSL1, GPAM1, LPIN1 and DGAT2 mRNA expression in KGN cells after transfection with FABP5 siRNA for 48 days. A two-tailed unpaired t test was used for all the statistical analyses in this section. * P < 0.05, ** P < 0.01, ***P < 0.001. The groups transfected with the negative control siRNA or with FABP5 siRNA were referred to as siNC and siFABP5, respectively
Fig. 5
Fig. 5
FABP5 facilitates KGN cell proliferation. A Immunoblotting plot showing the expression of FABP5 and the cell proliferation marker PCNA in KGN cells after 48 h of FABP5 overexpression. B A line chart showing the proliferation of KGN cells after 48 h of FABP5 overexpression, as determined by CCK8 assays. C Immunofluorescence staining of Ki67 in KGN cells after 48 h of FABP5 overexpression. All the samples were also stained with DAPI. Scale bar, 100 μm. D Statistical analysis of the Ki67-positive cells. Five fields of view were randomly selected. E Immunoblotting plot showing the expression of FABP5 and PCNA in KGN cells after transfection with FABP5 or negative control siRNAs for 48 h. F Line chart showing the proliferation of KGN cells after transfection with FABP5 or negative control siRNAs for 48 h, as determined by CCK8 assays. G Immunofluorescence staining of Ki67 in KGN cells after transfection with FABP5 or negative control siRNAs for 48 h. All samples were also stained with DAPI. Scale bar, 100 μm. H Statistical analysis of the Ki67-positive cells. Five fields of view were randomly selected. A two-tailed unpaired t test was used for all the statistical analyses. * P < 0.05, ** P < 0.01, ***P < 0.001
Fig. 6
Fig. 6
FABP5 accelerates the proliferation of KGN cells by activating PI3K-AKT signaling. A Immunoblotting plot showing the expression of FABP5 and AKT and the phosphorylation of AKT in KGN cells after 48 h of FABP5 overexpression or knockdown. B, C Line chart showing the proliferation of KGN cells treated with 10 μM LY294002 or SC79 after 48 h of FABP5 overexpression or knockdown, as determined by CCK8 assays. * represents the comparison between the EV-ctrl and myc-FABP5 or siNC and siFABP5 groups; # represents the comparison between the myc-FABP5 and myc-FABP5 + LY294002 or siFABP5 and siFABP5 + SC79 groups; D, F Immunofluorescence staining of Ki67 in KGN cells treated with 10 μM LY294002 or SC79 for 48 h after FABP5 was overexpressed or knocked down. Scale bar, 100 μm. E, G Statistical analysis of Ki67-positive cells. Five fields of view were randomly selected. *P < 0.05, **P < 0.01, ***P < 0.001. ##P < 0.01, ###P < 0.01
Fig. 7
Fig. 7
FABP5 accelerates fatty acid synthesis in KGN cells by activating PI3K-AKT signaling (A, C) Nile red staining of KGN cells treated with 10 μM LY294002 or SC79 for 48 h after 48 h of FABP5 overexpression or knockdown. The red signal indicates the formation of lipid droplets. All the samples were also stained with DAPI. Scale bar, 100 μm. B, D Statistical analysis of the number of lipid droplets. Five fields of view were randomly selected. E, G Bar plot showing ACSL1, GPAM1, LPIN1 and DGAT2 mRNA expression in KGN cells treated with 10 μM LY294002 or SC79 for 48 h after FABP5 overexpression or knockdown. A two-tailed unpaired t test was used for all the statistical analyses. *P < 0.05, **P < 0.01, ***P < 0.001.

Similar articles

Cited by

References

    1. March WA, Moore VM, Willson KJ, Phillips DI, Norman RJ, Davies MJ. The prevalence of polycystic ovary syndrome in a community sample assessed under contrasting diagnostic criteria. Human Reprod. 2010;25(2):544–551. - PubMed
    1. Rotterdam ESHRE/ASRM-Sponsored PCOS Consensus Workshop Group Revised 2003 consensus on diagnostic criteria and long-term health risks related to polycystic ovary syndrome (PCOS) Human Reprod. 2004;19(1):41–47. - PubMed
    1. Rimon-Dahari N, Yerushalmi-Heinemann L, Alyagor L, Dekel N. Ovarian Folliculogenesis. Results Probl Cell Differ. 2016;58:167–190. - PubMed
    1. Tu J, Cheung AH, Chan CL, Chan WY. The Role of microRNAs in Ovarian Granulosa Cells in Health and Disease. Front Endocrinol. 2019;10:174. - PMC - PubMed
    1. Li M, Zhao H, Zhao SG, Wei DM, Zhao YR, Huang T, Muhammad T, Yan L, Gao F, Li L, Lu G, Chan WY, et al. The HMGA2-IMP2 Pathway Promotes Granulosa Cell Proliferation in Polycystic Ovary Syndrome. J Clin Endocrinol Metab. 2019;104(4):1049–1059. - PMC - PubMed

Publication types

MeSH terms