. 2024 Feb 19;15(1):1508.
doi: 10.1038/s41467-024-45646-9.

A transient protein folding response targets aggregation in the early phase of TDP-43-mediated neurodegeneration

Affiliations

A transient protein folding response targets aggregation in the early phase of TDP-43-mediated neurodegeneration

Rebecca San Gil et al. Nat Commun. .

Abstract

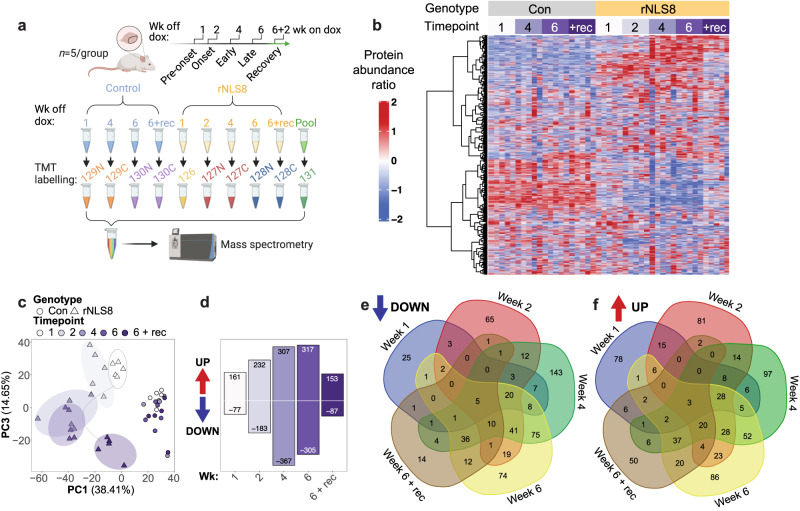
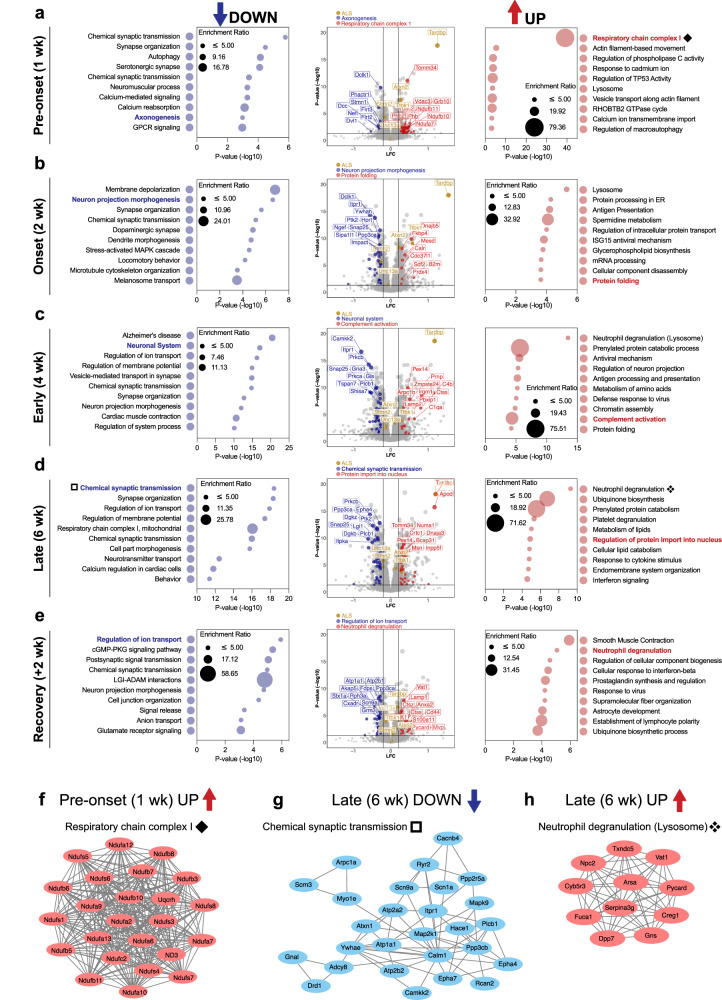
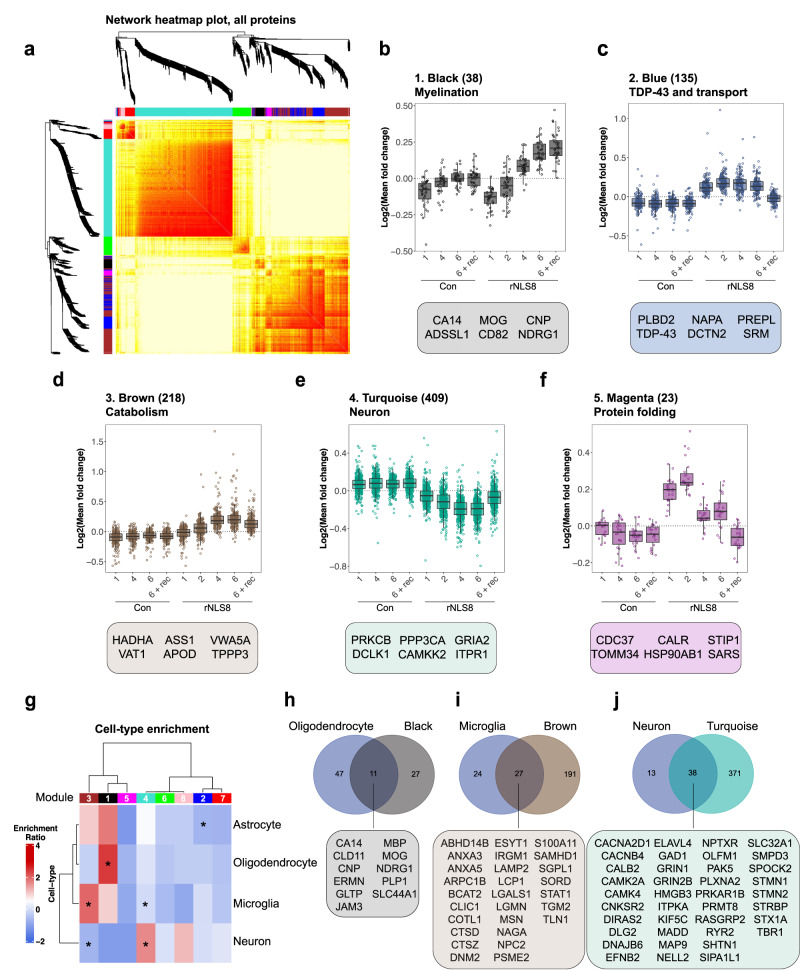
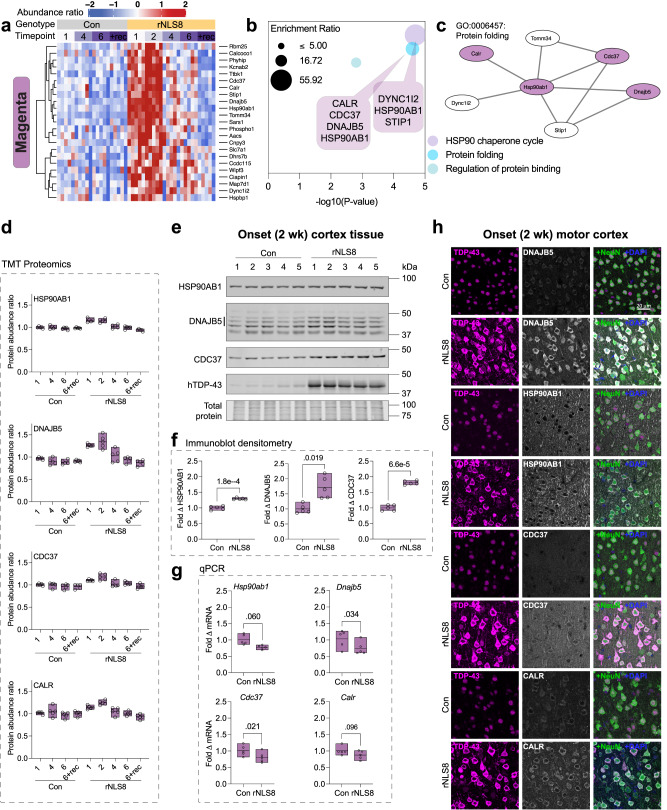
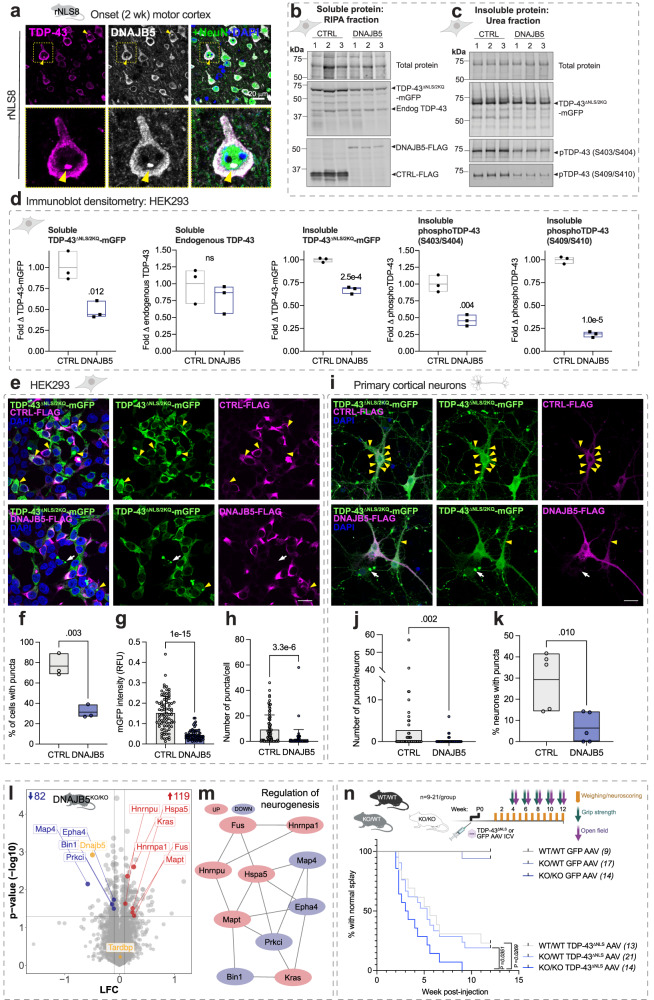
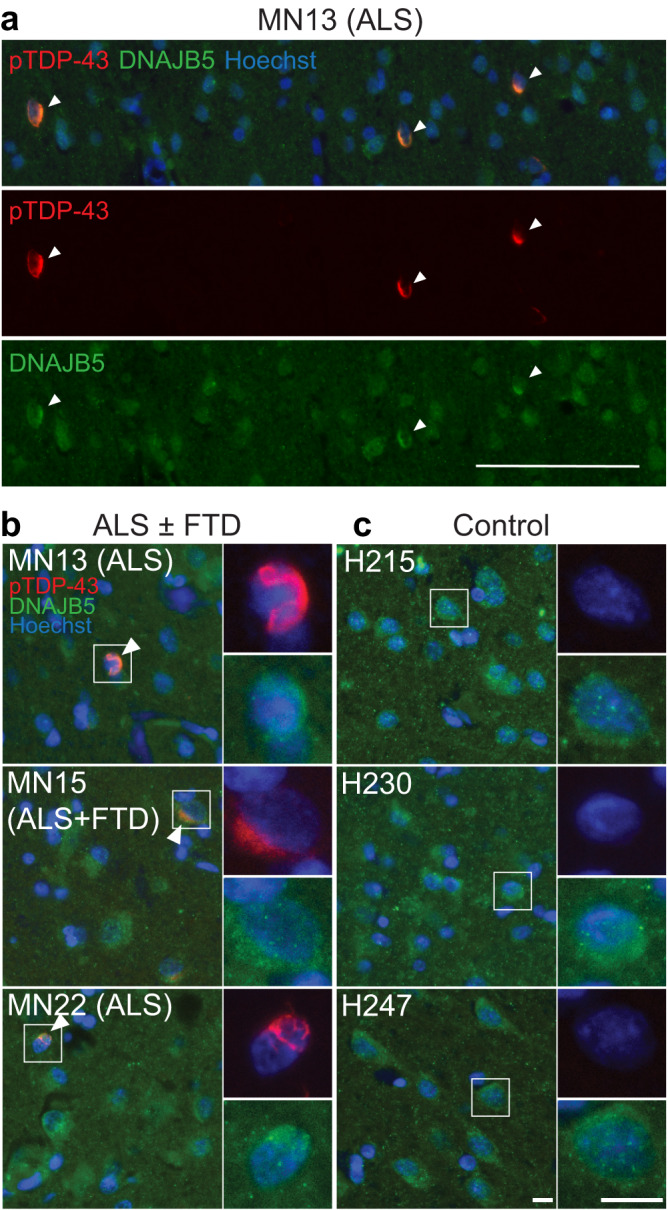
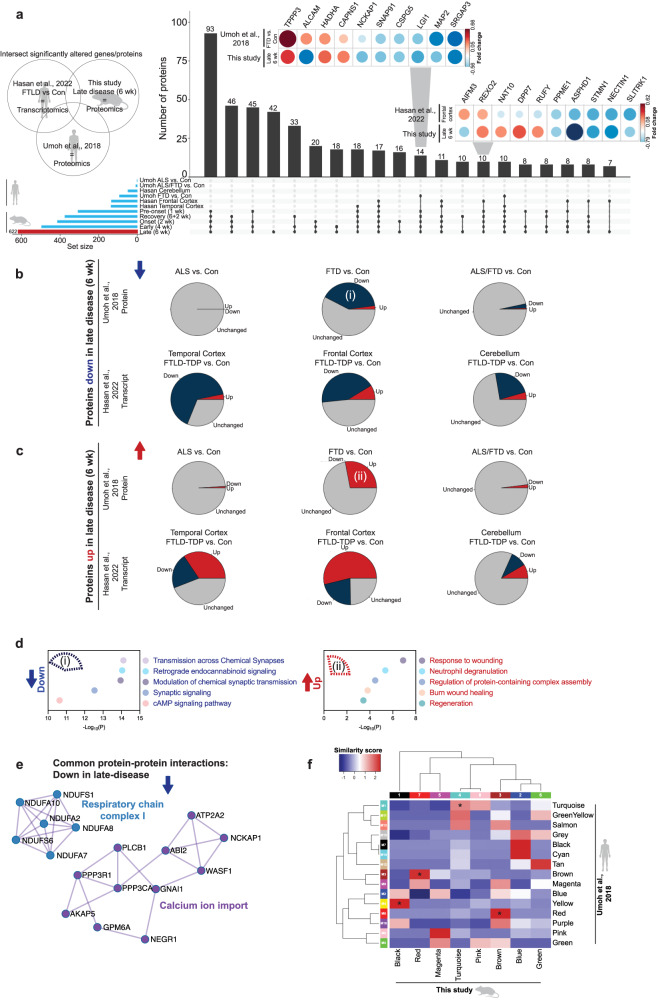
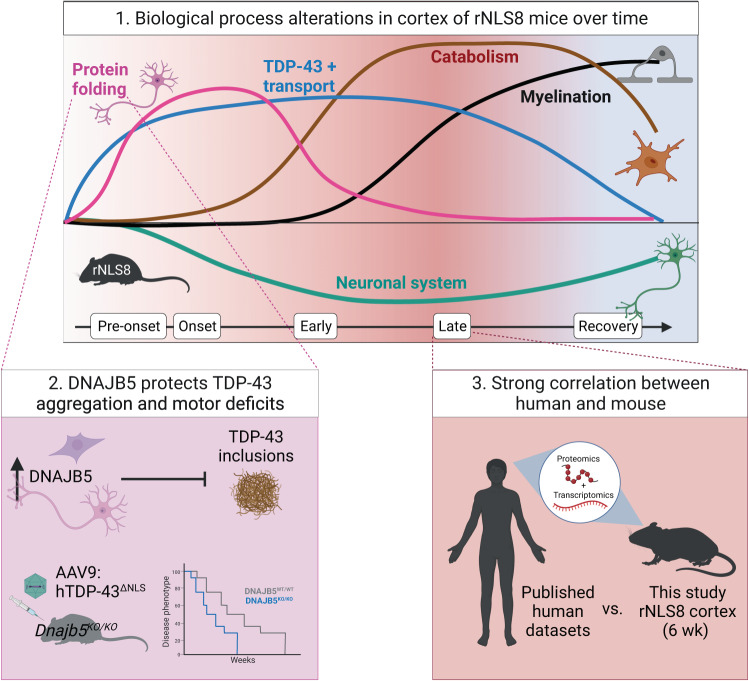
Understanding the mechanisms that drive TDP-43 pathology is integral to combating amyotrophic lateral sclerosis (ALS), frontotemporal lobar degeneration (FTLD) and other neurodegenerative diseases. Here we generated a longitudinal quantitative proteomic map of the cortex from the cytoplasmic TDP-43 rNLS8 mouse model of ALS and FTLD, and developed a complementary open-access webtool, TDP-map ( https://shiny.rcc.uq.edu.au/TDP-map/ ). We identified distinct protein subsets enriched for diverse biological pathways with temporal alterations in protein abundance, including increases in protein folding factors prior to disease onset. This included increased levels of DnaJ homolog subfamily B member 5, DNAJB5, which also co-localized with TDP-43 pathology in diseased human motor cortex. DNAJB5 over-expression decreased TDP-43 aggregation in cell and cortical neuron cultures, and knockout of Dnajb5 exacerbated motor impairments caused by AAV-mediated cytoplasmic TDP-43 expression in mice. Together, these findings reveal molecular mechanisms at distinct stages of ALS and FTLD progression and suggest that protein folding factors could be protective in neurodegenerative diseases.


Conflict of interest statement

The authors declare no competing interests.

Figures

Fig. 1
Fig. 1. Longitudinal proteomics of rNLS8 mice reveals global changes in protein profiles in the cortex at pre-onset, onset, early, and late disease, and in recovery.
a Schematic of experiment design and tandem mass tag (TMT) labeling. b Heat map of the protein abundance ratio of quantified proteins in control (Con) and rNLS8 mice at 1, 2, 4, and 6 weeks off doxycycline (dox) and mice in recovery (+rec; 6 wk off dox and 2 wk on dox). Each column represents data from an individual mouse (n = 5 per group). c Principal component (PC) analysis dimensions PC1 and PC3 (proportion of variation from top 5 PC in parentheses). d Number of proteins significantly increased or decreased in rNLS8 mice at each timepoint compared to controls. Significantly altered proteins were identified using two-sided student t tests of log-transformed ratios (P < 0.05, fold change >1.2; Supplementary Data 2). e Venn diagram showing the number of significantly decreased proteins that are common and unique to each time point in rNLS8 mice compared to controls. f Venn diagram showing the number of significantly increased proteins that are common and unique to each time point in rNLS8 mice compared to controls. Source data are provided as a Source Data file.
Fig. 2
Fig. 2. Gene ontology analysis reveals alterations of key biological processes driven by TDP-43-mediated disease.
ae Metascape gene ontology of significantly decreased (left) and increased proteins (right) with the size of the bubble being dependent on the enrichment ratio of each term. Volcano plots (middle) of mean log fold change (LFC; rNLS8/Con) and significance level (P value (−log10)). Proteins belonging to selected disease-relevant gene ontology terms at each timepoint have been highlighted. The protein subset that is decreased is shown in blue and increased in red. A select subset of ALS-associated proteins has been highlighted in gold. The top 10 proteins, ranked by P value, in each highlighted gene ontology subset of proteins have been labeled. Significantly altered proteins were identified based on two-sided student t tests of log-transformed ratios (P < 0.05, fold change >1.2). a Pre-onset (1 wk), (b) onset (2 wk), (c) early disease (4 wk), (d) late disease (6 wk) and (e) recovery (6 wk + 2 wk on dox recovery) mice. f Protein–protein interactions of components of the mitochondrial respiratory chain complex 1, which are increased in pre-onset rNLS8 mice (1 wk, a). g Protein–protein interaction network of components of chemical synaptic transmission, which are significantly decreased in late-disease rNLS8 mice (6 wk, d). h Protein–protein interactions of components of neutrophil degranulation (lysosomes), which are increased in late-disease mice (6 wk, d). Source data are provided as a Source Data file.
Fig. 3
Fig. 3. Weighted correlation network analysis of longitudinal quantitative proteomics of rNLS8 mouse cortex reveals specific modules of proteins that correlate with distinct disease stages.
a Hierarchical clustering based on topology overlap measurement distance reveals 8 modules by WCNA. bf Log fold change of protein abundance in control (Con) and rNLS8 cortex at each timepoint for each subset of module proteins. b Black, (c) blue, (d) brown, (e) turquoise, and (f) magenta modules are disease-relevant and show changes in protein abundance in the rNLS8 cortex only. The number of proteins in each module is listed in parentheses together with the top gene ontology term. Featured proteins from each module represent the top 6 proteins ranked by module membership (kME) value. All data are from n = 5 mice per group and each data point (open circles) represents the mean log fold change of each protein in each module. Box and whisker plots in (bf) show a line at the median, upper and lower hinges are the first and third quartiles, and the top and bottom whiskers extend to the largest and lowest value no more than 1.5 * the inter-quartile range, respectively. g Cell-type enrichment analysis of modules with astrocytic, microglial, oligodendrocyte, and neuronal protein lists derived from published datasets. Modules were identified as significantly enriched or depleted of cell-specific proteins using a Fisher’s exact test. h Overlap of all oligodendrocyte-specific and black module proteins. i Overlap of all microglial-specific and brown module proteins. j Overlap of all neuronal-specific and turquoise module proteins. All proteins listed are in alphabetical order. Source data are provided as a Source Data file.
Fig. 4
Fig. 4. Protein folding components are specifically increased in abundance in rNLS8 mouse cortex neurons by post-transcriptional mechanisms at the earliest stages of disease.
a Heatmap of protein abundance ratios in control (Con) and rNLS8 mouse cortex identified in the magenta module (n = 5 mice per group). b Gene ontology analysis of magenta module proteins. Protein sets were analyzed using Metascape where significantly enriched gene ontology terms were identified using the hypergeometric test and Benjamini-Hochberg P value correction algorithm. Plotted by significance (-log10 P value) and overlaid with callouts that list associated proteins. c Protein–protein interaction network of protein folding factors in the magenta module. d Protein abundance ratio from quantitative tandem mass tag (TMT) proteomics of heat shock protein 90 alpha family class B member 1 (HSP90AB1), DnaJ homolog subfamily B member 5 (DNAJB5), cell division cycle 37 (CDC37) HSP90 co-chaperone, and calreticulin (CALR). e Immunoblot of RIPA-soluble whole cortex lysates at disease onset (2 wk). Tissue was probed for HSP90AB1 (90 kDa), DNAJB5 (40–45 kDa, three bands, Supplementary Fig. 8), and CDC37 (50 kDa). f Fold change in protein levels relative to the mean of control mice and normalized to total protein loading from immunoblot densitometry. g qPCR quantification of fold change in mRNA transcript level of target genes in the rNLS8 cortex at disease onset (2 wk) relative to the mean of control mice and normalized to the Gapdh housekeeping gene. Differences in the means of control and rNLS8 mice were determined using a two-sided paired t test, where P < 0.05 was considered statistically significant. h Immunofluorescence microscopy of the primary motor cortex in control and rNLS8 mice at disease onset. Samples were immunolabeled for each target, DNAJB5, HSP90AB1, CDC37, and CALR (top to bottom), and co-labeled for TDP-43, NeuN (pan-neuronal marker) and DAPI. Representative images from n = 3 mice. Scale bar = 20 μm. All data are from n = 5 mice per group (open circles). Data presented as floating bars in (d, f, g) show a line at the mean and the range displayed by floating bars. Source data are provided as a Source Data file.
Fig. 5
Fig. 5. Over-expression of DNAJB5 has anti-aggregation activities in cells, and knockout of DNAJB5 exacerbates cytoplasmic TDP-43-associated motor impairments in vivo.
a Primary motor cortex in rNLS8 mice at disease onset. Yellow arrow and zoom showing a TDP-43-positive punctum. Scale bar = 20 μm. Immunoblot analysis of (b) soluble and (c) insoluble fractionated lysates. d Immunoblot densitometry analysis of soluble TDP-43ΔNLS/2KQ-mGFP, soluble endogenous TDP-43, and insoluble TDP-43ΔNLS/2KQ-mGFP, phosphoTDP-43(S403/S404), and phosphoTDP-43(S409/S410) levels. e HEK293 cells immunolabeled with anti-FLAG. Scale bar = 20 μm. Yellow arrows = inclusions in co-transfected cells and white arrows = TDP-43ΔNLS/2KQ-mGFP only. f Proportion of cells with puncta. g TDP-43ΔNLS/2KQ-mGFP relative fluorescent units (RFU) per cell. h Number of puncta per cell. Data in (g, h) are from n = 83 CTRL and n = 69 DNAJB5 cells, error bars represent standard deviation. Data from (ah) are from n = 3 independent experiments. i Primary cortical neurons expressing CTRL-FLAG or DNAJB5-FLAG with TDP-43ΔNLS/2KQ-mGFP and immunolabeled with anti-FLAG. Scale bar = 20 μm. j Number of puncta formed per neuron from n = 62 CTRL and n = 123 DNAJB5 neurons. k Proportion of neurons with puncta. Data in (i, j, k) are from n = 5 independent experiments. Data points in (g, h, j) show single-cell data from one representative independent experiment. Data presented as floating bars in (d, f, k) show a line at the mean and the range. Differences between the means for (d, f, k) were determined using two-sided unpaired t tests and (g, h, j) were determined using two-sided t test with Welch’s correction. l Volcano plots of TMT quantitative proteomics from Dnajb5 knockout mouse cortex, log fold change (LFC; Dnajb5KO/KO/Dnajb5WT/WT) and P value (-log10). Inset numbers = significantly decreased (blue) and increased (red; P < 0.05, fold change > 1.2) proteins. Data are the means of n = 3 mice per group. Statistically significant differences in relative protein abundance was determined using two-sided student t tests. m Protein–protein interaction network of significantly altered proteins in Dnajb5KO/KO cortex. n Kaplan–Meier curves showing the proportion of animals with normal hindlimb splay (n = italicized numbers) over time. Differences in the curves were determined by log-rank (Mantel-Cox) test. Source data are provided as a Source Data file.
Fig. 6
Fig. 6. Localization of DNAJB5 and phosphoTDP-43 in the post-mortem motor cortex of human ALS and ALS-FTD cases.
Immunohistochemical labeling of DNAJB5 (green) and phosphoTDP-43 (red) in the post-mortem motor cortex of n = 3 non-neurologically diseased controls and n = 3 ALS or ALS + FTD cases (Table 2). a Wide field of view of MN13 (ALS). White arrows show neurons with co-localization of phosphoTDP-43 and DNAJB5. Scale bar = 100 μm. b Zoom of ALS and ALS-FTD cases MN13 (ALS), MN15 (ALS + FTD) and MN22 (ALS); and (c) neurologically normal cases H215, H230 and H247. Co-localization indicated by white arrows. Nuclei counterstained with Hoechst (blue). Scale bars, 10 µm. Abbreviations: ALS, amyotrophic lateral sclerosis; FTD, frontotemporal dementia.
Fig. 7
Fig. 7. Substantial overlap of altered proteins in the cortex of late-disease rNLS8 mice (6 wk) and end-stage human post-mortem ALS, ALS/FTLD, and FTLD-TDP cases.
Meta-analysis of significantly altered proteins in late disease rNLS8 mice (6 wk) with selected published datasets of end-stage human TDP-43 proteinopathies. a Upset plot representing the intersection of proteins that are altered in abundance (increased and decreased) in three studies, (1) this study, (2) human end-stage ALS, FTLD or ALS/FTLD proteomics, and (3) human end-stage transcriptomics of FTLD cerebellum, temporal cortex, and frontal cortex. Horizontal bars represent the total number of altered proteins/transcripts (set size) in each sample. Vertical bars represent the number of intersecting proteins of each sample comparison (comparisons are denoted as dots connected by lines below the X axis). Inset: Top 10 proteins significantly decreased or increased in late disease (6 wk) rNLS8 mouse proteomics and end-stage human FTLD-TDP-43 frontal cortex proteomics. This plot shows the reported fold change. Blue = decreased levels and red = increased levels. Direction of fold change of intersecting proteins that are (b) decreased and (c) increased in late-disease (6 wk) rNLS8 mice, in human proteomic, and corresponding genes in human transcriptomic datasets. Gray = unchanged, blue = down, and red = up. d Gene ontology and (e) protein-protein interactions of significantly decreased or increased proteins in late-disease (6 wk) rNLS8 mouse proteomics and end-stage human FTLD-TDP-43 frontal cortex proteomics. Protein sets were analyzed using Metascape where significantly enriched gene ontology terms were identified using the hypergeometric test and Benjamini-Hochberg P value correction algorithm. f Comparison of WCNA modules in this study with human frontal cortex proteomics from clinically defined ALS, FTLD, and ALS/FTLD cases. Blue is low and red is high percentage similarity between protein lists in modules. Modules that were significantly enriched (*) of proteins (compared to the background list) were identified using a two-sided Fisher’s exact test with multiple testing correction (Holm correction). Black(1):Yellow(M4) P = 1.78 × 10−19, Red(7):Brown(M3) P = 1.11 × 10−19, Turquoise(4):Turquoise(M1) P = 2.21 × 10−18, and Brown(3):Red(M6) P = 4.28 × 10−7. Source data are provided as a Source Data file.
Fig. 8
Fig. 8. Cytoplasmic TDP-43-mediated disease is defined by dynamic alterations to the cortex proteome over time.
1. A schematic of the alterations to biological processes in the rNLS8 cortex over the time course of disease identified by quantitative proteomics. Increases in the abundance of protein folding factors and transport components define early disease, and catabolism and myelination define late disease molecular signatures. Accelerating decreases in neuronal system and chemical synaptic transmission components occurs throughout the disease trajectory with a partial reversal of some proteins to control levels in recovery. 2. One of the increased protein folding factors identified in the rNLS8 cortex, DNAJB5, showed anti-aggregation activities in cell and neuronal culture models. Further, Dnajb5 knockout mice demonstrated worsened motor impairments in an AAV model of cytoplasmic TDP-43 disease. This shows that DNAJB5 protects against cytoplasmic TDP-43 aggregation and motor deficits. 3. A strong correlation in the proteomic signature of late disease mouse and post-mortem cortex tissue of cases with TDP-43 proteinopathy validate the rNLS8 mouse model. Therefore, findings at early disease timepoints in the rNLS8 cortex may accelerate our understanding of the mechanisms driving disease onset and early disease.

References

    1. Ito D, Hatano M, Suzuki N. RNA binding proteins and the pathological cascade in ALS/FTD neurodegeneration. Sci. Transl. Med. 2017;9:eaah5436. doi: 10.1126/scitranslmed.aah5436. - DOI - PubMed
    1. Gasset-Rosa F, et al. Cytoplasmic TDP-43 de-mixing independent of stress granules drives inhibition of nuclear import, loss of nuclear TDP-43, and cell death. Neuron. 2019;102:339–357.e337. doi: 10.1016/j.neuron.2019.02.038. - DOI - PMC - PubMed
    1. Conicella AE, Zerze GH, Mittal J, Fawzi NL. ALS mutations disrupt phase separation mediated by α-helical structure in the TDP-43 low-complexity C-terminal domain. Structure. 2016;24:1537–1549. doi: 10.1016/j.str.2016.07.007. - DOI - PMC - PubMed
    1. Molliex A, et al. Phase separation by low complexity domains promotes stress granule assembly and drives pathological fibrillization. Cell. 2015;163:123–133. doi: 10.1016/j.cell.2015.09.015. - DOI - PMC - PubMed
    1. Mann JR, et al. RNA binding antagonizes neurotoxic phase transitions of TDP-43. Neuron. 2019;102:321–338.e328. doi: 10.1016/j.neuron.2019.01.048. - DOI - PMC - PubMed