. 2024 Feb 19;15(1):1493.
doi: 10.1038/s41467-024-45665-6.

Single-cell and spatial multi-omics highlight effects of anti-integrin therapy across cellular compartments in ulcerative colitis

Affiliations

Single-cell and spatial multi-omics highlight effects of anti-integrin therapy across cellular compartments in ulcerative colitis

Elvira Mennillo et al. Nat Commun. .

Abstract

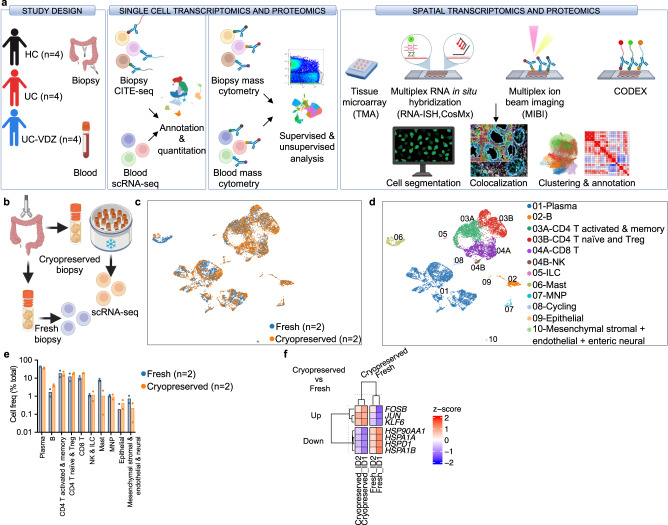
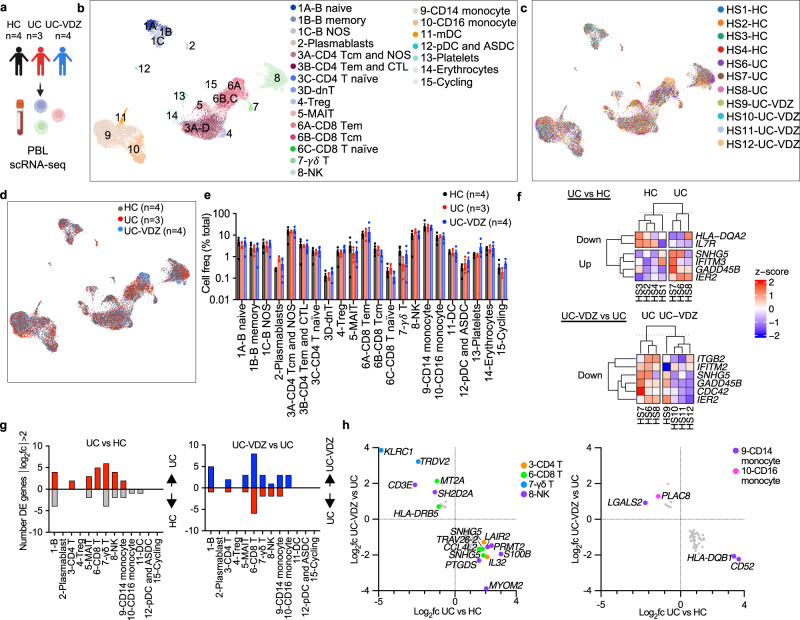
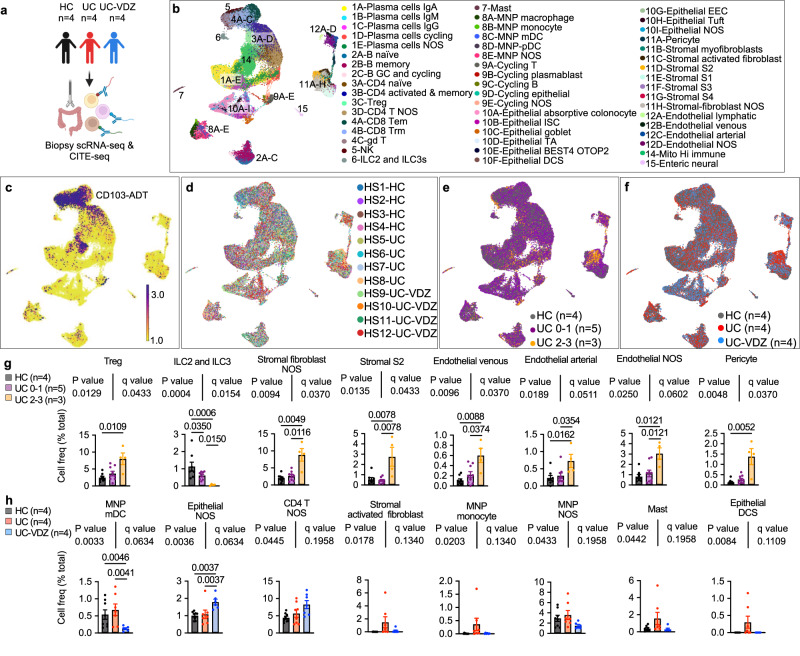
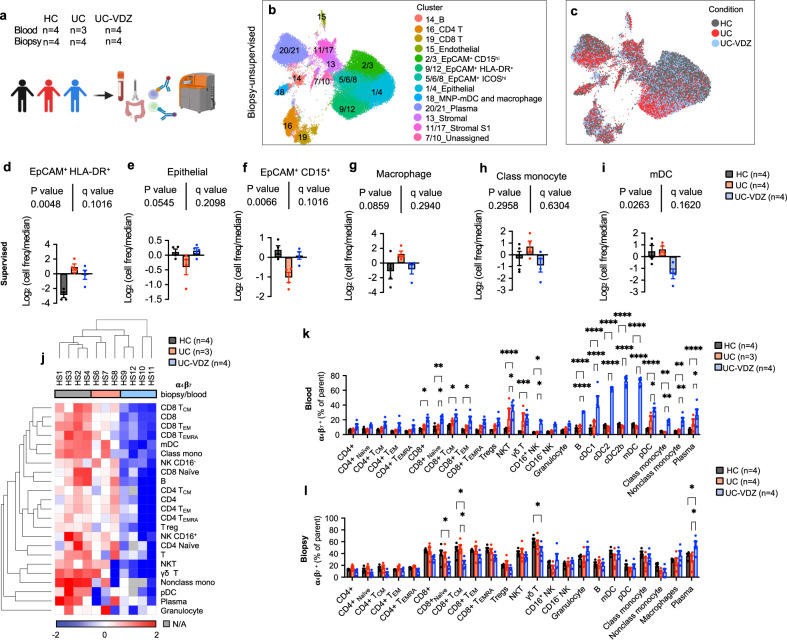
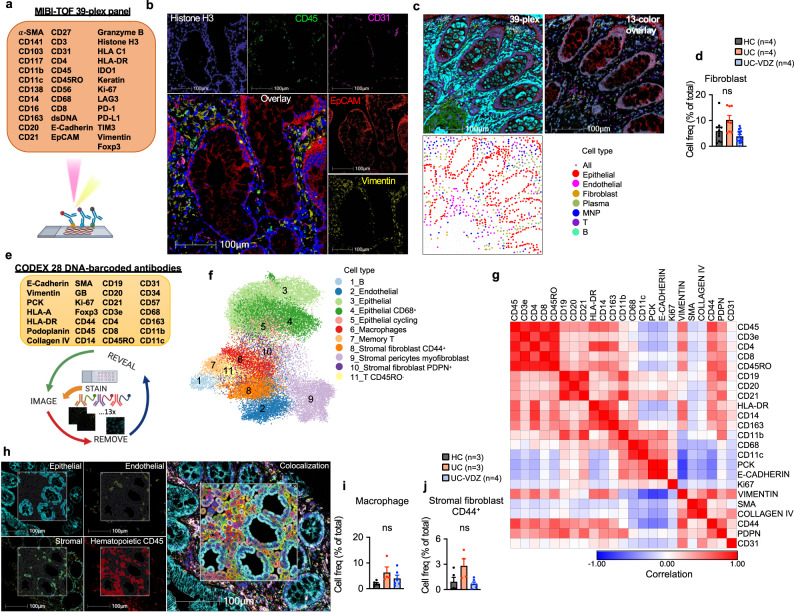
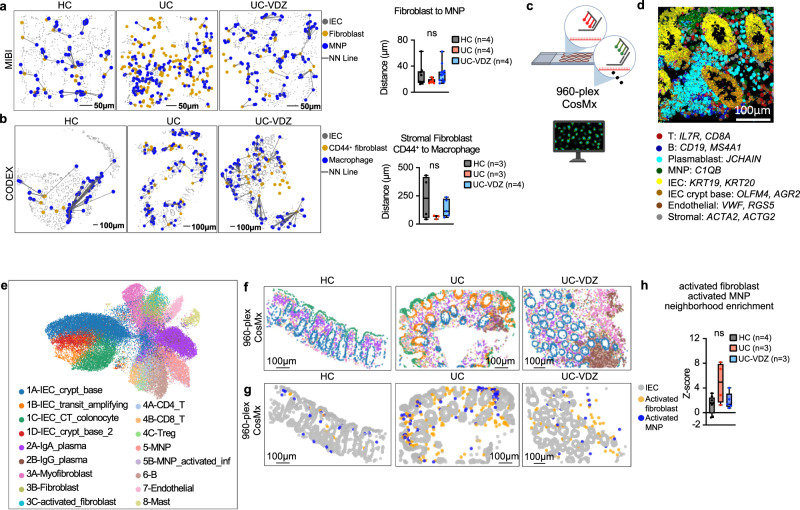
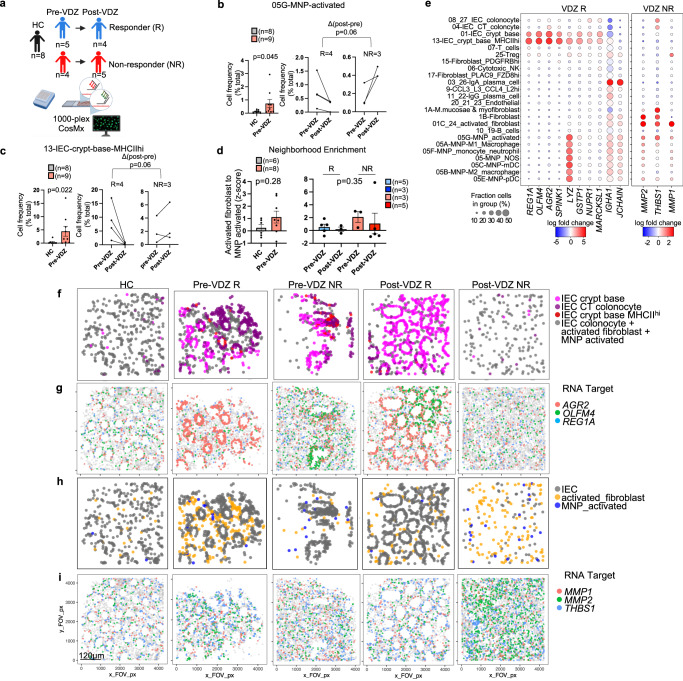
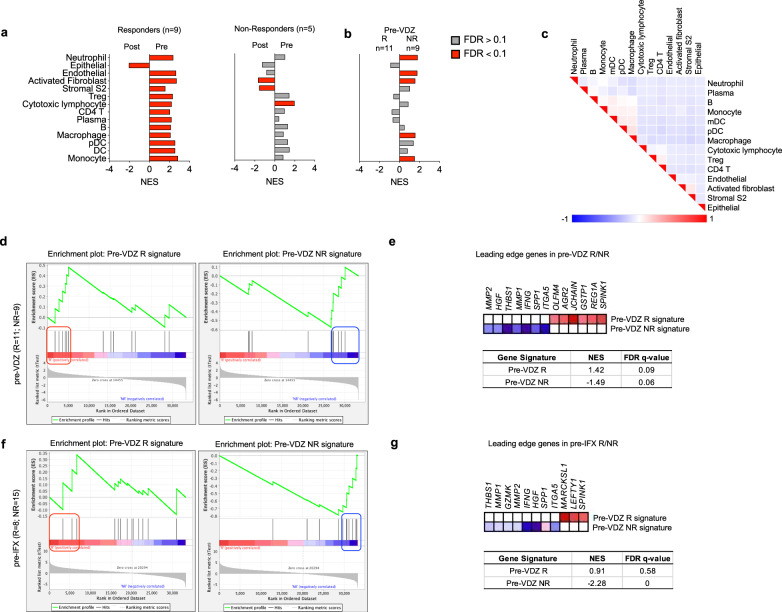
Ulcerative colitis (UC) is driven by immune and stromal subsets, culminating in epithelial injury. Vedolizumab (VDZ) is an anti-integrin antibody that is effective for treating UC. VDZ is known to inhibit lymphocyte trafficking to the intestine, but its broader effects on other cell subsets are less defined. To identify the inflammatory cells that contribute to colitis and are affected by VDZ, we perform single-cell transcriptomic and proteomic analyses of peripheral blood and colonic biopsies in healthy controls and patients with UC on VDZ or other therapies. Here we show that VDZ treatment is associated with alterations in circulating and tissue mononuclear phagocyte (MNP) subsets, along with modest shifts in lymphocytes. Spatial multi-omics of formalin-fixed biopsies demonstrates trends towards increased abundance and proximity of MNP and fibroblast subsets in active colitis. Spatial transcriptomics of archived specimens pre-treatment identifies epithelial-, MNP-, and fibroblast-enriched genes related to VDZ responsiveness, highlighting important roles for these subsets in UC.


Conflict of interest statement

S. Lewin has received research support from Takeda. N. El-Nachef is a consultant for Ferring, Federation Bio Grant, and receives funding from Finch Therapeutics, Seres, Freenome, and Assembly Biosciences. U. Mahadevan serves as a consultant for Abbvie, BMS, Boeringher Ingelheim, Gilead, Janssen, Lilly, Pfizer, Prometheus biosciences, Protagonist, Rani Therapeutics, Surrozen, and Takeda. D. Oh has received research support from Merck, PACT Pharma, the Parker Institute for Cancer Immunotherapy, Poseida Therapeutics, TCR2 Therapeutics, Roche/Genentech, and Nutcracker Therapeutics, and travel/accommodations from Roche/Genentech. The Combes lab has received research support from Eli Lilly and Genentech and A. Combes consults for Foundery Innovations. The Kattah lab receives research support from Eli Lilly. M. Kattah has consulted for Sonoma Biotherapeutics and Morphic Therapeutic. The remaining authors declare no competing interests.

Figures

Fig. 1
Fig. 1. Schematic of study design and fidelity of cryopreserved compared to fresh biopsy processing for scRNA-seq.
a Schematic of study design. Created with BioRender.com. b Schematic of Cryopreserved versus Fresh biopsy processing comparison. Created with BioRender.com. Representative UMAP visualization of 10,648 cells for two donors comparing (c) Cryopreserved versus Fresh biopsies and (d) coarse cell subset annotations. e Cell frequency as a percent of total for coarse cell subsets for two donors comparing Cryopreserved versus Fresh biopsies (mean; n=number of patients; each dot represents one patient sample; multiple Mann–Whitney tests with FDR correction; q < 0.1 threshold for discovery, only significant differences are indicated). f Heatmap of expression z-scores for differentially expressed (DE) genes with log2 fold-change (log2fc) > 0.4 or <−0.4 and Bonferroni p value < 0.1 comparing Cryopreserved (Up/Down) relative to Fresh biopsies for two study subjects ID1 and ID2 identified by MAST analysis. Only significant differences are shown. MNP mononuclear phagocyte: Treg-regulatory T cell, NK natural killer, ILC innate lymphoid cell.
Fig. 2
Fig. 2. scRNA-seq of peripheral blood leukocytes (PBLs) reveals correlation of VDZ with DE genes, but not circulating leukocyte subset frequency.
a Schematic of PBL scRNA-seq. Created with BioRender.com. UMAP visualization of pooled multiplex scRNA-seq for 20,130 PBLs from HC (n = 4), UC (n = 3), and UC-VDZ (n = 4) patients highlighting (b) fine cell annotations, (c) patient identity, and (d) disease and treatment status. e, Cell frequency as a percent of total cells per study subject stratified by disease and treatment status (mean ± SEM; n = number of patients; each dot represents one patient sample; multiple one-way ANOVA Kruskal-Wallis test with FDR correction; q < 0.1 threshold for discovery, only significant differences are indicated). f Heatmap of expression z-scores for scRNA-seq DE genes for all PBLs with log2fc > 1 or <-1 and Bonferroni-corrected p value < 0.1 comparing UC (Up/Down) relative to HC, and UC-VDZ (Up/Down) relative to UC identified by MAST analysis. g Number of scRNA-seq DE genes in the indicated PBL subsets with log2fc > 2 or <-2 in UC relative to HC and UC-VDZ relative to UC identified by MAST analysis. h scRNA-seq DE genes in the indicated PBL subsets with log2fc > 1.5 or <-1 in UC versus HC, and an inverse log2fc for UC-VDZ versus UC log2fc <−0.5 or >0.5, respectively identified by MAST analysis. For (f, h), ribosomal and mitochondrial genes are not displayed. NOS-not otherwise specified; mDC-myeloid dendritic cell; ASDC-AXL+ SIGLEC6+ myeloid DC pDC-plasmacytoid DC, MAIT mucosal-associated invariant T.
Fig. 3
Fig. 3. scRNA-seq and CITE-seq of mucosal biopsies highlighted multiple immune and non-immune subsets correlating with inflammatory severity, disease status, and VDZ treatment.
a, Schematic of scRNA-seq and CITE-seq of mucosal biopsies. Created with BioRender.com. b-f, UMAP visualization of 93,900 cells from HC (n = 4), UC (n = 4), and UC-VDZ (n = 4) patients highlighting (b) fine cell subset annotations (c) representative CITE-seq CD103 antibody-derived tag (ADT), (d) patient identity, (e) endoscopic severity scores, and (f) disease and treatment status. Cell frequency for the indicated fine cell subset, expressed as a percent of total cells per study subject, stratified by (g) endoscopic severity and (h) disease and treatment status (mean ± SEM; n = number of patients; each dot represents one biopsy location, up to two locations were biopsied per patient; multiple one-way ANOVA Kruskal-Wallis tests with FDR correction; q < 0.1 threshold for discovery; select subsets are shown with exact p-value and q-value; individual inter-column q-values are displayed only for cell subsets with overall q < 0.1, an additional nested one-way ANOVA test was performed treating biopsies as replicates, with unadjusted p < 0.05 as an additional threshold for discovery). NOS not otherwise specified.
Fig. 4
Fig. 4. Unsupervised and supervised CyTOF analysis identifies significant increase in circulating α4β7+ DCs in UC-VDZ patients.
a Schematic of CyTOF on blood and biopsy samples. Created with BioRender.com. UMAP visualization of the indicated samples (60,000 out of 684,249 live cell events displayed for biopsies) highlighting (b) annotated clusters, and (c) disease and treatment status. d–i Cell frequency of the indicated supervised subset analysis among conditions in biopsies expressed as log2 (cell freq/median) (mean ± SEM; n=number of patients; each dot represents one patient sample; multiple one-way ANOVA Kruskal-Wallis test with FDR correction; q < 0.1 threshold for discovery; individual inter-column q-values are displayed only for cell subsets with overall FDR corrected q < 0.1); the legend for (di) is shown in (i). j Heatmap of biopsy/blood ratio of α4β7+ cells for each cell subset by patient (hierarchically clustered by Euclidian distance, average linkage). k, l Percentage of α4β7 + cells in each defined cell subset per condition for blood and biopsy samples, respectively (mean ± SEM; n=number of patients; each dot represents one patient sample; two-way ANOVA comparing HC vs UC-VDZ and UC vs UC-VDZ with FDR correction; q < 0.1 threshold for discovery; *q < 0.05; **q < 0.01; ***q < 0.001; and ****q < 0.0001 (exact q-value are reported in Source Data); only significant differences are indicated). Class mono-classical monocyte; Nonclass mono-nonclassical monocyte; mDC-cDC1,cDC2,cDC2b; N/A-Not Applicable.
Fig. 5
Fig. 5. MIBI and CODEX spatial proteomics using FFPE tissue identifies distinct phenotypes in mucosal biopsies of UC-VDZ patients.
a Schematic of MIBI workflow and customized antibody panel. Created with BioRender.com. MIBI images representative of 32 FOVs for (b) nuclear DNA, indicated major cell lineage markers, and 5 color overlay, and (c) 39-plex overlay, selected channels, and related spatial scatter plots for coarse annotation of the indicated cell subsets. d Cell frequency as a percent of total cells detected by MIBI for the indicated cell subset. e Schematic of CODEX workflow and antibody panel. Created with BioRender.com. f UMAP visualization of 68,804 captured cells (50,000 cells displayed) highlighting annotated clusters. g Marker similarity matrix among 23 selected markers (Pearson correlation). h CODEX images representative of 15 cores, phenotype identification highlighting indicated markers and major phenotype colocalization. i, j Cell frequency as a percent of total cells detected by CODEX for the indicated cell subsets. For panels (d),(i),(j), mean ± SEM; n=number of patients; each dot represents one FOV for MIBI or one core for CODEX; multiple one-way ANOVA Kruskal-Wallis test with FDR correction; q < 0.1 threshold for discovery; ns not significant.
Fig. 6
Fig. 6. MNP and fibroblast subsets trend toward spatial proximity in UC patients compared to HC.
Spatial scatter plots of the indicated cell subsets and nearest-neighbor (NN) analysis for (a) MIBI (representative of 29 FOVs) and (b) CODEX (representative of 12 cores); n=number of patients; each dot represents one FOV for MIBI or one core for CODEX; one-way ANOVA Kruskal-Wallis tests with FDR correction; q < 0.1 threshold for discovery. c Schematic of 960-plex RNA-ISH of FFPE TMA. Created with BioRender.com. d CosMx images representative of 17 FOVs, cell segmentation and probe signal for the indicated cells and genes. e UMAP visualization of 960-plex CosMx for 48,783 cells from HC (n = 4), UC (n = 3), and UC-VDZ (n = 3) patients highlighting the indicated cell subsets. f, g Representative spatial scatter plots highlighting the indicated cell subsets (spatial scatter plots were representative of 17 FOVs); the legend for (f) is shown in (e). h Z-score of activated fibroblast and activated MNP neighborhood enrichment (n=number of patients; each dot represents one FOV; one-way ANOVA Kruskal-Wallis tests with FDR correction; q < 0.1 threshold for discovery; ns-not significant). For panels (a, b) and (h) box and whisker plots, the band indicates the median, the box indicates the first and third quartiles, and the whiskers indicate minimum and maximum, all points are shown.
Fig. 7
Fig. 7. CosMx spatial transcriptomics of archived FFPE specimens with single-cell resolution identified tissue signatures of VDZ response and non-response prior to therapy in activated MNP, fibroblast, and IEC crypt base subsets.
a Schematic of retrospective, longitudinal analysis of archived FFPE specimens using 1000-plex CosMx spatial transcriptomics of 126,368 cells from 73 FOVs; n of schematic applies to left panels in (bd). Created with BioRender.com. b, c Cell frequencies of indicated subsets comparing (left) HC and pre-treatment samples (pre-VDZ) (Mann–Whitney, two-tailed), as well as (middle, right) pre-VDZ and post-VDZ treatment for the indicated subsets for both responders (R) and non-responders (NR), only patients with matching biopsies pre- and post-VDZ are shown (Mann–Whitney, two-tailed of ∆ post VDZ - pre VDZ for R and NR). d Z-score of activated fibroblast and activated MNP neighborhood enrichment comparing (left) HC and pre-VDZ (Mann–Whitney, two-tailed) and (right) one-way ANOVA Kruskal-Wallis test with Dunn’s multiple comparison test. e Dot plot representation of a subset of genes from pseudobulk DE gene analysis for the indicated subsets. Representative spatial cell scatter plots highlighting the relevant cell subsets relatively increased in (f) VDZ R or (h) VDZ NR. Representative spatial transcript scatter plots highlighting a subset of genes relatively increased in (g) VDZ R and (i) VDZ NR. fi Spatial scatter plots were representative of 73 FOVs. For panels (bd), mean ± SEM; n=number of patients; each dot represents averaged FOV per patient. R-responder; NR non-responder.
Fig. 8
Fig. 8. Gene set enrichment analysis (GSEA) of an external, publicly-available, bulk transcriptomic dataset (GSE73661) using cell subset and spatial transcriptomic signatures associated with response and non-response to VDZ.
Normalized Enrichment Scores (NES) in bulk tissue transcriptomic data comparing (a) pre- and post-treatment samples for VDZ responders (R) and non-responders (NR), (b) pre-VDZ R vs NR (red bars FDR < 0.1, gray bars FDR > 0.1). c Leading edge analysis of significantly enriched gene sets. dg, GSEA of VDZ response and non-response spatial signatures in external cohort of patients (d) pre-VDZ and (f) pre-IFX. Subset of genes comprising the leading edge of the NES and FDR q-values in (e) pre-VDZ and (g) pre-IFX patients, respectively. IFX infliximab.

Update of

References

    1. Arijs I, et al. Effect of vedolizumab (anti-α4β7-integrin) therapy on histological healing and mucosal gene expression in patients with UC. Gut. 2018;67:43–52. doi: 10.1136/gutjnl-2016-312293. - DOI - PubMed
    1. Verstockt B, et al. Expression levels of 4 genes in colon tissue might be used to predict which patients will enter endoscopic remission after vedolizumab therapy for inflammatory bowel diseases. Clin. Gastroenterol. Hepatol. 2020;18:1142–1151.e10. doi: 10.1016/j.cgh.2019.08.030. - DOI - PMC - PubMed
    1. Feagan BG, et al. Vedolizumab as induction and maintenance therapy for ulcerative colitis. N. Engl. J. Med. 2013;369:699–710. doi: 10.1056/NEJMoa1215734. - DOI - PubMed
    1. Luzentales-Simpson M, Pang YCF, Zhang A, Sousa JA, Sly LM. Vedolizumab: Potential mechanisms of action for reducing pathological inflammation in inflammatory bowel diseases. Front. Cell Dev. Biol. 2021;9:612830. doi: 10.3389/fcell.2021.612830. - DOI - PMC - PubMed
    1. Soler D, et al. The binding specificity and selective antagonism of vedolizumab, an Anti-α 4 β 7 integrin therapeutic antibody in development for inflammatory bowel. Dis. J. Pharmacol. Exp. Ther. 2009;330:864–875. doi: 10.1124/jpet.109.153973. - DOI - PubMed