. 2024 Feb 19;15(1):1514.
doi: 10.1038/s41467-024-45922-8.

A neurophysiological basis for aperiodic EEG and the background spectral trend

Affiliations

A neurophysiological basis for aperiodic EEG and the background spectral trend

Niklas Brake et al. Nat Commun. .

Abstract

Electroencephalograms (EEGs) display a mixture of rhythmic and broadband fluctuations, the latter manifesting as an apparent 1/f spectral trend. While network oscillations are known to generate rhythmic EEG, the neural basis of broadband EEG remains unexplained. Here, we use biophysical modelling to show that aperiodic neural activity can generate detectable scalp potentials and shape broadband EEG features, but that these aperiodic signals do not significantly perturb brain rhythm quantification. Further model analysis demonstrated that rhythmic EEG signals are profoundly corrupted by shifts in synapse properties. To examine this scenario, we recorded EEGs of human subjects being administered propofol, a general anesthetic and GABA receptor agonist. Drug administration caused broadband EEG changes that quantitatively matched propofol's known effects on GABA receptors. We used our model to correct for these confounding broadband changes, which revealed that delta power, uniquely, increased within seconds of individuals losing consciousness. Altogether, this work details how EEG signals are shaped by neurophysiological factors other than brain rhythms and elucidates how these signals can undermine traditional EEG interpretation.


Conflict of interest statement

The authors declare no competing interests.

Figures

Fig. 1
Fig. 1. EEG cannot reflect asynchronous neural activity.
a Example morphology of a layer 2/3 pyramidal neuron. Inputs at AMPAR (red) and GABAR (blue) synapses were simulated with Poissonian spike trains, shown in raster plot. Only 1000 synapses shown for clarity. Neuron morphology adapted from Budd, J. M. L. et al. Neocortical axon arbors trade-off material and conduction delay conservation. PLoS Comput. Biol. 6, e1000711 (2010). b The x, y, and z components of the single-neuron dipole vector, calculated from (a). c Left: single-neuron EEG signals were simulated at the marked electrode location, with the neuron located at various source locations, e.g., location A and B. Right: the location-averaged EEG spectrum (black) computed by averaging over the source locations shown in black dots on the brain template. Loc.=location; Avg.=average. d Location-averaged spectrum generated from 1000 simulations of 11 representative neuron morphologies (Table S1). The spectrum was fit by Eq. 1 and the two Lorentzian components are shown in dashed red lines. e The unitary spectrum was calculated while varying the deactivation kinetics of GABARs (τI) and the parameter τ1 was estimated. Red line has a slope of 1. f Same as e, but showing τ2 as a function of the deactivation kinetics of AMPARs (τE). g Sampling distributions for model parameters. λE, τE, and gE represent the average input rate, the deactivation time constant, and maximal conductance for AMPAR synapses. λI, τI, and gI represent the same parameters for GABAR synapses. EL and gL represent the reversal potential and conductance of the passive membrane leak current. h Distribution of single-neuron EEG power (location-averaged as in c) based on 20,000 simulations with parameters sampled from the distributions shown in (g) and morphologies sampled as described in Table S1. i Black: Median EEG spectrum across 14 subjects, with error bands indicating minimum and maximum spectral density. Grey: the predicted EEG spectrum of 16 billion uncorrelated neurons receiving Poissonian synaptic input (grey), with parameter values sampled from the distributions in (g). Error bands reflect 5–95% quantile range.
Fig. 2
Fig. 2. Detectable EEG signals require only weak, locally synchronized dipoles.
a Schematic displaying the coupling kernel used to correlate single-neuron dipoles. The kernel is a Gaussian function with peak of ρmax and variance σ2. b Median EEG spectrum across 14 human subjects (grey; same error bands as Fig. 1i), and simulated unitary spectrum (black; same as Fig. 1d) scaled by arbitrary amounts to determine a lower and upper bound of the spectral trend amplitude. c Heatmap of the total simulated EEG power produced by 16 billion neurons with dipoles coupled with the kernel in (a), and parameterized with various values of ρmax and σ2. The black lines are level curves representing the lower and upper bounds for the spectral trend magnitude obtained in (b).
Fig. 3
Fig. 3. A minimal model of dipole correlation captures broadband EEG amplitude but not low frequency power.
a A single synapse was activated at the location specified by the blue arrow, generating a response in the single-neuron dipole, Q. The dipole vector at the peak of the response is oriented towards the synapse location, defined in spherical coordinates with the soma as the origin. Neuron morphology adapted from Budd, J. M. L. et al. Neocortical axon arbors trade-off material and conduction delay conservation. PLoS Comput. Biol. 6, e1000711 (2010). b The simulation in a was repeated 600 times with different neuron morphologies and synapse locations. Plotting the dipole orientation at the peak of the response against the location of the stimulated synapse shows a strong, linear relationship. Some points not plotted for clarity. Dot size is proportional to peak dipole amplitude. rel.=relative. c Schematic showing the minimal model for dipole correlation. Synapses on each postsynaptic neuron in the dyad were projected onto a sphere. A correlation matrix among all synapses was then defined such that synapses separated by an angle θij on the sphere were correlated by Rmaxexp(θij). The left neuron’s morphology is adapted from Budd, J. M. L. et al. Neocortical axon arbors trade-off material and conduction delay conservation. PLoS Comput. Biol. 6, e1000711 (2010). The illustration of the right neuron is adapted, with permission from SNCSC, from Mainen, Z. F. & Sejnowski, T. J. Influence of dendritic structure on firing pattern in model neocortical neurons. Nature 382, 363–366 (1996), Springer Nature. d Example of single-neuron EEG signals of the two neurons shown in (c). e Correlation between two single-neuron dipoles as a function of Rmax. Vertical lines represent 95% confidence intervals of the mean (n = 11 different morphology pairs). When synapse locations are shuffled, dipoles are no longer correlated (grey). f The unitary spectrum of neurons receiving input calculated with the minimal model (black), scaled to compare the shape of the spectrum with median EEG spectrum of 14 subjects (grey line; same as Fig. 1i).
Fig. 4
Fig. 4. Subcritical network dynamics can explain the amplitude and low frequency power of broadband EEG.
a Illustration of the algorithm for optimizing dipole coherence. Nrn. = neuron. The left neuron morphology is adapted from Budd, J. M. L. et al. Neocortical axon arbors trade-off material and conduction delay conservation. PLoS Comput. Biol. 6, e1000711 (2010). The illustration of the right neuron is adapted, with permission from SNCSC, from Mainen, Z. F. & Sejnowski, T. J. Influence of dendritic structure on firing pattern in model neocortical neurons. Nature 382, 363–366 (1996), Springer Nature. b Illustration of the rules used to produce spatiotemporal synchrony in a presynaptic network. Rule #1: network topology is enforced by making the probability of pairwise connections, P(Cij), decrease exponentially with distance, dij. Rule #2: the probability of a neuron firing, Pt+1, depends on a baseline firing rate of λ=λ0(1m) plus the average activity of its neighbours scaled by m. λ0 is a predefined average firing rate; m is the branching number of the network. corr.=correlation. c Examples of single-neuron EEG signals of two neurons receiving input from the network model with a branching number m=0.98, when synapse locations have been optimized as described in (a). Bottom: a raster plot of synaptic input for the two neurons. d Correlation between two single-neuron dipoles as a function of the branching number, m, of the presynaptic network. Dipole correlation increases with m (coloured dots), but not when synapse locations are shuffled (grey). Median (dots) and 5– 95% quantile range (vertical lines) across n = 10,000 simulated dyads with randomly sampled morphologies (Table S1) and randomly sampled biophysical parameter values (as in Fig. 1g). e Dipole correlation can be tuned by placing synapses suboptimally (see Methods). Cubic interpolation between simulated optimality indices is shown with the solid line. Median (dots) and 5–95% quantile range (vertical lines) across n = 500 simulations. f Unitary spectra calculated for different branching numbers. Error bands reflect 95% confidence interval of the mean. g The unitary spectra from (f) scaled based on a synapse optimality index of 0.25 (colours same as in f). The value of ρmax was determined from e and the final scaling factor was determined as in Fig. 2. Grey: median EEG spectrum of 14 subjects (same as Fig. 1i).
Fig. 5
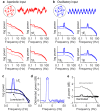
Fig. 5. Measuring oscillatory peak power relative to spectral trend may produce misleading results.
a Illustration of mixed input model. Half of the neuron’s synapses received oscillatory rhythmic input (blue) and the other half received input from a subcritical network (red). The strengths of oscillatory and subcritical dynamics were adjusted by tuning two parameters, αR and αA, respectively, which determined the degree to which synaptic inputs differed from homogenous Poisson processes. See Methods for details. Neuron illustration created with BioRender.com. b Unitary spectrum for neurons receiving Poisson input (grey), compared with the unitary spectra for neurons receiving input entirely from the oscillatory population (left; black), entirely from the subcritical population (middle; black), or mixed input as in (a) (right; black): αR=αA=0.1. c Oscillatory input was strengthened by increasing αR from 0.1 (black) to 0.5 (blue), with αA fixed at 0.1. The spectra were fit using a FOOOF-like algorithm, except that here the aperiodic component was modelled with Eq. 1 (solid grey line). d Aperiodic input was strengthened by increasing αA from 0.1 (black) to 0.5 (red), with αR fixed at 0.1. e Both oscillatory and aperiodic inputs were strengthened by increasing both αR and αA from 0.1 (black) to 0.5 (magenta). f Detrended spectrum of neurons receiving mixed input before (black) and after (blue) oscillation strength increased. The unitary spectra in (c) were divided by the solid grey line. g Detrended power before (black) and after (red) aperiodic strength increases. Notice that the detrended power at 2 Hz decreases, despite the strength of oscillations remaining the same. h Detrended power before (black) and after (magenta) both oscillation and aperiodic strength increases. Notice that the detrended power at 2 Hz does not increase as much as in (f), despite the oscillation increasing in strength by the same amount.
Fig. 6
Fig. 6. Sensitivity of spectral slope to biophysical parameters governing postsynaptic responses.
a Sampling distributions for model parameters, the same as the ones used in Fig. 1g. b Example single-neuron EEG spectrum, fitted with the equation 10α/fβ between 1 and 40 Hz. c Sensitivity of the spectral slope, β, to model parameters, with first and second order interactions, calculated from 20,000 simulated spectra. d Simulated spectra were averaged depending on the ratio between λE and λI. Lower E:I ratios correspond to more inhibition. e The spectral slope is plotted against the E:I ratio for each simulation. Left: simulation where the leak conductance was low (gL<0.1 mS cm2; n = 7366 simulations). Right: simulation where the leak conductance was high (gL>1 mS cm−2; n = 5184 simulations).
Fig. 7
Fig. 7. Changes in postsynaptic mechanisms confound brain rhythm quantification.
a Unitary spectra for neurons receiving entirely subcritical input (m=0.98,αA=0.1; see Fig. 5a), before and after four parameter changes: subplot corresponding to (τI) shows the unitary spectrum when τI was increased from 10 ms (pink) to 30 ms (red); (EL) shows unitary spectrum when EL was increased from −60 mV (pink) to −45 mV (red); (gE) shows unitary spectrum when gE was increased from 0.7 nS (pink) to 1.4 nS (red); and (gI) shows unitary spectrum when gI was increased from 0.7 nS (pink) to 1.4 nS (red). Note the changes in the unitary spectra despite there being no changes in synaptic input dynamics. b Same as in (a), but for neurons receiving entirely oscillatory input (αR=0.1; see Fig. 5a). In Fig. S3, we show examples of different types of rhythmic input. c Example of fitted spectral trend. Here, the unitary spectrum of sinusoidal input is shown before and after increasing EL. The spectra were fit using a FOOOF-like algorithm, except that here the trend was modelled using Eq. 1 (black lines). See other examples in Fig. S4. d Spectra from (c), detrended by dividing the spectra by their respective Lorentzian fits. See other examples in Fig. S4. e Change in EEG spectral density caused by increasing EL. In grey is the raw change in the unitary spectra, while in black is the difference between the detrended spectra. Detrending the spectra with Eq. 1 has corrected for the effects of increasing EL and correctly indicates that there are no changes in neural dynamics.
Fig. 8
Fig. 8. Model predicts and quantifies effects of propofol administration on EEG spectra.
a Representative EEG signal, Cz recording site, of a subject receiving an infusion of propofol until loss of consciousness (LOC). The estimated effect-site concentration of propofol is plotted below. b Mean LOC-aligned spectrogram of 14 subjects. c Average power spectrum at baseline (black), averaged between 0 and 10 s prior to propofol infusion, and after propofol infusion (red), averaged between 0 and 10 s prior to LOC. Shading reflects 95% confidence intervals of the mean (n = 14 subjects). d Representative EEG spectrum at baseline, 0–10 s prior to propofol infusion (left, black) and 0-10 s prior to LOC (right, black). Spectra have been fitted with Eq. 6 (see Methods), using a FOOOF-like fitting algorithm that accounts for several Gaussian peaks in the spectra (solid blue). Fitted trend is shown with dashed line. e The parameter τ1, estimated from fits to spectra computed in 2-s windows, plotted with respect to rescaled time. Shading reflects 95% confidence intervals of the mean (n = 14 subjects). f Left: fold change in the estimated value of τ1 plotted against the estimated effect-site concentration of propofol. Black line marks the mean for each concentration of propofol. Right: The estimated dose-response plot from the left panel (darker colours reflect higher density of points) is superimposed with in vitro data taken from four studies: Study #1, Study #2, Study #3, and Study #4. The data values taken from these studies are presented in Table S2. The dash black line is a fitted Hill function to the data from the four studies: EC50 = 3.7 μM and Hill coefficient (n) =1.6.
Fig. 9
Fig. 9. Correcting for synaptic timescales reveals a unique signature of losing consciousness.
a Left: representative EEG power spectrum following LOC (black) of a single subject, superimposed on the power spectrum at baseline (blue). Right: power spectrum following LOC (black) normalized to baseline. b Mean baseline normalized spectrogram (n = 14 subjects). c Average baseline-normalized power 0–10 s prior to LOC (shading: 95% confidence interval of mean). Power was significantly elevated within the delta (p = 0.001, right-tailed sign test; n = 14 subjects), alpha (p ≈ 10−4), and beta (p = 0.007) frequency bands. d Changes in alpha, beta, and delta power, aligned to both moment of propofol infusion and LOC, averaged across subjects (shading: 95% confidence interval of mean). Bars above graph indicate 0.05-long segments of rescaled time where there is a statistically significant increase (p < 0.05, right-tailed sign test) in the corresponding frequency band power. Fig. S5d shows results without rescaled time. e Left: EEG spectrum following LOC, same as a, superimposed with fitted inhibitory timescale (Eq. 6). Fitted Gaussian peaks not shown. Right: detrended power, defined as power relative to fitted inhibitory timescale, in decibels. f Mean detrended spectrogram, normalized to baseline (n = 14 subjects). g Detrended power 0–10 s prior to LOC, normalized to baseline (shading: 95% confidence interval of mean). Power was significantly elevated within the alpha (p = 0.006) and beta, (p = 0.001), but not delta (p = 0.40) frequency bands. Significance testing same as (c). h Same as in (d), but for detrended power, normalized to baseline.

References

    1. Berger H. Über das elektrenkephalogramm des menschen. Arch. Psychiatr. Nervenkr. 1929;87:527–570. doi: 10.1007/BF01797193. - DOI
    1. Steriade M. Cellular substrates of brain rhythms. Electroencephalogr. Basic Princ. Clin. Appl. Relat. fields. 2005;5:31–83.
    1. Nunez, P. L. & Srinivasan, R. Electric Fields of the Brain (Oxford Univ. Press, Oxford, 2006). 10.1093/acprof:oso/9780195050387.001.0001.
    1. Buzsáki G, Anastassiou CA, Koch C. The origin of extracellular fields and currents - EEG, ECoG, LFP and spikes. Nat. Rev. Neurosci. 2012;13:407–420. doi: 10.1038/nrn3241. - DOI - PMC - PubMed
    1. Pritchard WS. The brain in fractal time: 1/f-like power spectrum scaling of the human electroencephalogram. Int. J. Neurosci. 1992;66:119–129. doi: 10.3109/00207459208999796. - DOI - PubMed