. 2024 Feb 19;22(1):137.
doi: 10.1186/s12964-023-01436-2.

A resource database for protein kinase substrate sequence-preference motifs based on large-scale mass spectrometry data

Affiliations

A resource database for protein kinase substrate sequence-preference motifs based on large-scale mass spectrometry data

Brian G Poll et al. Cell Commun Signal. .

Abstract

Background: Protein phosphorylation is one of the most prevalent posttranslational modifications involved in molecular control of cellular processes, and is mediated by over 520 protein kinases in humans and other mammals. Identification of the protein kinases responsible for phosphorylation events is key to understanding signaling pathways. Unbiased phosphoproteomics experiments have generated a wealth of data that can be used to identify protein kinase targets and their preferred substrate sequences.

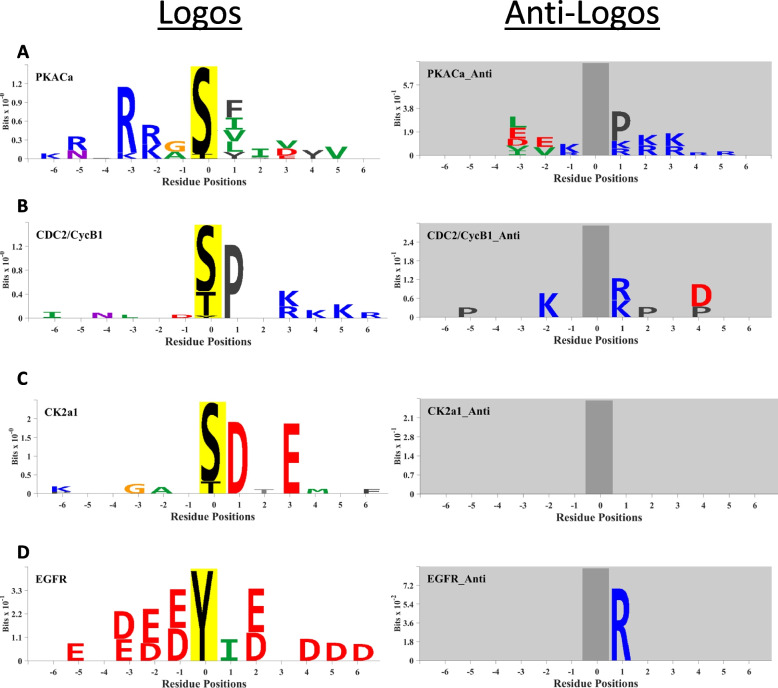
Methods: This study utilized prior data from mass spectrometry-based studies identifying sites of protein phosphorylation after in vitro incubation of protein mixtures with recombinant protein kinases. PTM-Logo software was used with these data to generate position-dependent Shannon information matrices and sequence motif 'logos'. Webpages were constructed for facile access to logos for each kinase and a new stand-alone application was written in Python that uses the position-dependent Shannon information matrices to identify kinases most likely to phosphorylate a particular phosphorylation site.

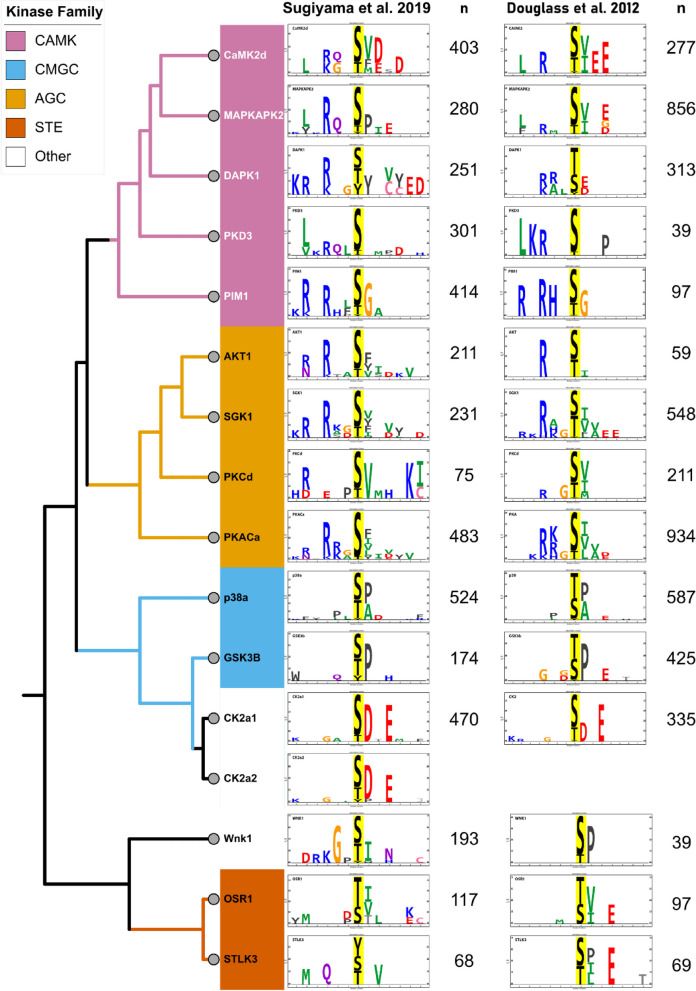
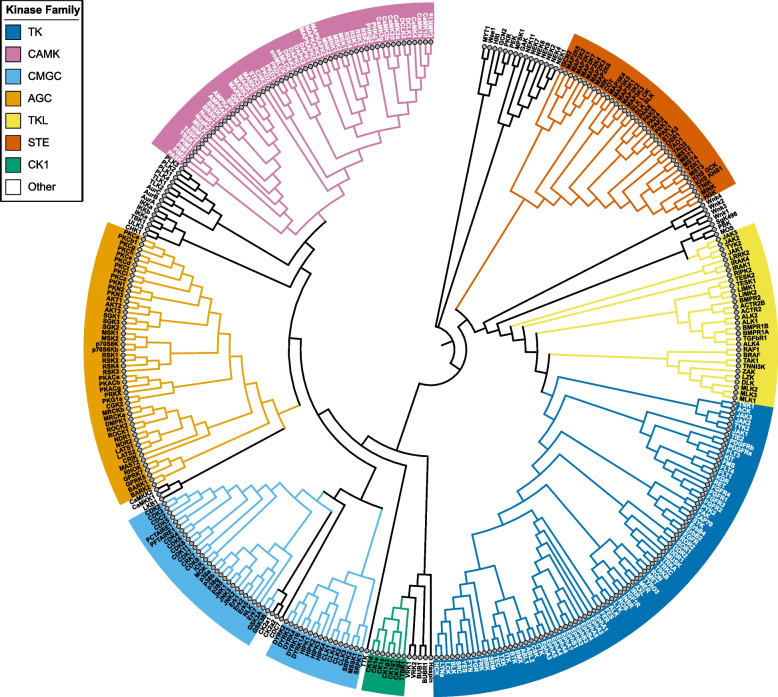
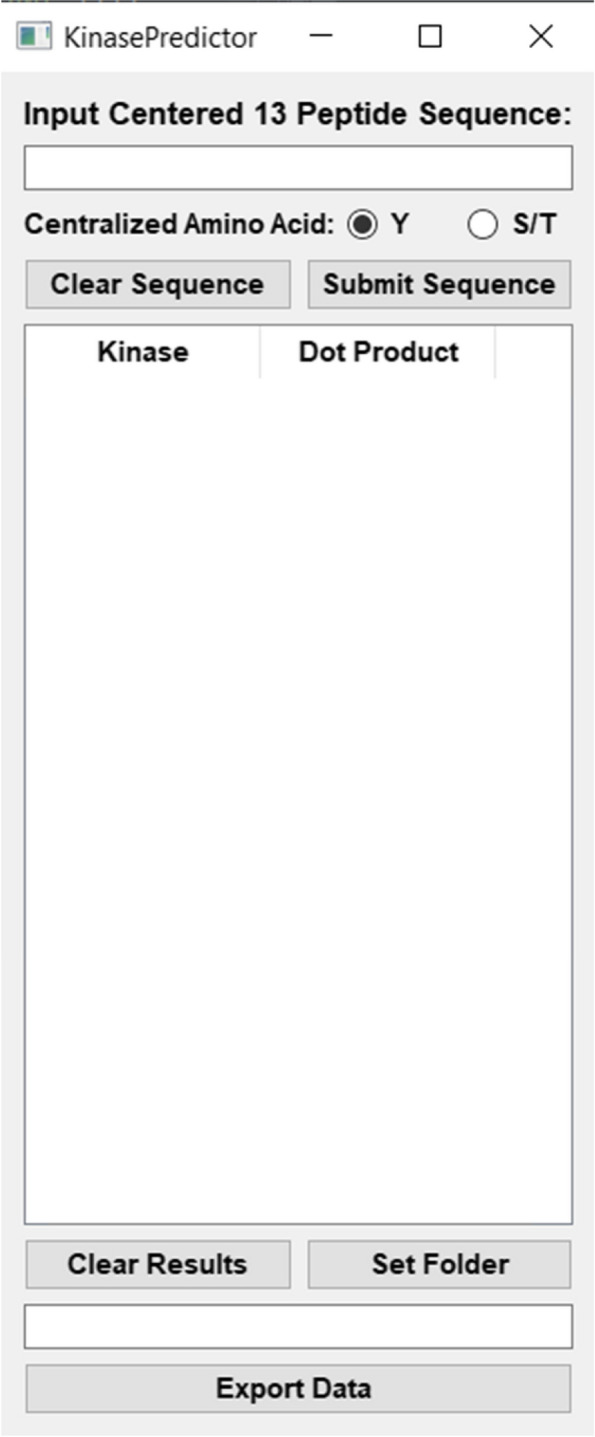
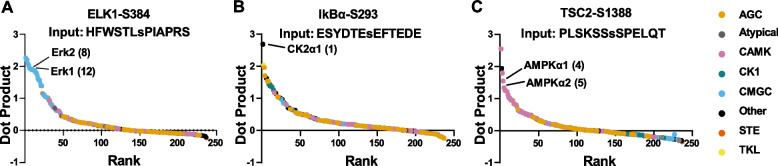
Results: A database of kinase substrate target preference logos allows browsing, searching, or downloading target motif data for each protein kinase ( https://esbl.nhlbi.nih.gov/Databases/Kinase_Logos/ ). These logos were combined with phylogenetic analysis of protein kinase catalytic sequences to reveal substrate preference patterns specific to particular groups of kinases ( https://esbl.nhlbi.nih.gov/Databases/Kinase_Logos/KinaseTree.html ). A stand-alone program, KinasePredictor, is provided ( https://esbl.nhlbi.nih.gov/Databases/Kinase_Logos/KinasePredictor.html ). It takes as input, amino-acid sequences surrounding a given phosphorylation site and generates a ranked list of protein kinases most likely to phosphorylate that site.

Conclusions: This study provides three new resources for protein kinase characterization. It provides a tool for prediction of kinase-substrate interactions, which in combination with other types of data (co-localization, etc.), can predict which kinases are likely responsible for a given phosphorylation event in a given tissue. Video Abstract.

Keywords: Kinase prediction; Phosphorylation; Protein kinases.


Conflict of interest statement

The authors declare no competing interests.

Figures

Fig. 1
Fig. 1
Examples of substrate preference logos (left) and anti-logos (right) for selected protein kinases. A PKACα (protein kinase cAMP-activated catalytic subunit alpha; gene symbol: Prkaca), B CDC2 (cyclin dependent kinase 1; gene symbol: Cdk1) coupled with Cyclin B1, C CK2a1 (casein kinase 2 alpha 1; gene symbol: Csnk2a1), and D EGFR (epidermal growth factor receptor, gene symbol: Egfr). Logos were generated in PTM-Logo using a Chi squared filtering α of 0.0001. Source: https://esbl.nhlbi.nih.gov/Databases/Kinase_Logos/). The colors of individual amino acids indicate different side chain properties: blue, basic; red, acidic; green, hydrophobic; black, aromatic; magenta, polar/uncharged; orange, no side chain
Fig. 2
Fig. 2
Comparison of substrate logos of representative kinases from two in vitro kinase profiling studies using MS-based methods, Sugiyama et al. 2019 [13] (left), and Douglass et al. 2012 [12] (right). Kinases are representatives from the indicated protein kinase families. Logos were generated in PTM-Logo (Chi squared filtering α = 0.0001) from “n” number of input peptide sequences for each kinase. Dendrograms were made using Interactive Tree of Life (iToL). The colors of individual amino acids indicate different side chain properties: blue, basic; red, acidic; green, hydrophobic; black, aromatic; magenta, polar/uncharged; orange, no side chain
Fig. 3
Fig. 3
Comparison of substrate logos of representative kinases from two studies using different profiling methods: in vitro phosphorylation/phosphoproteomics technique (“Mass Spectrometry”) (left) and combinatorial peptide library screening method (“Peptide Array”) in which a library of target peptides is phosphorylated in vitro (right) [16]. Representative targets were chosen from different kinase families. In the logo images in the “Mass Spectrometry” column, the colors of individual amino acids indicate different side chain properties: blue, basic; red, acidic; green, hydrophobic; black, aromatic; magenta, polar/uncharged; orange, no side chain. The logo images in the “Peptide Array” column are from supplementary files from Johnson et al. [16] and use a similar format to what was used in the “Mass Spectrometry” column except that the anti-logos are given as downwardly directed stacks. These logos were copied directly from reference 14. (Reference 14 was licensed under a Creative Commons Attribution 4.0 International License, which permits use, sharing, adaptation, distribution and reproduction in any medium or format, as if appropriate credit is given to the original author(s) and the source. Creative Commons License: https://creativecommons.org/licenses/by/4.0/)
Fig. 4
Fig. 4
Phylogenetic tree of all protein kinases included in this database. The web version of this phylogenetic tree (https://esbl.nhlbi.nih.gov/Databases/Kinase_Logos/KinaseTree.html) has their respective kinase logos viewable as popups when the user hovers over each node. Kinase groups are AGC, PKA/PKG/PKC family; CAMK, calmodulin-kinase family; CK1, casein kinase family; CMGC, cyclin-dependent kinase/mitogen-activated kinase/glycogen-synthase kinase/CDK-like kinase family; STE, sterile family kinases; TKL, tyrosine-like kinases, and atypical kinases
Fig. 5
Fig. 5
The KinasePredictor interface for inputting user phosphorylation sequences. Users input a centralized 13 amino-acid sequence in the top entry box, and the resulting ranked list of kinases are shown below with their respective dot-product scores. These ranked kinase results can then be saved and exported for further analysis
Fig. 6
Fig. 6
KinasePredictor validation using well-established phosphorylation sites. Three sequences with experimentally verified phosphorylation sites from PhosphoSitePlus were input into KinasePredictor, ELK1 at S384, a known target of Erk1/2 (A, left), IκB1α at S293, a known target of CK2α1 (B, mid), and TSC2 at S1388, a known target of AMPKα1/2 (C, right). For each sequence, a dot product was calculated for each kinase in the dataset, ranked, and then graphed with their dot product value. The lowest rank and highest dot product kinases represent those predicted most likely to phosphorylate the target site given the input sequence. The kinases known to target the site are indicated on each graph and their rank shown in parentheses. Kinases are color-coded by their family according to the legend on the right. Kinase groups are AGC, PKA/PKG/PKC family; CAMK, calmodulin-kinase family; CK1, casein kinase family; CMGC, cyclin-dependent kinase/mitogen-activated kinase/glycogen-synthase kinase/CDK-like kinase family; STE, sterile family kinases; TK, tyrosine kinases; TKL, tyrosine-like kinases

Similar articles

Cited by

References

    1. Manning G, Whyte DB, Martinez R, et al. The protein kinase complement of the human genome. Science (New York, NY) 2002;298:1912–1934. doi: 10.1126/science.1075762. - DOI - PubMed
    1. Cohen P. The origins of protein phosphorylation. Nat Cell Biol. 2002;4:E127–E130. doi: 10.1038/ncb0502-e127. - DOI - PubMed
    1. Sharma K, D’Souza Rochelle CJ, Tyanova S, et al. Ultradeep human Phosphoproteome reveals a distinct regulatory nature of Tyr and Ser/Thr-based signaling. Cell Rep. 2014;8:1583–1594. doi: 10.1016/j.celrep.2014.07.036. - DOI - PubMed
    1. Sopko R, Andrews BJ. Linking the kinome and phosphorylome--a comprehensive review of approaches to find kinase targets. Mol BioSyst. 2008;4:920–933. doi: 10.1039/b801724g. - DOI - PubMed
    1. Gnad F, Gunawardena J, Mann M. PHOSIDA 2011: the posttranslational modification database. Nucleic Acids Res. 2011;39:D253–D260. doi: 10.1093/nar/gkq1159. - DOI - PMC - PubMed

Publication types

LinkOut - more resources