. 2024 Feb 19;26(1):29.
doi: 10.1186/s13058-024-01788-8.

Metabolic adaptation towards glycolysis supports resistance to neoadjuvant chemotherapy in early triple negative breast cancers

Affiliations

Metabolic adaptation towards glycolysis supports resistance to neoadjuvant chemotherapy in early triple negative breast cancers

Françoise Derouane et al. Breast Cancer Res. .

Abstract

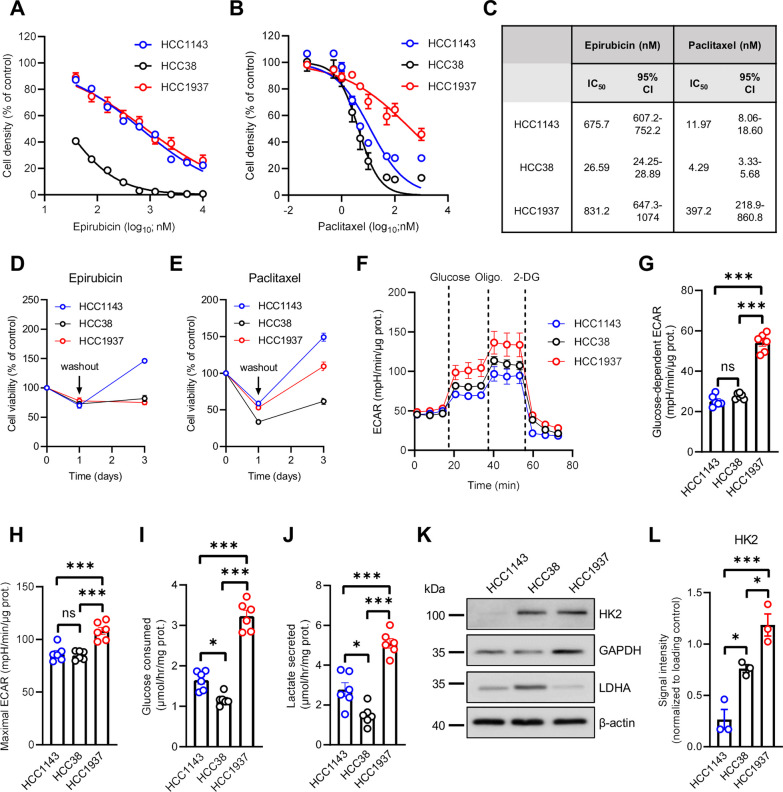
Background: Neoadjuvant chemotherapy (NAC) is the standard of care for patients with early-stage triple negative breast cancers (TNBC). However, more than half of TNBC patients do not achieve a pathological complete response (pCR) after NAC, and residual cancer burden (RCB) is associated with dismal long-term prognosis. Understanding the mechanisms underlying differential treatment outcomes is therefore critical to limit RCB and improve NAC efficiency.

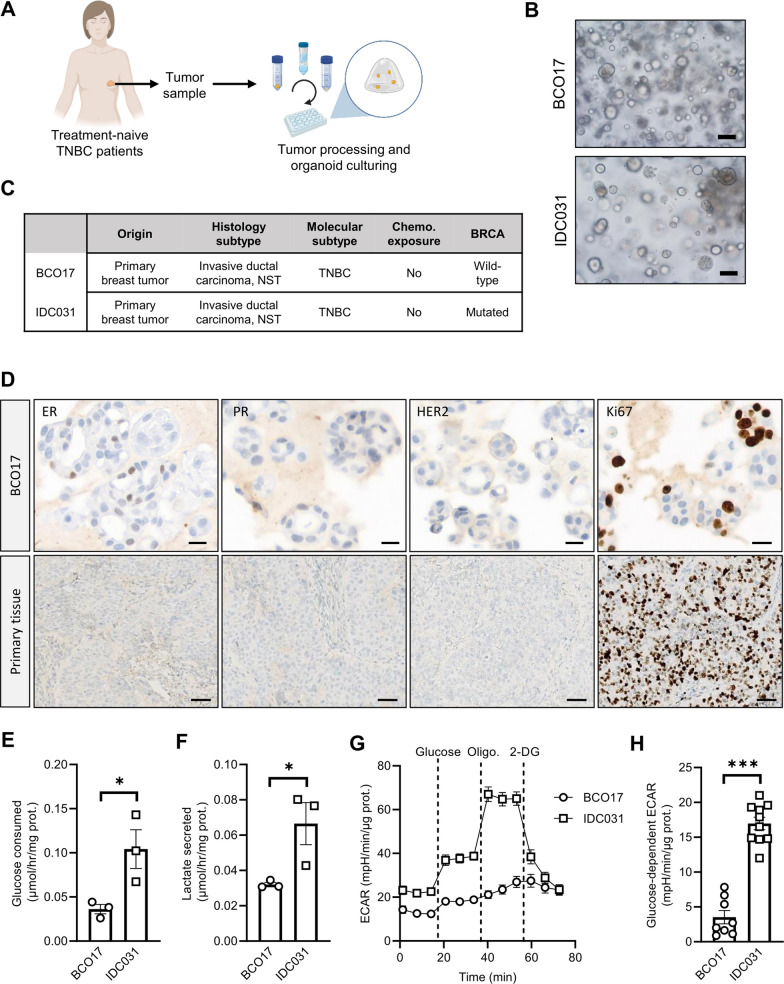
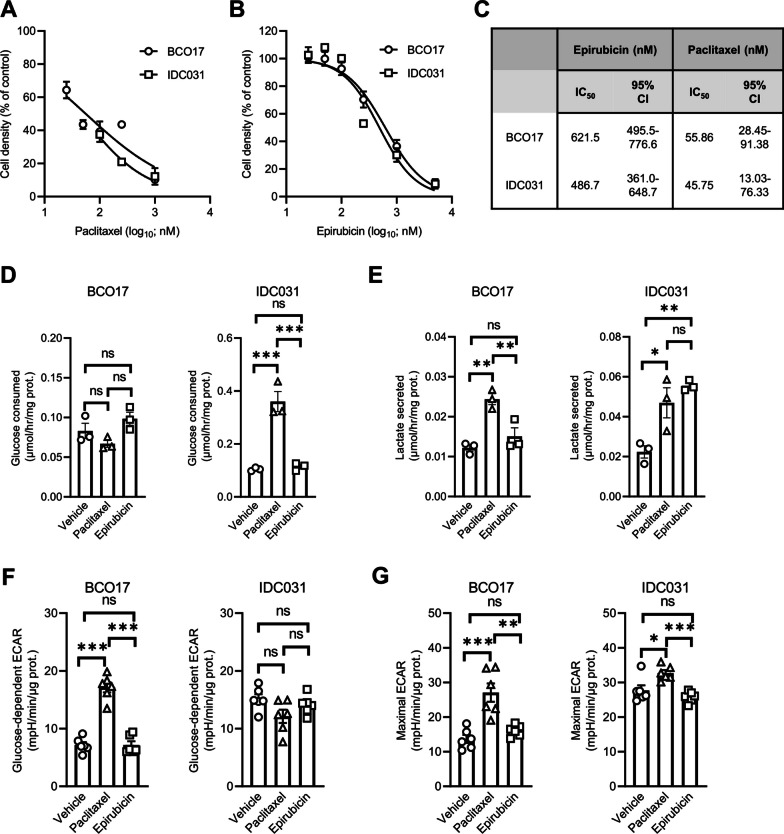
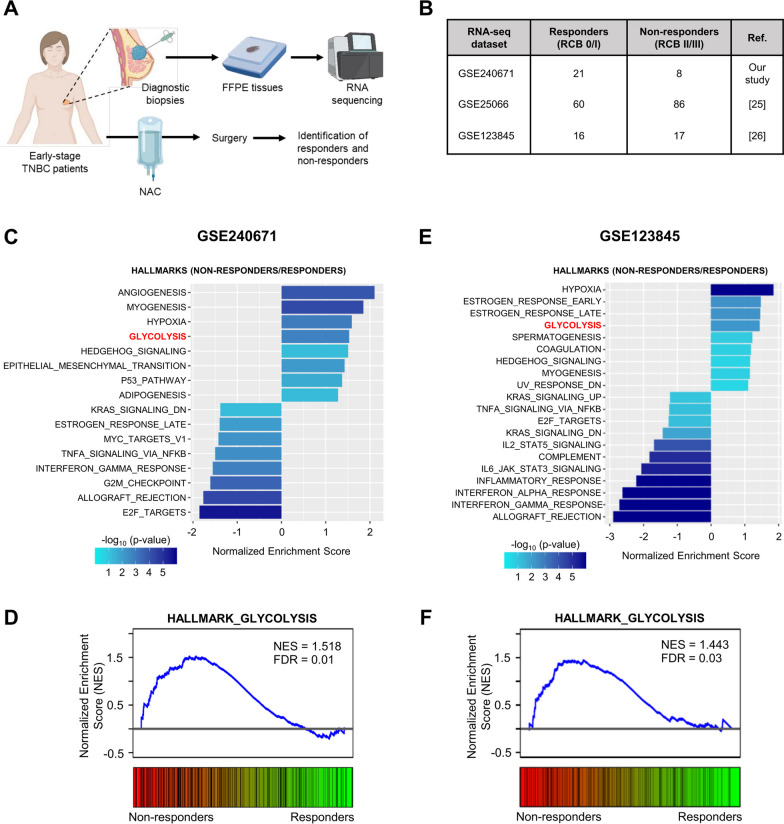
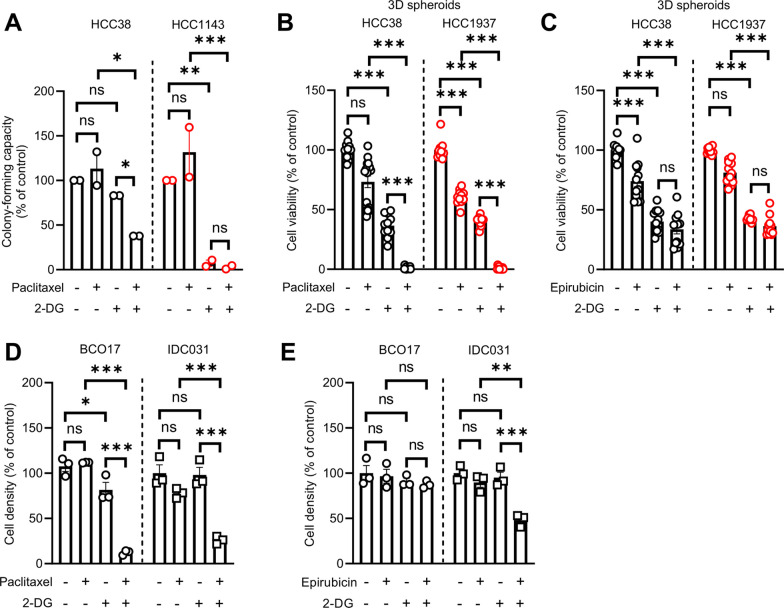
Methods: Human TNBC cell lines and patient-derived organoids were used in combination with real-time metabolic assays to evaluate the effect of NAC (paclitaxel and epirubicin) on tumor cell metabolism, in particular glycolysis. Diagnostic biopsies (pre-NAC) from patients with early TNBC were analyzed by bulk RNA-sequencing to evaluate the predictive value of a glycolysis-related gene signature.

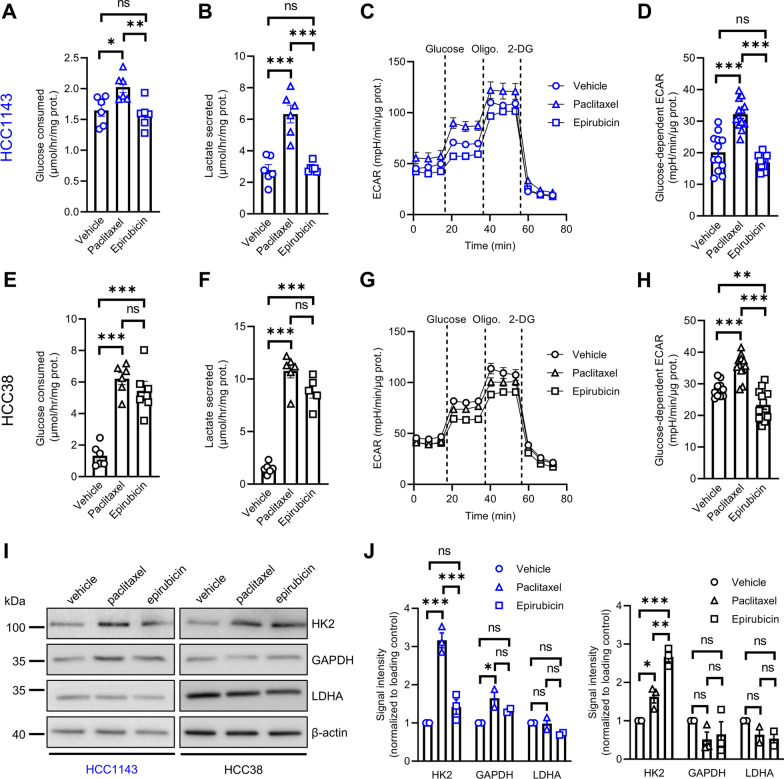
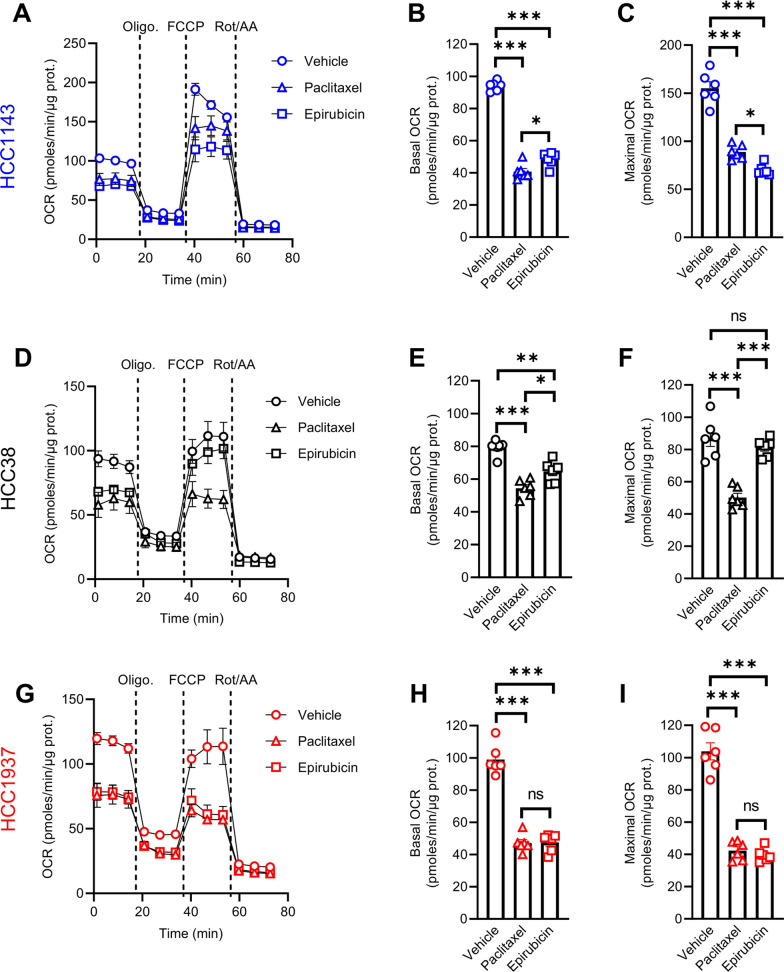
Results: Paclitaxel induced a consistent metabolic switch to glycolysis, correlated with a reduced mitochondrial oxidative metabolism, in TNBC cells. In pre-NAC diagnostic biopsies from TNBC patients, glycolysis was found to be upregulated in non-responders. Furthermore, glycolysis inhibition greatly improved response to NAC in TNBC organoid models.

Conclusions: Our study pinpoints a metabolic adaptation to glycolysis as a mechanism driving resistance to NAC in TNBC. Our data pave the way for the use of glycolysis-related genes as predictive biomarkers for NAC response, as well as the development of inhibitors to overcome this glycolysis-driven resistance to NAC in human TNBC patients.

Keywords: Early triple negative breast cancer; Glycolysis; Metabolism; Neoadjuvant chemotherapy; Organoids; Therapy resistance.


Conflict of interest statement

The authors declare that they have no competing interests.

Figures

Fig. 1
Fig. 1
Early TNBC cell lines exhibit different basal glycolytic activities. A, B Growth of HCC1143, HCC38 and HCC1937 TNBC cell lines after treatment with increasing concentrations of epirubicin (A) or paclitaxel (B) for 72 h. C Calculated IC50 values and 95% confidence intervals for epirubicin and paclitaxel in TNBC cell lines. DE Growth of HCC1143, HCC38 and HCC1937 TNBC cell lines after treatment with IC50 of epirubicin (D) or paclitaxel (E) for 24 h and then for 48 h upon drug withdrawal (washout). F Extracellular acidification rates (ECAR) in HCC1143, HCC38 and HCC1937 cells upon sequential treatment with 10 mM glucose, 1 µM oligomycin and 50 mM 2-deoxyglucose (2-DG). GH Glucose-dependent (G) and maximal ECAR (H) in HCC1143, HCC38 and HCC1937 cells. IJ Glucose consumption (I) and lactate secretion (J) in HCC1143, HCC38 and HCC1937 TNBC cell lines. K Representative immunoblotting for HK2, GAPDH and LDHA in HCC1143, HCC38 and HCC1937 cells. L Quantification of LDHA protein levels in HCC1143, HCC38 and HCC1937 cells. Data are plotted as the means ± SEM from n = 3–6 cultures, performed each time with ≥ 3 technical replicates (A, B, DJ and L). Significance was determined by one-way ANOVA with Tukey’s multiple comparison test (GJ and L). *p < 0.05; ***p < 0.001; ns, not significant
Fig.  2
Fig.  2
Paclitaxel and epirubicin induce opposite effects on glycolytic activity in TNBC cells. A, B Glucose consumption (A) and lactate secretion (B) in HCC1143 cells upon treatment with 9 nM paclitaxel or 600 nM epirubicin for 72 h. C, D ECAR profile upon sequential treatment with 10 mM glucose, 1 µM oligomycin and 50 mM 2-DG (C) and glucose-dependent ECAR (D) in HCC1143 cells treated with 9 nM paclitaxel or 600 nM epirubicin for 24 h. E, F Glucose consumption (E) and lactate secretion (F) in HCC38 cells upon treatment with 4 nM paclitaxel or 25 nM epirubicin for 72 h. G, H ECAR profile upon sequential treatment with 10 mM glucose, 1 µM oligomycin and 50 mM 2-DG (G) and glucose-dependent ECAR (H) in HCC38 cells treated with 4 nM paclitaxel or 25 nM epirubicin for 24 h. I, J Representative immunoblotting (I) and quantification (J) for HK2, GAPDH and LDHA in HCC1143 and HCC38 cells upon treatment with 9 or 4 nM paclitaxel, respectively, and 600 or 25 nM epirubicin, respectively for 72 h. Data are plotted as the means ± SEM from n = 2–6 cultures, performed each time with ≥ 3 technical replicates (AH, and J). Significance was determined by one-way ANOVA (A, B, DF, and H) or two-way ANOVA (J) with Tukey’s multiple comparison test. *p < 0.05; **p < 0.01; ***p < 0.001; ns, not significant
Fig. 3
Fig. 3
Mitochondrial oxidative metabolism is decreased in TNBC cells upon treatment with chemotherapy. AC Oxygen consumption rates (OCR) upon sequential treatment with 1 µM oligomycin, 2 µM FCCP and 0.5 µM rotenone/antimycin A (A), and OCR at basal (B) and maximal levels (C) in HCC1143 cells treated with 9 nM paclitaxel or 600 nM epirubicin for 24 h. DI OCR values in HCC38 (DF) and HCC1937 (GI) in the same experimental conditions than indicated for HCC1143 cells (except that 4 and 300 nM paclitaxel as well as 25 and 800 nM epirubicin were used for HCC38 and HCC1937 cells, respectively). Data are plotted as the means ± SEM from n = 6 cultures, performed each time with ≥ 3 technical replicates (AI). Significance was determined by one-way ANOVA (B, C, E, F, and H, I) with Tukey’s multiple comparison test. *p < 0.05; **p < 0.01; ***p < 0.001; ns, not significant
Fig. 4
Fig. 4
Basal glycolytic activity is heterogeneous in patient-derived TNBC organoid models. A Schematic representation of the experimental workflow for organoid initiation and culturing from treatment-naive TNBC patients. B, C Representative brightfield pictures B and molecular characteristics C of patient-derived TNBC organoid models BCO17 and IDC031. Scale bar: 50 µm. D Representative immunohistochemical staining for ER, PR, HER2 and Ki67 in BCO17 organoids and matching primary tumor tissue. Scale bars: 17.3 µm (organoids); 50 µm (primary tissue). E–F Glucose consumption (E) and lactate secretion (F) in BCO17 and IDC031 organoids. G, H ECAR profile upon sequential treatment with 20 mM glucose, 1 µM oligomycin and 50 mM 2-DG (G) and glucose-dependent ECAR (H) in BCO17 and IDC031 organoids. Data are plotted as the means ± SEM from n = 3–6 cultures, performed each time with ≥ 3 technical replicates (E–H). Significance was determined by Student’s t test (E, F, and G). *p < 0.05; ***p < 0.001
Fig. 5
Fig. 5
Paclitaxel induces a metabolic shift from oxidative metabolism towards glycolysis in patient-derived TNBC organoids. A, B Growth of BCO17 and IDC031 TNBC organoids after treatment with increasing concentrations of paclitaxel A or epirubicin B for 7 days. C Calculated IC50 values and 95% confidence intervals for epirubicin and paclitaxel in TNBC organoids. D, E Glucose consumption (D) and lactate secretion (E) in BCO17 and IDC031 TNBC organoids treated with 10 nM paclitaxel or 125 nM epirubicin for 7 days. FG Glucose-dependent (F) and maximal ECAR (G) in BCO17 and IDC031 organoids treated with 10 nM paclitaxel or 125 nM epirubicin for 7 days. Data are plotted as the means ± SEM from n = 3–6 cultures, performed each time with ≥ 3 technical replicates (A, B, and DG). Significance was determined by one-way ANOVA with Tukey’s multiple comparison test (DG). *p < 0.05; **p < 0.01; ***p < 0.001; ns, not significant
Fig. 6
Fig. 6
Increased glycolysis correlates with NAC resistance in patient-derived TNBC clinical specimens. A Schematic representation of the clinical workflow for collection of diagnostic biopsies from patients with early-stage TNBC treated with NAC, recruited in this study. B RNA-sequencing datasets, from early TNBC human patients, used for gene set enrichment analysis (GSEA) between responders (RCB 0/I) and non-responders (RCB II/III) to NAC. C–F Pathways significantly up- and down-regulated (C, E) and individual enrichment plots for glycolysis hallmark (D, F) from GSEA of RNA-seq data in NAC-responding and non-responding TNBC specimens (GSE240671 and GSE123845 datasets for C, D and E, F panels, respectively)
Fig. 7
Fig. 7
Glycolysis inhibition improves response to NAC in 3D TNBC cell models. A Colony-forming capacity of HCC38 and HCC1143 cells treated with 12.5 mM 2-DG alone or in combination with 0.04 nM and 0.12 nM paclitaxel respectively, for 3 days. B, C Growth of 3D spheroids initiated from HCC38 and HCC1937 cells treated with 50 mM 2-DG alone or in combination with 22 and 37.8 µM paclitaxel respectively B or 624 nM and 617.5 nM epirubicin respectively C for 3 days. D, E Growth of BCO17 and IDC031 TNBC organoids after treatment with 50 mM 2-DG alone or in combination with 50 nM paclitaxel D or 100 nM epirubicin E for 7 days. Data are plotted as the means ± SEM from n = 2–3 cultures, performed each time with ≥ 2 technical replicates (AE). Significance was determined by two-way ANOVA with Tukey’s multiple comparison test (AE). *p < 0.05; **p < 0.01; ***p < 0.001; ns, not significant

References

    1. Cardoso F, Kyriakides S, Ohno S, Penault-Llorca F, Poortmans P, Rubio IT, et al. Early breast cancer: ESMO Clinical Practice Guidelines for diagnosis, treatment and follow-up. Ann Oncol. 2019;30(10):1674. doi: 10.1093/annonc/mdz189. - DOI - PubMed
    1. Early Breast Cancer Trialists' Collaborative G. Long-term outcomes for neoadjuvant versus adjuvant chemotherapy in early breast cancer: Meta-analysis of individual patient data from ten randomised trials. Lancet Oncol. 2018;19(1):27–39. - PMC - PubMed
    1. Yau C, Osdoit M, van der Noordaa M, Shad S, Wei J, de Croze D, et al. Residual cancer burden after neoadjuvant chemotherapy and long-term survival outcomes in breast cancer: A multicentre pooled analysis of 5161 patients. Lancet Oncol. 2022;23(1):149–160. doi: 10.1016/S1470-2045(21)00589-1. - DOI - PMC - PubMed
    1. Cortazar P, Zhang L, Untch M, Mehta K, Costantino JP, Wolmark N, et al. Pathological complete response and long-term clinical benefit in breast cancer: The CTNeoBC pooled analysis. Lancet. 2014;384(9938):164–172. doi: 10.1016/S0140-6736(13)62422-8. - DOI - PubMed
    1. Symmans WF, Wei C, Gould R, Yu X, Zhang Y, Liu M, et al. Long-term prognostic risk after neoadjuvant chemotherapy associated with residual cancer burden and breast cancer subtype. J Clin Oncol. 2017;35(10):1049–1060. doi: 10.1200/JCO.2015.63.1010. - DOI - PMC - PubMed

Publication types

MeSH terms