. 2024 Feb 19;15(1):1487.
doi: 10.1038/s41467-024-45647-8.

PIBF1 regulates trophoblast syncytialization and promotes cardiovascular development

Affiliations

PIBF1 regulates trophoblast syncytialization and promotes cardiovascular development

Jong Geol Lee et al. Nat Commun. .

Abstract

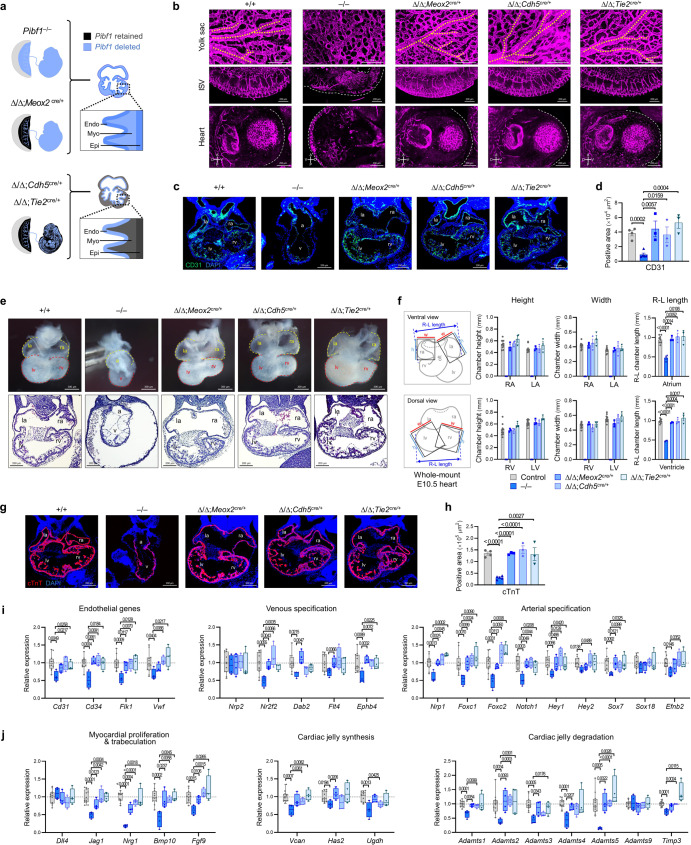
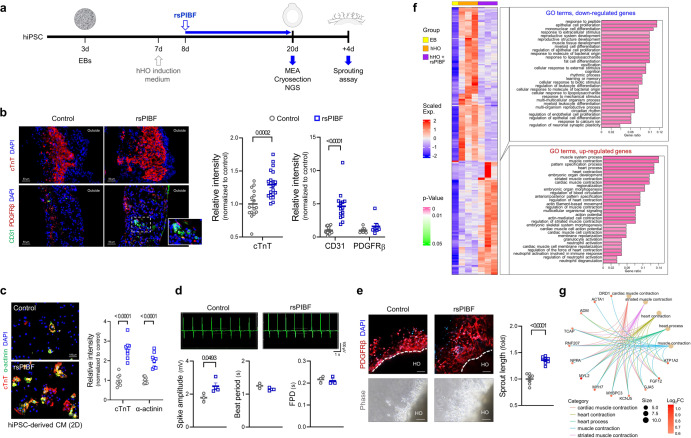
Proper placental development in early pregnancy ensures a positive outcome later on. The developmental relationship between the placenta and embryonic organs, such as the heart, is crucial for a normal pregnancy. However, the mechanism through which the placenta influences the development of embryonic organs remains unclear. Trophoblasts fuse to form multinucleated syncytiotrophoblasts (SynT), which primarily make up the placental materno-fetal interface. We discovered that endogenous progesterone immunomodulatory binding factor 1 (PIBF1) is vital for trophoblast differentiation and fusion into SynT in humans and mice. PIBF1 facilitates communication between SynT and adjacent vascular cells, promoting vascular network development in the primary placenta. This process affected the early development of the embryonic cardiovascular system in mice. Moreover, in vitro experiments showed that PIBF1 promotes the development of cardiovascular characteristics in heart organoids. Our findings show how SynTs organize the barrier and imply their possible roles in supporting embryogenesis, including cardiovascular development. SynT-derived factors and SynT within the placenta may play critical roles in ensuring proper organogenesis of other organs in the embryo.


Conflict of interest statement

J.G.L., J.-M.Y., K.K., Y.S.C., and I.-J.B. have filed a provisional patent application in the Korea patent office (composition for preventing and treating pregnant complications related to placenta and/or fetal cardiovascular abnormalities by targeting PIBF1). All the other authors declare no competing interests.

Figures

Fig. 1
Fig. 1. PIBF1 is required for trophoblast syncytialization.
a Trophoblast fusion assay in WT and PIBF1 KO BeWo cells. BeWo boundaries and nuclei were stained with Di-8-ANEPPS (Di-8; green) and Hoechst (blue), respectively. White and red dotted lines delineate the plasma membrane and nuclei within the fused cells. n = 24, 34, 31, 33 in each group. b Expressions of SynT markers in FSK-treated PIBF1 KO BeWo cells. n = 5-6 per group. c Levels of hCG secreted by FSK-treated PIBF1 KO BeWo cells. n = 4 per group. d Expressions of β-hCG and PIBF1 in FSK-treated PIBF1 KO BeWo cells. β-actin was used as an internal control. e Phase-contrast images of PIBF1 KO hTSC-derived syncytiotrophoblast (TS-SynT) in 2D (upper) and 3D cultures (lower) and immunostaining of β-hCG (green) in 2D PIBF1 KO TS-SynT (middle). White and red dotted lines delineate the plasma membrane and nuclei within the fused cells. f Expressions of SynT markers in 2D and 3D PIBF1 KO TS-SynT. n = 4-5 per group. g Levels of hCG secreted by 2D and 3D PIBF1 KO TS-SynT. n = 4-5 per group. h Expressions of TS markers in 2D and 3D PIBF1 KO TS-SynT. n = 4-5 per group. i Schematic diagram of PIBF1 KO hTSC engraftment into immunodeficient NSG mice. j Serum hCG level in NSG mice subcutaneously injected with PIBF1 KO hTSCs. n = 4 per group. k Representative images of over-the-counter hCG pregnancy test of urine samples collected from PIBF1 KO hTSC-injected mice. l Gross trophoblastic lesions that were developed from transplanted PIBF1 KO hTSCs. m H&E and immunofluorescence staining of KRT7 (white), β-hCG (green), and HLA-G (red) in a PIBF1 KO hTSC-derived lesion. n Expression of PIBF1 in FSK-treated PIBF1 KO BeWo reintroduced with full-length (fPIBF) and/or secretory PIBF1 (sPIBF). o Fusion assay in PIBF1 KO BeWo cells after the restoration of fPIBF and/or sPIBF. n = 25, 24, 22, 23, 23 in each group. p Fusion assay in PIBF1 KO BeWo cells supplemented with recombinant fPIBF1 (rfPIBF) and/or sPIBF1 (rsPIBF). n = 16, 19, 20, 19 in each group. Fusion assay data (a, o, and p) are expressed relative to that of WT control. Transcript expression data were normalized to RPS18 (b) or GAPDH (f and h) and expressed relative to that of WT. Data are presented as mean ± SEM (a, c, g, j, o, and p) or box-and-whisker plots where the interquartile range (IQR) of boxplot is between Q1 and Q3, the center line indicates the median value, whiskers of boxplot is extended to the maxima and minima, and maxima is Q3 + 1.5×IQR and minima is Q1 − 1.5×IQR (b, f, and h); *P < 0.05; **P < 0.01; ***P < 0.001; ****P < 0.0001 in one-way ANOVA (a-c, o, and p) or two-sided Student’s t-test (f-h and j). The number n represents biologically independent cells in each group. Source data are provided as a Source Data file.
Fig. 2
Fig. 2. Trophoblast-derived PIBF1 mediates vasculature formation in vitro.
a Multiple reaction monitoring (MRM) analysis of intracellular and secreted PIBF1 in hTSC, TS-SynT, and TS-EVT. n.s., not significant. n = 3-4 per group. b Schematic diagram of endothelial recruitment by hTSC-derived SynT or fused BeWo cells. CV, crystal violet. c Recruitment analysis of HUVEC by differentiated SynT from WT and PIBF1 KO hTSCs. n = 10 per group. d Recruitment analysis of HUVEC by WT and PIBF1 KO BeWo cells restoration of fPIBF and/or sPIBF. n = 24, 22, 22, 23, 25 in each group. e Representative images for migration (upper panel) and tube forming assay (lower panel) in rsPIBF-treated HUVEC. Scale bar: 200 μm. f, g Quantified data from migration (f) (n = 20, 19, 13, 13, 24, 23 in each group) and tube forming assay (g) (n = 15, 10, 11, 13, 15, 13 in each group of master segments count, n = 11, 12, 8, 9, 9, 7 in each group of total tubes count) in rsPIBF-treated HUVEC. h Expressions of angiogenesis-related signaling cascades in rsPIBF-treated HUVEC. Data were normalized to β-actin. n = 3–5 per group. i, j Migration (i) (n = 13, 19, 15, 14, 17, 15 in each group) and tube forming assay (j) (n = 15, 31, 26, 27, 20, 24 in each group of master segments count, n = 8, 13, 12, 15, 7, 11 in each group of total tube count) in rsPIBF-treated HUAEC. k Migration assay in rsPIBF-treated placental pericytes. n = 25, 13, 15, 16, 16, 14 in each group. Recruitment (c, d), migration (f, i, and k), tube forming (g and j), and the band intensity of protein data (h) are expressed relative to WT control and are presented as mean ± SEM; *P < 0.05; **P < 0.01; ***P < 0.001; ****P < 0.0001 in one-way ANOVA (a, c, d, fk). The number n represents biologically independent cells in each group. Source data are provided as a Source Data file.
Fig. 3
Fig. 3. Trophoblast syncytialization and vascular labyrinth integrity of the placenta are impaired in E10.5 Pibf1-null mice.
a Schematic diagram of the lineages containing Pibf1 deletion in the Pibf1−/− conceptus and labyrinth interhaemal membrane. S-TGC, sinusoidal trophoblast giant cell. ST-I and -II, syncytiotrophoblast type I and II, respectively. EC, endothelial cell. b Placental histology and gross appearance of Pibf1−/− embryos. Solid black lines denote the maximum thickness of the labyrinth. dec, decidua. jz, junctional zone. lab, labyrinth. ch, chorion. al, allantois. c, d Gross histological assessment of placental morphology (c) and morphometric analysis of the labyrinth vascular beds (d) in Pibf1−/− placentas. mbs and fbs, maternal and fetal blood space, respectively. n = 4–5 per group. e Fatty acid (FA) contents in Pibf1−/− placenta and embryo at E9.5-10.5 as measured by gas chromatography coupled with mass spectrometry (GC-MS). Data are expressed as the relative amount (%) (colored bar) compared to that of wild type (WT; gray bar) (n = 6/genotype). The term “acid” was omitted except for docosahexaenoic acid (DHA). NEFA, non-essential FA; EFA, essential FA. n = 6 per group. f Proliferation of labyrinth trophoblasts in Pibf1−/− placenta as determined by the proportion of Ki67-positive cells in labyrinth trophoblasts. n = 3 per group. g Expressions of markers for TSC and its lineages in Pibf1−/− placenta. GlyT, glycogen trophoblast cell. SpT, spongiotrophoblast. n = 4 per group. h Distribution of maternal blood sinus-covered sinusoidal TGC (S-TGC) in Pibf1−/− labyrinth labeled with endogenous alkaline phosphatase. i Immunofluorescence staining of MCT1 (red) and MCT4 (green) to detect SynT-I (arrowhead) and -II (arrow) layers, respectively, in Pibf1−/− placenta. m and f, maternal and fetal blood sinus, respectively. j Ultrastructure of the interhaemal membrane in Pibf1−/− labyrinth. (Upper panel) Toluidine blue (TB)-stained semithin section and thickness of the interhaemal membrane. (Lower panel) Pseudo-colored transmission electron microscopy (EM) images in ultrathin section (lower). ii, ii’, and ii” denote a lack of fusion within SynT-II. Hashtag denotes an excessive electron-dense area in SynT-I. ec, endothelial cell. i, SynT-I. ii, SynT-II. n = 5 per group. k Immunostaining of Laminin and TUNEL to label endothelial lining of fetal blood vessels and apoptotic cells in Pibf1−/− placenta. TUNEL-positive signals were detected only in cells associated with the fetal-derived vessel or fetal red blood cells in Pibf1−/− labyrinth (arrows). l Expressions of endothelial vasculature markers in laser micro-dissected Pibf1−/− placenta sections. n = 4 per group. Experimental samples were obtained on E10.5 unless indicated otherwise. Transcript expression data (g and l) were normalized to Gapdh and expressed relative to that of WT. Data are presented as mean ± SEM (cf, and j) or box-and-whisker plots where the interquartile range (IQR) of boxplot is between Q1 and Q3, the center line indicates the median value, whiskers of boxplot is extended to the maxima and minima, and maxima is Q3 + 1.5×IQR and minima is Q1 − 1.5×IQR (g and l); *P < 0.05; **P < 0.01; ***P < 0.001 in two-sided Student’s t-test. The number n represents biologically independent embryos or placentas in each group. Source data are provided as a Source Data file.
Fig. 4
Fig. 4. Pibf1 is required in trophoblast development, but not endothelial/hematopoietic lineages, for normal syncytialization, placental vascularization, and subsequent embryo survival in mice.
a Schematic diagram of the lineages containing Pibf1 deletion in the conceptus and labyrinth interhaemal membrane with conditional knockout (cKO) driven by Meox2cre (cKOMeox2). b The expected and observed genotype distribution in cKOMeox2 intercross. c Placental histology and gross appearance of cKOMeox2 embryos. Gross histological assessment of placental morphology d (n = 4-6 per group) and morphometric analysis of the labyrinth vascular beds (e) (n = 4 per group) in cKOMeox2 placentas. f Measurement of the crown-rump length in cKOMeox2 embryos. n = 4–5 per group. g Expressions of markers for TSC and its lineages in cKOMeox2 placenta. n = 4 per group. h Immunofluorescence staining of MCT1 (red) and MCT4 (green) to detect SynT-I (arrowhead) and -II (arrow) layers, respectively, in cKOMeox2 placenta. i Expressions of markers for endothelial vasculature in laser micro-dissected sections of cKOMeox2 placenta. n = 4 per group. j Hematopoietic potential in the yolk sac (ys), embryo proper (em), and placenta (pl) of Pibf1 KO and cKOMeox2 as determined by colony forming unit (CFU) assay. CFU-GEMM = CFU-granulocyte, erythroid, macrophage, megakaryocyte. CFU-GM = CFU-granulocyte, macrophage. BFU-E = burst forming unit-erythroid. n = 11, 5, 7 in each group. k Schematic diagram of the lineages containing Pibf1 deletion in the conceptus and labyrinth interhaemal membrane with endothelial-specific cKO (ecKO) driven by Cdh5cre (cKOCdh5) or Tie2cre (cKOTie2). l The expected and observed genotype distribution in cKOCdh5 or cKOTie2 intercross. m Placental histology and gross appearance of cKOCdh5 and cKOTie2 embryos. n Gross histological assessment of ecKO placentas. n = 7, 4, 4 in each group. o Measurement of crown-rump length in ecKO embryos. n = 8, 4, 5 in each group. p Hematopoietic potential in ecKO mutants as determined by CFU assay. n = 6, 3, 4 in each group. Experimental samples were obtained on E10.5 unless indicated otherwise. Transcript expression data (g and i) were normalized to Gapdh and expressed relative to that of the control group, and CFU data (j and p) were expressed relative to that of the control group. The number in each bar indicates sample size (n) in (j) and (p). Data are presented as mean ± SEM (df, i, j, and n-p) or mean ± minimum to maximum (g). n.s., not significant in one-sided χ2 test (b and l); **P < 0.01; ***P < 0.001 in one-way ANOVA. The number n represents biologically independent embryos or placentas in each group. Source data are provided as a Source Data file.
Fig. 5
Fig. 5. Placenta with properly syncytialized trophoblasts maintains embryonic development of vasculature and heart in mice.
a Schematic diagram of the lineages containing Pibf1 deletion in the heart with whole-body Pibf1 KO (Pibf1−/−), epiblast-specific cKO (cKOMeox2), or endothelial-specific cKO (cKOCdh5, cKOTie2). Endo, endocardium, Myo, myocardium, Epi, epicardium. b Whole-mount CD31 stain of the yolk sac, intersomitic vasculature (ISV), and heart in Pibf1 mutant embryos. Yellow dotted lines in the images of the yolk sac mark continuous vessels with a diameter ≥ 40 μm. Experiments in b are representative of three independent experiments with similar data. Immunostaining of CD31 in histological sections (c) and quantification of CD31-stained areas (d) in Pibf1 mutant hearts. a, atrium. la and ra, left and right atrium. v, ventricle. lv and rv, left and right ventricle. n = 4, 5, 3, 3, 3 in each group. e Whole-mount images and histological examination of Pibf1 KO and cKO hearts. White lines indicate the maximum length from edge to edge of the right and left chambers. Note that left or right chambers were not specified in the Pibf1 KO heart. f Comparison of the chamber size of Pibf1 KO and cKO hearts as measured from the whole-mount images. n = 11, 3, 3, 3, 3 in each group. Immunostaining of cTnT in histological sections (g) and quantification of cTnT-stained areas (h) in Pibf1 mutant hearts. n = 4, 5, 3, 3, 3 in each group. i, j Expressions of markers for coronary vascular development (i) and cardiogenesis (j) in Pibf1 KO and cKO hearts. n = 12, 4, 4, 4, 4 in each group. Experimental samples were obtained on E10.5 unless indicated otherwise. Transcript expression data (i and j) were normalized to Gapdh and expressed relative to that of the control group. Data are presented as mean ± SEM (d, f, and h) or box-and-whisker plots where the interquartile range (IQR) of boxplot is between Q1 and Q3, the center line indicates the median value, whiskers of boxplot is extended to the maxima and minima, and maxima is Q3 + 1.5×IQR and minima is Q1 − 1.5×IQR (i and j); *P < 0.05; **P < 0.01; ***P < 0.001 in one-way ANOVA. The number n represents biologically independent embryos or placentas in each group. Source data are provided as a Source Data file.
Fig. 6
Fig. 6. PIBF1 facilitates the manifestation of cardiovascular features in human heart organoids.
a Schematic diagram of differentiation from iPSC into hHO and application of rsPIBF. b Immunostaining of cTnT, CD31, and PDGFRβ in rsPIBF-treated hHO. n = 16, 21 (cTnT), n = 13, 15 (CD31), n = 8, 7 (PDGFRβ) in each group. c Immunostaining of cTnT and α-actinin in rsPIBF-treated hiPSC-derived 2D-cultured cardiomyocytes. n = 8 per group. d Multi-electrodes array (MEA) in rsPIBF-treated hHOs. FPD, field potential duration. n = 3-4 per group. e Sprouting assay of rsPIBF-treated hHOs. Sprouts were viewed as phase-contrast and PDGFRβ-stained images. n = 7-8 per group. Scale bar: 100 μm. f Expression pattern of significantly up-or down-regulated genes in sPIBF-treated hHO compared to the non-treated group was visualized using a heatmap. Two clusters of genes were identified by hierarchical clustering based on their expression patterns, and representative GO terms of each cluster were visualized using a barplot (width and color of the bars indicate gene ratio and p-value, respectively). EB, embryonic body. g The top 5 enriched GO terms (big dots) on significantly up-regulated genes by sPIBF treatment were visualized with their associated genes (small dots). The size of big dots indicates the number of associated genes. The color of small dots indicates the binary logarithm of the fold change of the genes by sPIBF treatment. The lines connecting the GO term and the associated gene were uniquely colored by the GO term. The intensity of fluorescence-labeled cells (b, c) and sprout length data (e) are expressed relative to control. Data are presented as mean ± SEM (b-e); *P < 0.05; ***P < 0.001; ****P < 0.0001 in two-sided Student’s t-test (b-e). The n number represents biologically independent hHOs in each group. Source data are provided as a Source Data file.
Fig. 7
Fig. 7. PIBF1 is crucial for trophoblast syncytialization, and syncytiotrophoblast-derived PIBF1 mediates the formation of a multi-layered feto-maternal interface in the placenta, contributing to the proper embryo development, including the cardiovascular system.
Trophoblast stem cell (TSC) differentiates into syncytiotrophoblast (SynT) through cell-to-cell fusion via PIBF1. The resulting SynT communicates via secreted PIBF1 with adjacent vessel-forming cells such as endothelial cells and pericytes to promote their recruitment and angiogenesis, thereby establishing the interhaemal membrane that constitutes the materno-fetal interface of the primary placenta. SynT-I and SynT-II, syncytiotrophoblast type I and II; S-TGC, sinusoidal trophoblast giant cell.

References

    1. Reus AD, et al. Early first-trimester trophoblast volume in pregnancies that result in live birth or miscarriage. Ultrasound Obstet. Gynecol. 2013;42:577–584. doi: 10.1002/uog.13197. - DOI - PubMed
    1. Dugas, C. & Slane, V. H. In: Miscarriage. Treasure Island (FL): StatPearls Publishing (2023). - PubMed
    1. Donovan, M. F. & Cascella, M. In: Embryology, Weeks 6-8. Treasure Island (FL): StatPearls Publishing (2023). - PubMed
    1. Perez-Garcia V, et al. Placentation defects are highly prevalent in embryonic lethal mouse mutants. Nature. 2018;555:463–468. doi: 10.1038/nature26002. - DOI - PMC - PubMed
    1. Jones HN, et al. Hypoplastic left heart syndrome is associated with structural and vascular placental abnormalities and leptin dysregulation. Placenta. 2015;36:1078–1086. doi: 10.1016/j.placenta.2015.08.003. - DOI - PMC - PubMed

Substances