. 2024 Feb 19;15(1):1394.
doi: 10.1038/s41467-024-45341-9.

A single cell atlas of frozen shoulder capsule identifies features associated with inflammatory fibrosis resolution

Collaborators, Affiliations

A single cell atlas of frozen shoulder capsule identifies features associated with inflammatory fibrosis resolution

Michael T H Ng et al. Nat Commun. .

Abstract

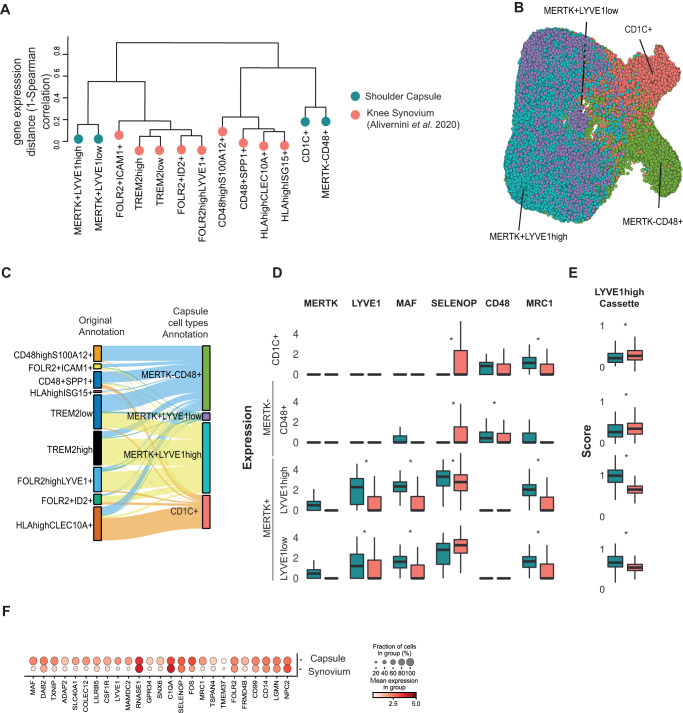
Frozen shoulder is a spontaneously self-resolving chronic inflammatory fibrotic human disease, which distinguishes the condition from most fibrotic diseases that are progressive and irreversible. Using single-cell analysis, we identify pro-inflammatory MERTKlowCD48+ macrophages and MERTK + LYVE1 + MRC1+ macrophages enriched for negative regulators of inflammation which co-exist in frozen shoulder capsule tissues. Micro-cultures of patient-derived cells identify integrin-mediated cell-matrix interactions between MERTK+ macrophages and pro-resolving DKK3+ and POSTN+ fibroblasts, suggesting that matrix remodelling plays a role in frozen shoulder resolution. Cross-tissue analysis reveals a shared gene expression cassette between shoulder capsule MERTK+ macrophages and a respective population enriched in synovial tissues of rheumatoid arthritis patients in disease remission, supporting the concept that MERTK+ macrophages mediate resolution of inflammation and fibrosis. Single-cell transcriptomic profiling and spatial analysis of human foetal shoulder tissues identify MERTK + LYVE1 + MRC1+ macrophages and DKK3+ and POSTN+ fibroblast populations analogous to those in frozen shoulder, suggesting that the template to resolve fibrosis is established during shoulder development. Crosstalk between MerTK+ macrophages and pro-resolving DKK3+ and POSTN+ fibroblasts could facilitate resolution of frozen shoulder, providing a basis for potential therapeutic resolution of persistent fibrotic diseases.


Conflict of interest statement

CDB and MC have founders shares in Mestag Therapeutics. There are no other competing interests to declare.

Figures

Fig. 1
Fig. 1. Cell types comprising the resolving inflammatory fibrotic niche.
A Representative images showing Haematoxylin & Eosin staining of sections of comparator and frozen shoulder patient tissues. Distinct lining and sub-lining regions of the capsule are identified, frozen shoulder tissue sections show increased cellularity and vascularity relative to comparator tissues. Nuclear counterstain is violet, scale bar=50μm. scRNA-seq analysis of adult shoulder capsule from tissue biopsy samples collected from comparator (n = 6) and frozen shoulder (n = 4) patient donors. B UMAP shows the major cell types identified (resolution = 0.4) C The boxplots show the relative frequencies of the cell types in comparator and frozen shoulder patient tissues highlighting credible differences in the proportion of fibroblasts between these sample types (indicated by *). D The 4 identified lymphoid clusters (resolution = 0.2). E Violin plots of selected lymphoid cluster marker genes. F Relative frequencies of lymphoid clusters in comparator and frozen shoulder patient tissues. G The 4 identified myeloid clusters (resolution = 0.2). H Selected myeloid cluster marker genes. I Relative frequencies of myeloid clusters in comparator and frozen shoulder patient tissues. J The 6 identified fibroblast clusters (resolution = 0.3). K Selected fibroblast cluster marker genes. L The relative frequencies of the fibroblast clusters in comparator and frozen shoulder patient tissues. The credibility of differences in composition between the frozen shoulder and comparator samples was determined for each clusters C, F, I and L with scCODA (10% FDR). Violin plots in E, H, K show log-normalized expression values of selected cluster marker genes. Only significant cluster marker genes are shown (two-sided Wilcoxon tests, BH adjusted P values < 0.05). Box plots in C, F, I and L show median as centre, lower and upper quartiles as box limits, and whiskers with a length of 1.5 IQR.
Fig. 2
Fig. 2. Spatial topography of the resolving fibrotic niche.
A Panel shows representative confocal images of immunostaining for CD68 and a wider panel of macrophage markers confirming the topographical niches of MerTK+LYVE1high, MerTK+LYVE1low and MerTKlowCD48+ macrophage subsets in sections of comparator and frozen shoulder patient tissues. MerTK + LYVE1highMRC1 + CD163+ and MerTK + LYVE1lowFOLR2 + ICAM1 + CD83 + FCGR3A+ subsets predominate in the capsule lining; triple positive cells are highlighted with arrow heads (Figure S3G). MerTKlowCD48 + PTGS2 + S100A8 + IL1RA+ macrophages occupy lining and sub-lining regions. Cyan represents POPO-1 nuclear counterstain, scale bar = 20 μm. B Graph shows quantitative analysis of immunostaining for CD3 in comparator (C, n = 7 donors) and frozen shoulder (FS n = 7 donors) patient tissue sections, pooled from 3 independent experiments, statistically significant differences were calculated using a two-sided Mann-Whitney test (P = 0.0006). Panel shows representative ChipCytometry images of T cells in sections of frozen shoulder patient tissues, residing adjacent to vascular endothelium (CD31+). Panels show staining combinations for CD4 + T cells (CD127+), CD8+ T cells (CD161 + GZMK+) and NK cells (CD56 + GZMB+), nuclei counterstained cyan/blue, scale bar = 50 μm. C Representative confocal images showing labelling for a cassette of fibroblast markers confirming the topographical niches of identified fibroblast sub-populations from Fig. 1J in sections of comparator and frozen shoulder patient tissues. Sub-population markers include DKK3 + FMOD+, CXCL12 + PTGDS+, POSTN + CTHRC1+, ARC+CHI3L1+, MFAP5+ and CLIC5 + HBEGF + PRG4+. Cyan represents POPO-1 nuclear counterstain, scale bar = 20 μm. D Graphs show quantitative analysis (QA) of total cellularity and cellularity localised to lining and sub-lining regions. Data generated using tissue sections derived from a minimum of 7 comparator and 7 frozen shoulder donors, pooled from 3 independent experiments. Statistically significant differences were calculated using a two-sided Mann-Whitney test for lining cellularity (P = 0.001), sub-lining cellularity (P = 0.0003), total cellularity (P = 0.0003). QA analysis of macrophage markers in sections of tissue biopsies collected from comparator (C) and frozen shoulder (FS) patient donors including CD68 (n = 6 comparator and n = 6 frozen shoulder donors, P = 0.002) & CD48 (n = 5 comparator and n = 5 frozen shoulder donors, P = 0.008). QA for markers of fibroblast activation PDPN (P = 0.002) & CD90 (P = 0.002), (n = 6 comparator and n = 6 frozen shoulder donors for each marker). QA for matrix-associated markers POSTN (P = 0.008) and CTHRC1 (P = 0.008), (n = 6 comparator and n = 6 frozen shoulder donors for each marker). All immunostaining data were pooled from 4 independent experiments. Statistically significant differences were calculated using two-sided Mann-Whitney tests. Bars represent median values. ***P < 0.001, **P < 0.01.
Fig. 3
Fig. 3. Capsular MERTKhigh macrophages have a modulatory phenotype.
A The heatmap shows the top 20 marker genes for the capsular myeloid cell clusters (two-sided Wilcoxon test, BH adjusted P < 1 × 10⁻⁹. B Geneset over-representation analysis of gene ontology (GO) Biological Processes (BP) in the capsular myeloid clusters (one-sided Fisher tests, BH adjusted P < 0.05. C UMAPs show the expression of modulatory macrophage genes including MERTK, LYVE1, CD163, TREM2, FOLR2 and MRC1 in capsular macrophages, localising these markers to MERTK+LYVE1high and MERTK+LYVE1low clusters. D Representative images of 3,3′-diaminobenzidine immunostaining (brown) for MERTK in sections from comparator and frozen shoulder patient tissues, staining is localised to the capsule lining region. Nuclear counterstain is haematoxylin, scale bar=50μm. E Graph shows quantitative analysis of MERTK+ cells in comparator (C, n = 8 donors) and frozen shoulder (FS, n = 9 donors) patient tissues pooled from 2 independent experiments, bars show median values. Statistically significant differences were calculated using a two-sided Mann-Whitney test (P = 0.0055). F Violin plots show expression of MERTK ligands GAS6 and PROS1 in capsular fibroblast sub-populations. G Selected predicted ligand-receptor interactions between sender population (PROS1+ or GAS6+ fibroblasts) and receiver population (MERTK+LYVE1high or MERTK+LYVE1low macrophages) are shown. Predictions were generated from comparator (n = 6 donors) and frozen shoulder (n = 4 donors), sub-populations as in Fig. 1G (NATMI specificity score). H Representative immunofluorescence images of the lining region of frozen shoulder patient tissues, showing the topographical proximity of MERTK with associated ligands GAS6 and PROS1. Fibroblast markers include CLIC5, PDPN, AXL. Scale bar=20μm.
Fig. 4
Fig. 4. MerTKlow and MerTKhigh macrophages induce divergent responses in capsular fibroblasts from frozen shoulder patients.
A Heatmap showing selected genes that showed significant variance in expression between capsular fibroblasts from frozen shoulder patients co-incubated with MerTKhigh, MerTKlow MDMs or fibroblasts in isolation (DESeq2, LRT test, BH adjusted P < 0.05). See also Supplementary Fig. 8B. B Dot plot shows GO biological processes over-represented in the sets of genes down-regulated in capsular fibroblasts by incubation with MerTKhigh MDMs (group 1) or up-regulated by incubation with MerTKhigh MDMs (group 2). C The boxplots show the predicted proportions of fibroblast subsets identified in the single-cell analysis (Fig. 1J) present in the untreated, MerTKhigh-MDM co-cultured and MerTKlow-MDM co-cultured fibroblasts (n = 3 frozen shoulder patient donors in 2 independent experiments, bars show median value (median; centre, box limits; lower and upper quartile, whiskers; 1.5 IQR), deconvolution performed with MuSiC). D Selected predicted ligand-receptor interactions between MerTK+LYVE1+ myeloid and DKK3 + FMOD+ or POSTN + ACAN+ fibroblast sub-populations generated from differentially expressed genes from comparator (n = 6 donors) and frozen shoulder (n = 4 donors), sub-populations as in Fig. 1 (NATMI analysis). E The scatter plot shows the expression change of predicted ligand-receptor interactions between MerTK+LYVE1+ myeloid and DKK3 + FMOD+ or POSTN + ACAN+ fibroblast sub-populations in frozen shoulder relative to comparator patient tissues. F Protein-protein network association analysis of receptors (blue) highly expressed in frozen shoulder patient fibroblasts identified a candidate interaction with RUNX2 (analysis performed with IntAct). G Single-cell PySCENIC gene regulatory network analysis of fibroblasts (Fig. 1J, all clusters) identified a connection between the expression of RUNX2 and matrix associated genes including CDH11, MMP14, MMP13 and SPP1 (pink) in POSTN + ACAN+ fibroblasts.
Fig. 5
Fig. 5. Comparison of MERTKhigh macrophage clusters in shoulder capsule and knee RA synovial tissues.
A Dendrogram shows the transcriptomic Spearman correlation distance between human myeloid populations in comparator and frozen shoulder capsule tissues (blue) relative to knee RA synovial tissue macrophages (STMs, red) from Alivernini et al. (2020). In STMs, the MERTK + LYVE1+ cluster is annotated FOLR2highLYVE1+. B UMAP shows the Alivernini et al. (2020) STM cells with labels transferred from the myeloid clusters identified in adult shoulder capsule tissues (Fig. 1G) (scArches analysis) C The Sankey plot shows the mapping between the original STM sub-populations clusters identified by Alivernini et al. (2020) (left) and the transferred myeloid labels from the adult shoulder capsule tissues (MERTK–CD48+, MERTK+LYVE1low, MERTK+LYVE1high, CD1C+) (right). D The box plots show the normalized expression of myeloid genes including MAF, LYVE1, MERTK, SELENOP, CD48 and MRC1 in the shoulder capsule myeloid clusters (blue, as per Fig. 1G, CD1C+ cluster n = 7; other cell types n = 8) and the corresponding STM subsets (red, as predicted by label transfer, all cell types n = 10). Bars show median value, *P < 0.05 (Wald test). E Box plots (right) show cassette scores for marker genes of the MERTK+LYVE1high cluster in the shoulder capsule myeloid clusters (Fig. 1G, CD1C+ cluster n = 7; other cell types n = 8) and corresponding knee STM subsets (as predicted by label transfer, all cell types n = 10). Bars show median value, *P < 0.05 (Wald test). Box plots in D and E show median as centre, lower and upper quartiles as box limits, and whiskers with the length of 1.5 IQR. F Dot plot shows average expression of top 25 MERTK+LYVE1high macrophage cluster marker genes in the shoulder capsule MERTK+LYVE1high macrophages relative to their corresponding cells in the Alivernini et al. (2020) STMs (as predicted by label transfer). Box plots in D and E show median as centre, lower and upper quartiles as box limits, and whiskers with the length of 1.5 IQR.
Fig. 6
Fig. 6. The developing shoulder capsule informs a template for resolution.
scRNAseq was performed on 12, 15 and 17 pcw developing human shoulder joint tissues. A UMAP shows the major cell types comprising the developing foetal shoulder joint (resolution = 0.9). B UMAP (resolution = 0.6) shows identified myeloid populations in the developing shoulder joint (12, 15 and 17 pcw). Sub-clustering of myeloid populations revealed 7 distinct clusters including MERTK + LYVE1+ and MERTK+TIMD4+ populations. C The plot shows the same foetal cell UMAP with labels transferred from the adult shoulder capsule myeloid cells (Fig. 1G) (scArches analysis). D UMAP (resolution = 0.7) showing CD45–COL1A1+ stromal cell clusters in the developing shoulder joint (12, 15 and 17 pcw). E The plot shows the same UMAP of developing shoulder stromal cells with labels transferred from the adult clusters (Fig. 1J) (scArches analysis). F The Sankey plot shows the mapping between the clusters identified in the developing shoulder stromal cells (D) (left) and the transferred labels from the adult fibroblast populations (right). GJ Representative Cell DIVE and respective H&E stained images of histological sections of foetal shoulder joint at 17 post conception weeks (pcw) development stage. G, H Sections stained for a panel of markers to identify fibroblasts in the shoulder capsule during development (FMOD, DKK3, POSTN, CLU). DAPI nuclear counterstain is dark blue, scale bar = 20 μm. I High magnification image showing the cell types identified in foetal shoulder capsule including macrophages (CD68, CD163, MerTK) and fibroblasts (PDPN, CLU, AXL, GAS6) in the capsule lining region at 17 pcw. Scale bar = 20 μm. J High magnification image of the foetal shoulder capsule (17 pcw) showing immunostaining for macrophage markers MerTK, LYVE1, CD206 and CD163 in the capsule lining region. DAPI nuclear counterstain is dark blue, white arrows mark MerTK+ macrophages. Scale bar = 20 μm.

References

    1. Wynn TA. Fibrotic disease and the T(H)1/T(H)2 paradigm. Nat. Rev. Immunol. 2004;4:583–594. doi: 10.1038/nri1412. - DOI - PMC - PubMed
    1. Ramachandran P, et al. Resolving the fibrotic niche of human liver cirrhosis at single-cell level. Nature. 2019;575:512–518. doi: 10.1038/s41586-019-1631-3. - DOI - PMC - PubMed
    1. Reyfman PA, et al. Single-Cell Transcriptomic Analysis of Human Lung Provides Insights into the Pathobiology of Pulmonary Fibrosis. Am. J. Respir. Crit. Care Med. 2019;199:1517–1536. doi: 10.1164/rccm.201712-2410OC. - DOI - PMC - PubMed
    1. Valenzi E, et al. Single-cell analysis reveals fibroblast heterogeneity and myofibroblasts in systemic sclerosis-associated interstitial lung disease. Ann. Rheum. Dis. 2019;78:1379–1387. doi: 10.1136/annrheumdis-2018-214865. - DOI - PMC - PubMed
    1. Tsukui T, et al. Collagen-producing lung cell atlas identifies multiple subsets with distinct localization and relevance to fibrosis. Nat. Commun. 2020;11:1920. doi: 10.1038/s41467-020-15647-5. - DOI - PMC - PubMed

Substances