

CT whole lung radiomic nomogram: a potential biomarker for lung function evaluation and identification of COPD
- PMID: 38374260
- PMCID: PMC10877876
- DOI: 10.1186/s40779-024-00516-9
CT whole lung radiomic nomogram: a potential biomarker for lung function evaluation and identification of COPD
Abstract
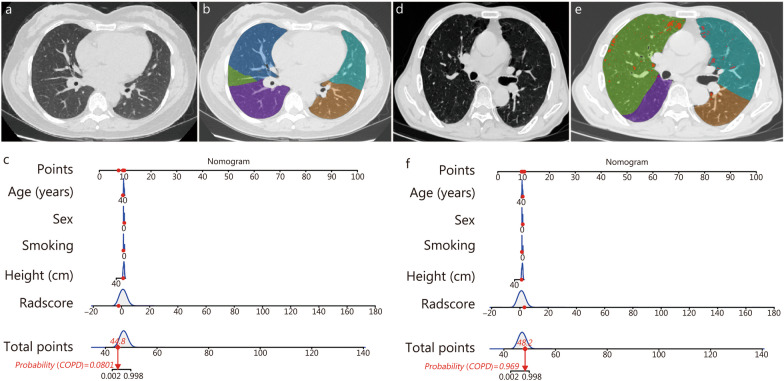
Background: Computed tomography (CT) plays a great role in characterizing and quantifying changes in lung structure and function of chronic obstructive pulmonary disease (COPD). This study aimed to explore the performance of CT-based whole lung radiomic in discriminating COPD patients and non-COPD patients.
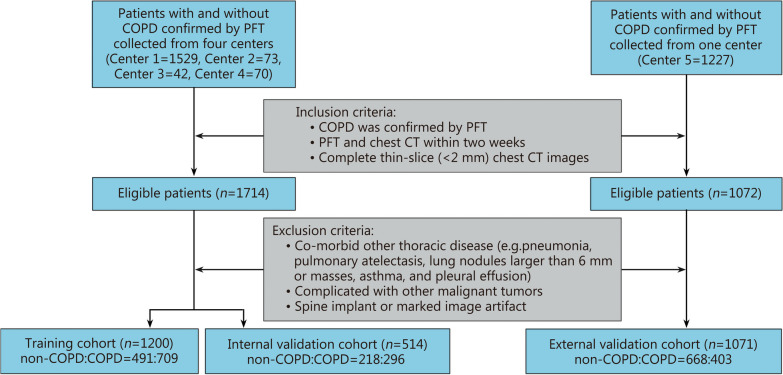
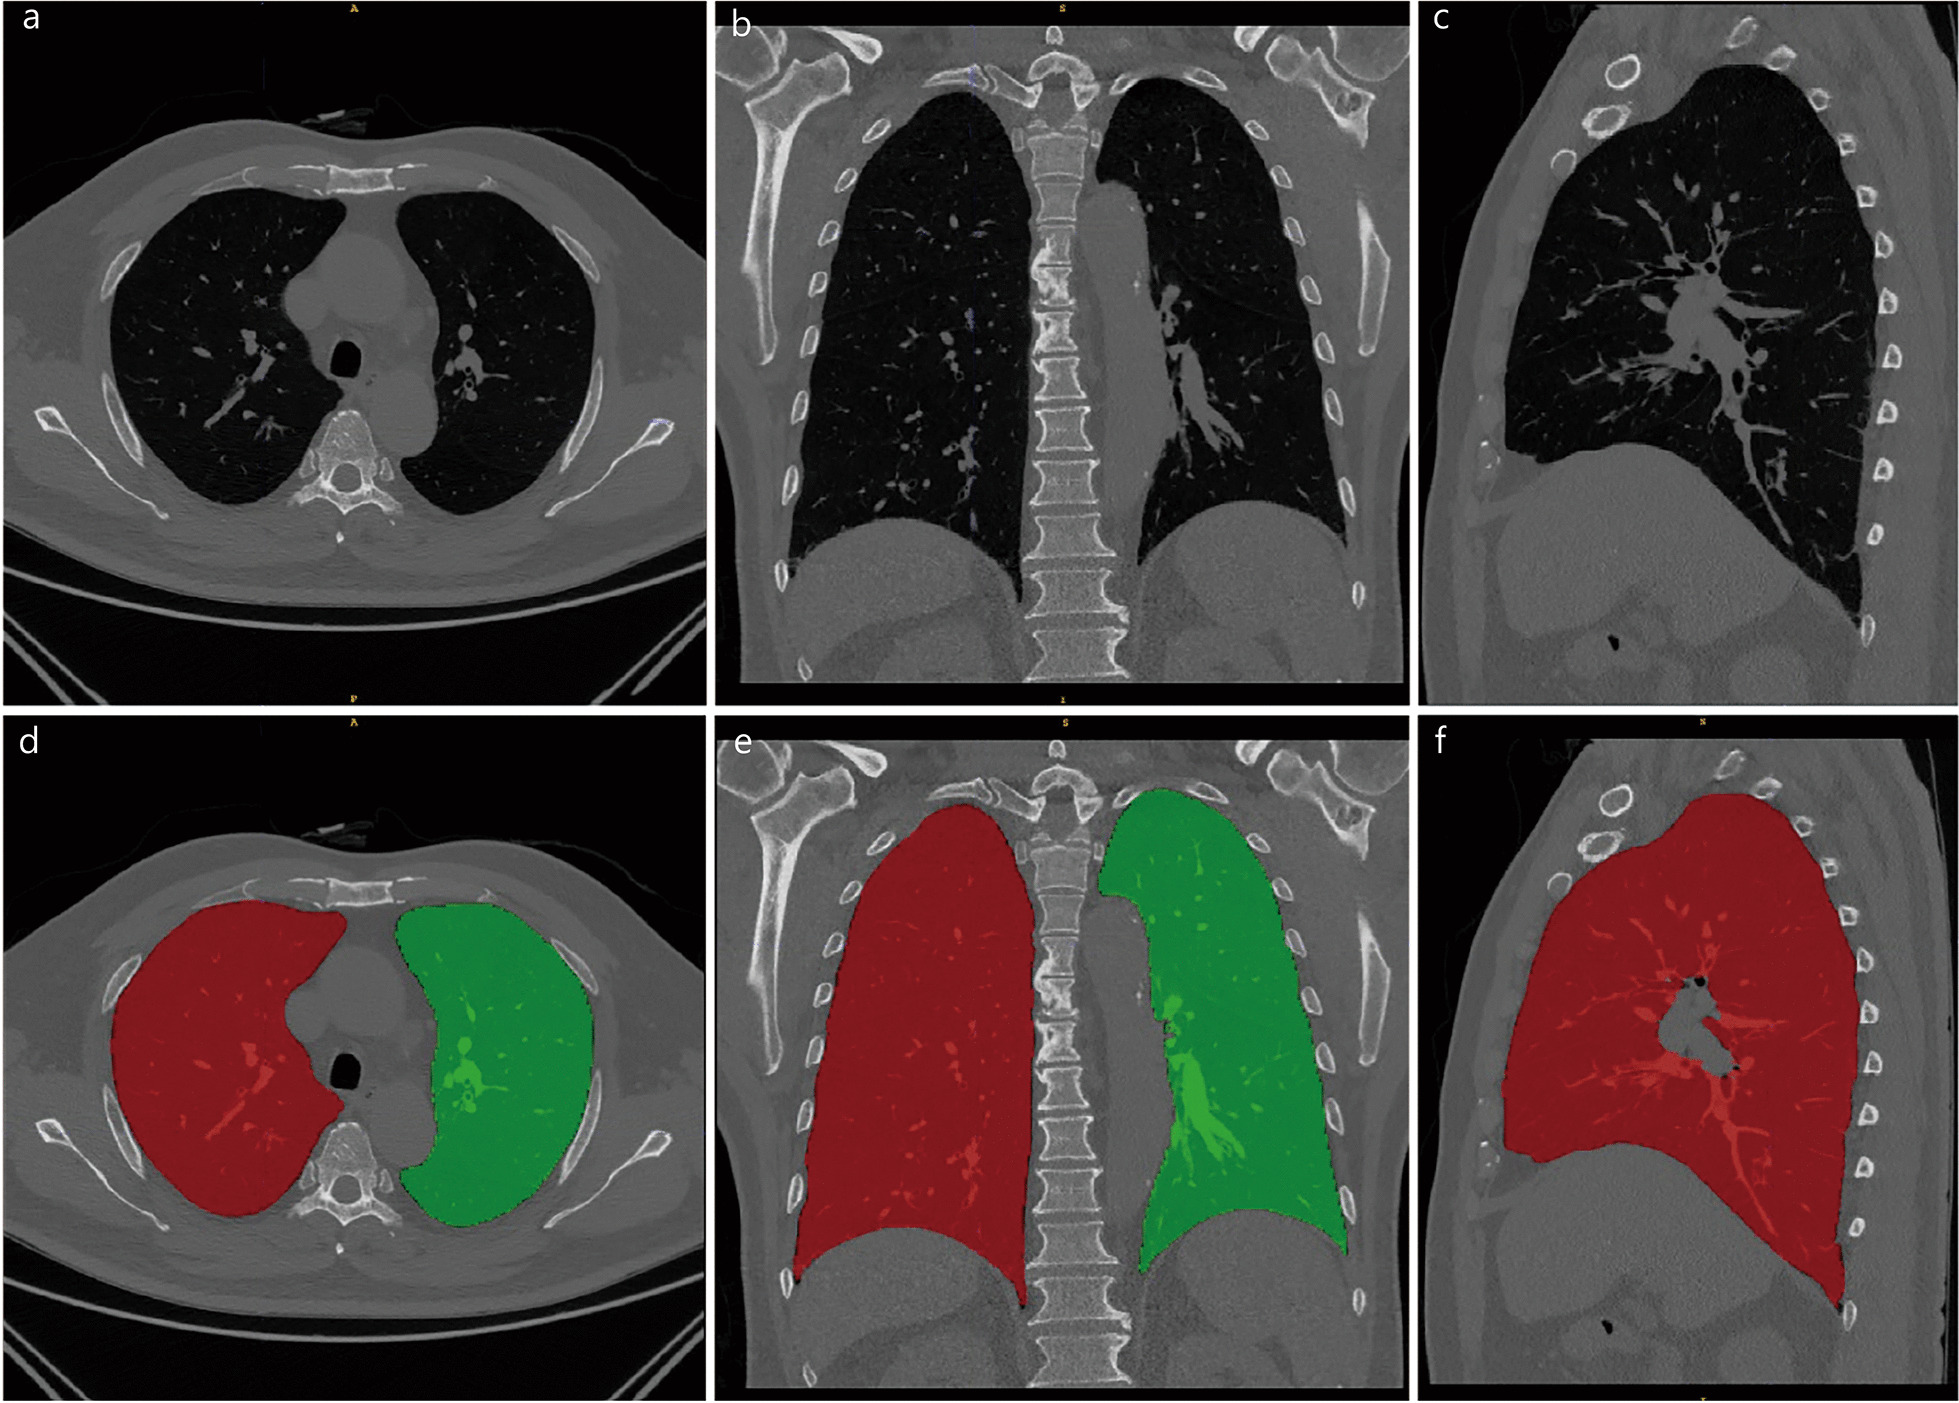
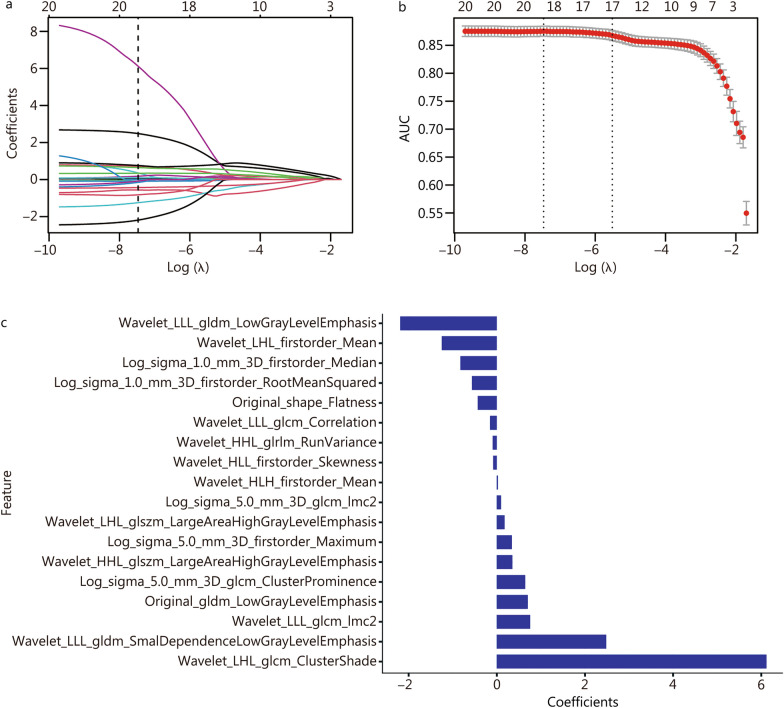
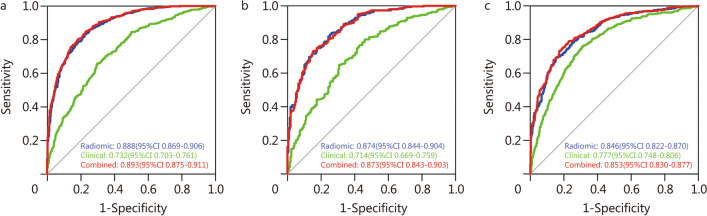
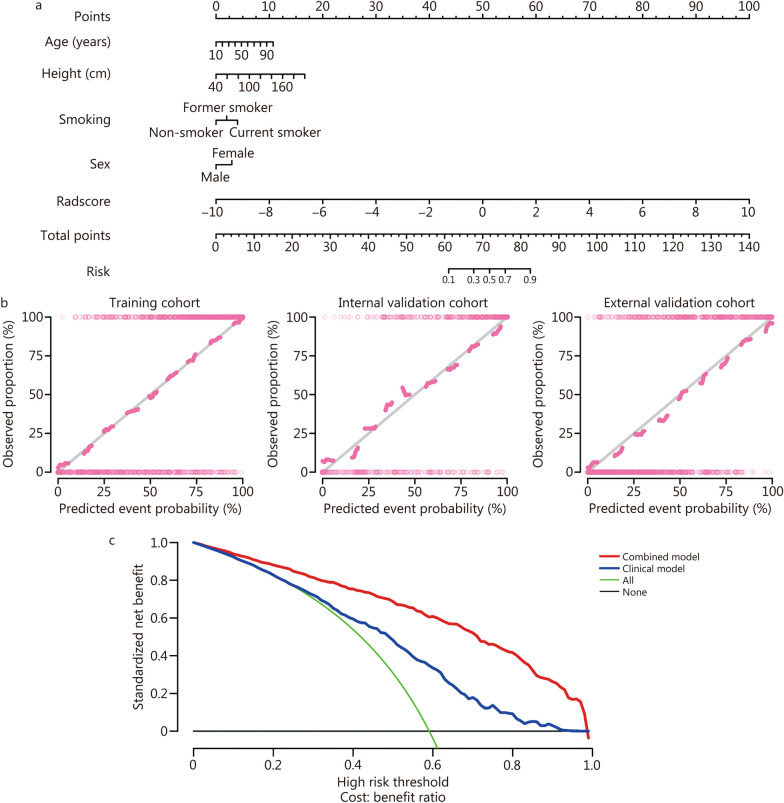
Methods: This retrospective study was performed on 2785 patients who underwent pulmonary function examination in 5 hospitals and were divided into non-COPD group and COPD group. The radiomic features of the whole lung volume were extracted. Least absolute shrinkage and selection operator (LASSO) logistic regression was applied for feature selection and radiomic signature construction. A radiomic nomogram was established by combining the radiomic score and clinical factors. Receiver operating characteristic (ROC) curve analysis and decision curve analysis (DCA) were used to evaluate the predictive performance of the radiomic nomogram in the training, internal validation, and independent external validation cohorts.
Results: Eighteen radiomic features were collected from the whole lung volume to construct a radiomic model. The area under the curve (AUC) of the radiomic model in the training, internal, and independent external validation cohorts were 0.888 [95% confidence interval (CI) 0.869-0.906], 0.874 (95%CI 0.844-0.904) and 0.846 (95%CI 0.822-0.870), respectively. All were higher than the clinical model (AUC were 0.732, 0.714, and 0.777, respectively, P < 0.001). DCA demonstrated that the nomogram constructed by combining radiomic score, age, sex, height, and smoking status was superior to the clinical factor model.
Conclusions: The intuitive nomogram constructed by CT-based whole-lung radiomic has shown good performance and high accuracy in identifying COPD in this multicenter study.
Keywords: Chronic obstructive pulmonary disease (COPD); Computed tomography (CT); Radiomic.
© 2024. The Author(s).
Conflict of interest statement
The authors declare that they have no competing interests.
Figures
Similar articles
-
CT-Based radiomics nomogram of lung and mediastinal features to identify cardiovascular disease in chronic obstructive pulmonary disease: a multicenter study.BMC Pulm Med. 2025 Mar 15;25(1):121. doi: 10.1186/s12890-025-03568-2. BMC Pulm Med. 2025. PMID: 40089791 Free PMC article.
-
CT-based whole lung radiomics nomogram: a tool for identifying the risk of cardiovascular disease in patients with chronic obstructive pulmonary disease.Eur Radiol. 2024 Aug;34(8):4852-4863. doi: 10.1007/s00330-023-10502-9. Epub 2024 Jan 12. Eur Radiol. 2024. PMID: 38216755
-
CT-Based Radiomic Nomogram for the Prediction of Chronic Obstructive Pulmonary Disease in Patients with Lung cancer.Acad Radiol. 2023 Dec;30(12):2894-2903. doi: 10.1016/j.acra.2023.03.021. Epub 2023 Apr 14. Acad Radiol. 2023. PMID: 37062629
-
[Application of artificial intelligence in combination with CT radiomics in chronic obstructive pulmonary disease].Zhonghua Jie He He Hu Xi Za Zhi. 2025 Feb 12;48(2):186-190. doi: 10.3760/cma.j.cn112147-20240830-00517. Zhonghua Jie He He Hu Xi Za Zhi. 2025. PMID: 39914847 Review. Chinese.
-
Construction and evaluation of a predictive model for radiation-induced lung injury in lung cancer: a meta-analysis.Am J Transl Res. 2025 Feb 15;17(2):722-735. doi: 10.62347/CCZZ3986. eCollection 2025. Am J Transl Res. 2025. PMID: 40092119 Free PMC article. Review.
Cited by
-
A clinical-radiomics nomogram based on automated segmentation of chest CT to discriminate PRISm and COPD patients.Eur J Radiol Open. 2024 Jun 14;13:100580. doi: 10.1016/j.ejro.2024.100580. eCollection 2024 Dec. Eur J Radiol Open. 2024. PMID: 38989052 Free PMC article.
-
Preserved ratio impaired spirometry: clinical, imaging and artificial intelligence perspective.J Thorac Dis. 2025 Jan 24;17(1):450-460. doi: 10.21037/jtd-24-1582. Epub 2025 Jan 22. J Thorac Dis. 2025. PMID: 39975722 Free PMC article. Review.
-
Utility of diaphragm dome height as a marker of operational lung volume changes, disease burden and exacerbations in patients with mild-to-moderate COPD: an observational study within the CanCOLD cohort.ERJ Open Res. 2025 Jun 30;11(3):01042-2024. doi: 10.1183/23120541.01042-2024. eCollection 2025 May. ERJ Open Res. 2025. PMID: 40589904 Free PMC article.
-
Development of a machine learning-based predictive model for transitional cell carcinoma of the renal pelvis in White Americans: a SEER-based study.Transl Androl Urol. 2024 Dec 31;13(12):2681-2693. doi: 10.21037/tau-24-385. Epub 2024 Dec 28. Transl Androl Urol. 2024. PMID: 39816222 Free PMC article.
-
Quantitative computed tomography assessment of pulmonary function and compensation after lobectomy and segmentectomy in lung cancer patients.J Thorac Dis. 2024 Sep 30;16(9):5765-5778. doi: 10.21037/jtd-24-492. Epub 2024 Sep 6. J Thorac Dis. 2024. PMID: 39444877 Free PMC article.
References
-
- Tong H, Cong S, Fang LW, Fan J, Wang N, Zhao QQ, et al. Performance of pulmonary function test in people aged 40 years and above in China, 2019–2020. Zhonghua Liu Xing Bing Xue Za Zhi. 2023;44(5):727–734. - PubMed
-
- GOLD Global initiative for chronic obstructive lung disease—global strategy for the diagnosis, management, and prevention of chronic obstructive pulmonary disease: 2023 report 2023. Available from: https://goldcopd.org/wp-content/uploads/2023/03/GOLD-2023-ver-1.3-17Feb2....
Publication types
MeSH terms
Substances
Grants and funding
- 82171926/National Natural Science Foundation of China
- 81930049/National Natural Science Foundation of China
- 82202140/National Natural Science Foundation of China
- 2022YFC2010002/National Key R&D Program of China
- 2022YFC2010000/National Key R&D Program of China
- 2022YFC2010005/National Key R&D Program of China
- YXFSC2022JJSJ002/Medical imaging database construction program of National Health Comission
- 2020YLCYJ-Y24/clinical Innovative Project of Shanghai Changzheng Hospital
- 21DZ2202600/program of Science and Technology Commission of Shanghai Municipality
- 20YF1449000/Shanghai Sailing Program
LinkOut - more resources
Full Text Sources
Medical
