. 2024 Mar;21(3):423-434.
doi: 10.1038/s41592-024-02181-1. Epub 2024 Feb 19.

TREX reveals proteins that bind to specific RNA regions in living cells

Affiliations

TREX reveals proteins that bind to specific RNA regions in living cells

Martin Dodel et al. Nat Methods. 2024 Mar.

Abstract

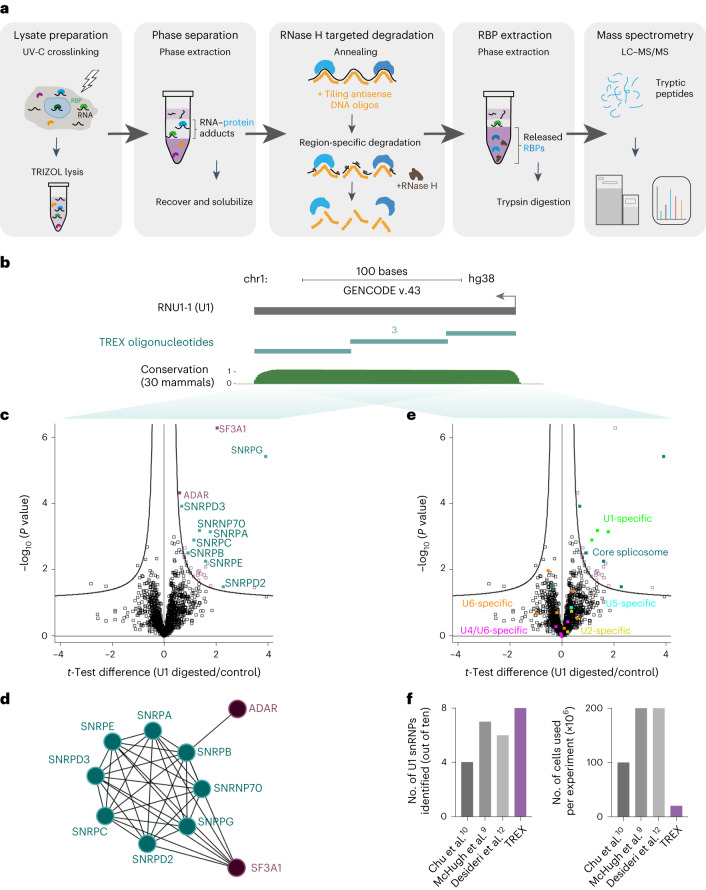
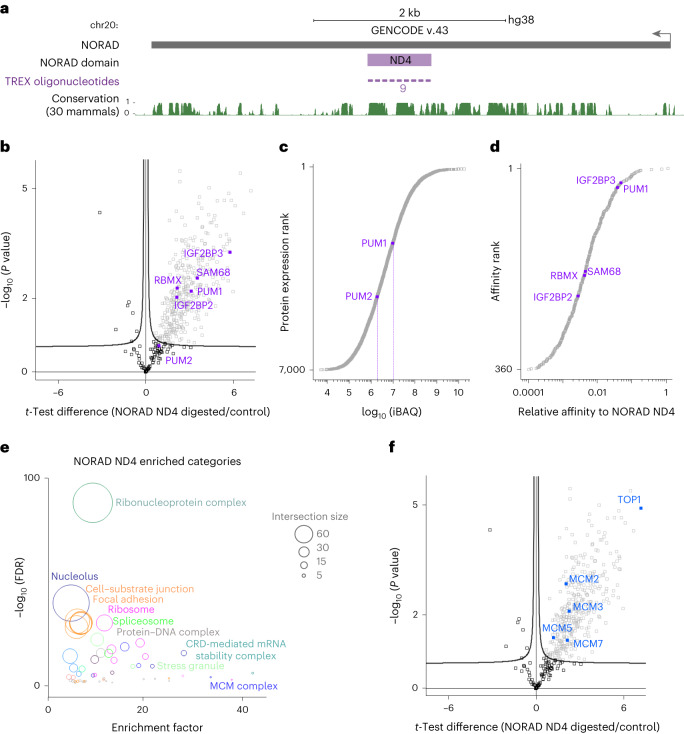
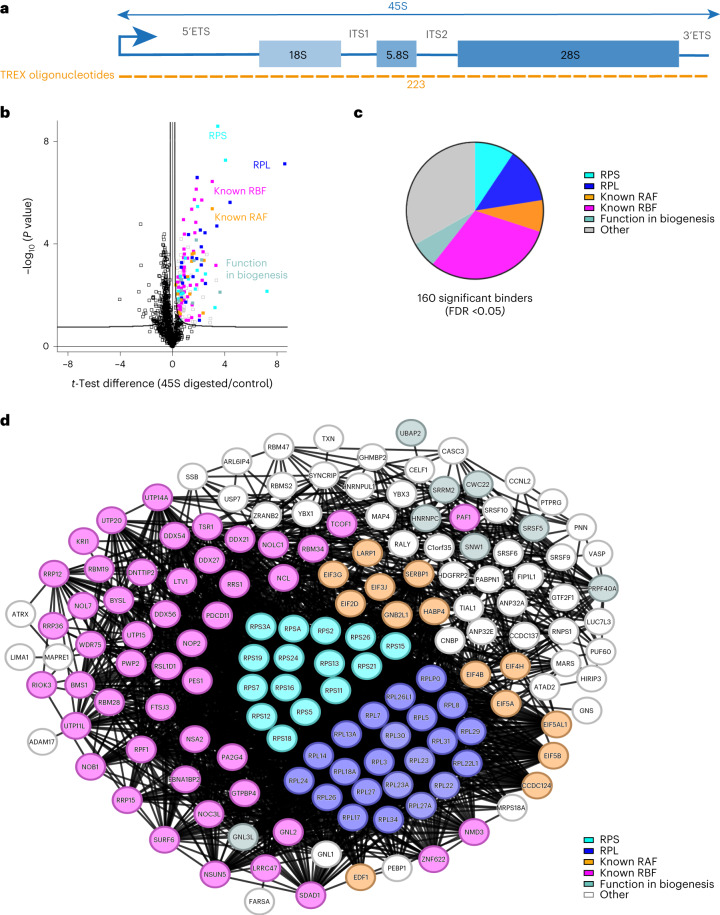
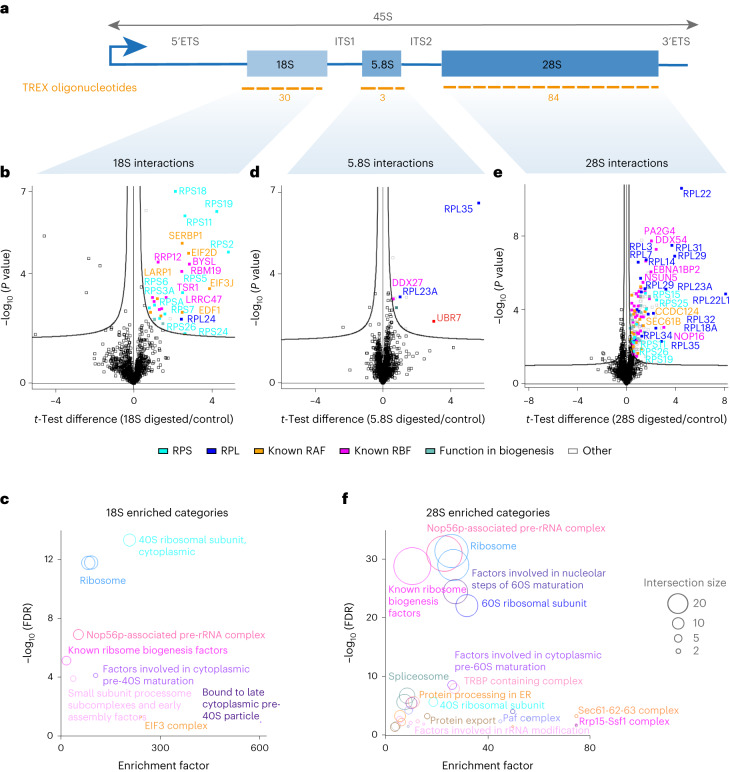
Different regions of RNA molecules can often engage in specific interactions with distinct RNA-binding proteins (RBPs), giving rise to diverse modalities of RNA regulation and function. However, there are currently no methods for unbiased identification of RBPs that interact with specific RNA regions in living cells and under endogenous settings. Here we introduce TREX (targeted RNase H-mediated extraction of crosslinked RBPs)-a highly sensitive approach for identifying proteins that directly bind to specific RNA regions in living cells. We demonstrate that TREX outperforms existing methods in identifying known interactors of U1 snRNA, and reveals endogenous region-specific interactors of NORAD long noncoding RNA. Using TREX, we generated a comprehensive region-by-region interactome for 45S rRNA, uncovering both established and previously unknown interactions that regulate ribosome biogenesis. With its applicability to different cell types, TREX is an RNA-centric tool for unbiased positional mapping of endogenous RNA-protein interactions in living cells.


Conflict of interest statement

F.K.M., L.S., M. Dermit, G.G. and M. Dodel are inventors and contributors on a pending patent covering the TREX method. The other authors declare no competing interests.

Figures

Fig. 1
Fig. 1. TREX reveals proteins that bind to specific RNA sequences in living cells.
a, Experimental scheme of TREX. b, Schematic representation of U1 snRNA primary sequence (annotated as RNU1-1 in RefSeq) with the associated University of California Santa Cruz (UCSC) Genome Browser tracks for mammalian conservation (PhastCons). The tiling antisense DNA oligonucleotides used for depletion of U1 snRNA in TREX (three in total) are depicted on the tracks. Scale, 100 bases. chr, chromosome. c, Volcano plot of the two-sided two-sample t-test comparison of U1 digested versus undigested TREX samples (n = 5 biological replicates), showing significant enrichment of the U1 snRNP complex members, along with SF3A1 and ADAR in the digested samples. Curved lines mark the significance boundary (FDR = 0.05, S0 = 0.1). d, Interaction network analysis of U1-bound proteins identified by TREX, using the STRING physical interactions database. e, Volcano plot of the two-sided two-sample t-test comparison of U1 digested versus undigested TREX samples (n = 5 biological replicates), with marking the core spliceosome as well as each identified specific U1 snRNP complex protein members. Only U1-specific proteins, as well as the core spliceosome components, are found as significantly enriched in the U1 digested TREX samples. Curved lines mark the significance boundary (FDR = 0.05, S0 = 0.1). f, Comparison of the number of cells used per experiment, against the number of known U1 snRNP proteins identified, in TREX versus three previous U1 RNA affinity capture–MS studies,,.
Fig. 2
Fig. 2. TREX defines proteins that bind to the ND4 segment of NORAD lncRNA.
a, Schematic representation of NORAD lncRNA primary sequence and its ND4 segment, with the associated UCSC Genome Browser tracks for mammalian conservation (PhastCons). The tiling antisense DNA oligonucleotides used for depletion in TREX (nine in total) are depicted on the tracks. Scale, 2 kb. b, Volcano plot of the two-sided two-sample t-test comparison of NORAD ND4 digested versus undigested TREX samples (n = 3 biological replicates), showing the enrichment of several known RBP interactors of NORAD (purple) in the digested samples. Curved lines mark the significance boundary (FDR = 0.05, S0 = 0.1). While PUM1 is a highly significant interactor, PUM2 falls just below significant cut-off. c, The ranked plot of the iBAQ absolute protein abundance measurements from the total proteome of HCT116, revealing PUM1 to be expressed at amounts more than fivefold that of PUM2. d, The ranked plot of the iBAQ-based estimated relative affinities of the TREX-identified NORAD ND4 interactors, with several known RBP binding partners of NORAD marked on the graph (purple). e, Fisherʼs exact test analysis of known protein categories that are over-represented among the NORAD interacting proteins (Benjamini–Hochberg FDR < 0.05). Each circle represents an enriched category from the Gene Ontology Cellular Compartments (GOCC) database, with circle size representing the number of shared proteins. f, Volcano plot of the two-sided two-sample t-test comparison of NORAD ND4 digested versus undigested TREX samples (n = 3 biological replicates), with TOP1 and members of the MCM helicase complex highlighted. Curved lines mark the significance boundary (FDR = 0.05, S0 = 0.1).
Fig. 3
Fig. 3. TREX captures the compendium of proteins that bind to the 45S rRNA.
a, Schematic representation of 45S rRNA primary sequence and its various segments. The tiling antisense DNA oligonucleotides used for depletion in TREX (223 in total) are depicted on the graph. b, Volcano plot of the two-sided two-sample t-test comparison of 45S rRNA digested versus undigested TREX samples (n = 4 biological replicates), showing the enrichment of RPS (cyan) and RPL (blue) proteins, known RBFs (purple) and known RAFs (orange), as well as previously unknown interactors suspected of involvement in human ribosome biogenesis based on the impact of their depletion (teal). Curved lines mark the significance boundary (FDR = 0.05, S0 = 0.1). c, Pie diagram of the composition of proteins identified in the 45S rRNA TREX. Proteins are color-coded as described in b. d, Interaction network analysis of 45S-bound proteins identified by TREX, using the STRING physical interactions database. Proteins are color-coded as described in b.
Fig. 4
Fig. 4. TREX defines the interactomes of 18S, 5.8S and 28S rRNA.
a, Schematic representation of the 18S, 5.8S and 28S segments within the 45S rRNA. The tiling antisense DNA oligonucleotides used for depletion of each segment in each set of TREX experiments are depicted on the graph. b, Volcano plot of the two-sided two-sample t-test comparison of 18S rRNA digested versus undigested TREX samples (n = 4 biological replicates), showing the enrichment of RPS proteins, known small subunit RAFs and known small subunit processing RBFs, as well as RPL24. c, Fisherʼs exact test analysis of known protein categories that are over-represented among the 18S interactors (Benjamini–Hochberg FDR < 0.05). Each circle represents an enriched category extracted from Dorner et al. or the Kyoto Encyclopedia of Genes and Genomes (KEGG) database, with circle size representing the number of shared proteins. d, Volcano plot of the two-sided two-sample t-test comparison of 5.8S rRNA digested versus undigested TREX samples (n = 5 biological replicates), showing the enrichment of DDX27, RPL23A, RPL35 and UBR7. e, Volcano plot of the two-sided two-sample t-test comparison of 28S rRNA digested versus undigested TREX samples (n = 5 biological replicates), showing the enrichment of RPL proteins, known large subunit RAFs and known large subunit processing RBFs, as well as RPS11, RPS15, RPS19, RPS25 and RPS26. Curved lines in all volcano plots mark the significance boundary (FDR = 0.05, S0 = 0.1). f, Fisherʼs exact test analysis of known protein categories that are over-represented among the 28S interactors (Benjamini–Hochberg FDR < 0.05). Each circle represents an enriched category extracted from Dorner et al. or the KEGG database, with circle size representing the number of shared proteins. ER, endoplasmic reticulum.
Fig. 5
Fig. 5. TREX defines the interactomes of 5′-ETS, ITS1, ITS2 and 3′-ETS spacer regions.
a, Schematic representation of the 5′-ETS, ITS1, ITS2 and 3′-ETS segments within the 45S rRNA. The tiling antisense DNA oligonucleotides used for depletion of each segment are depicted on the graph. b, Volcano plot of the two-sided two-sample t-test comparison of 5′-ETS digested versus undigested TREX samples (n = 5 biological replicates) showing the prominent enrichment of several known early processing RBFs, along with RPS9, RPS25 and RPL23A. c, Fisher’s exact test analysis of known protein categories that are over-represented among the 5′-ETS-interacting proteins (Benjamini–Hochberg FDR < 0.05). Each circle represents an enriched category extracted from Dorner et al. or the KEGG database, with circle size representing the number of shared proteins. d, Volcano plot of the two-sided two-sample t-test comparison of ITS1 digested versus undigested TREX samples (n = 5 biological replicates), showing the enrichment of various RBFs, RPS17, RPS25 and RPP25L. e, Fisher’s exact test analysis of known protein categories that are over-represented among the ITS1 interacting proteins (Benjamini–Hochberg FDR < 0.05). Each circle represents an enriched category extracted from Dorner et al. or the KEGG database, with circle size representing the number of shared proteins. f, Volcano plot of the two-sided two-sample t-test comparison of ITS2 digested versus undigested TREX samples (n = four biological replicates), showing the enrichment of several known RBFs, RPS17 and RPL23A. g, Fisher’s exact test analysis of known protein categories that are over-represented among the ITS2 interacting proteins (Benjamini–Hochberg FDR < 0.05). Each circle represents an enriched category extracted from Dorner et al. or the KEGG database, with circle size representing the number of shared proteins. h, Volcano plot of the two-sided two-sample t-test comparison of 3′-ETS digested versus undigested TREX samples (n = 4 biological replicates), showing the enrichment of EXOSC4 and several known RBFs, along with RPS17, RPS25, RPL23A and RPL17. Curved lines in all volcano plots mark the significance boundary (FDR = 0.05, S0 = 0.1). i, Fisher’s exact test analysis of known protein categories that are over-represented among the 3′-ETS-interacting proteins (Benjamini–Hochberg FDR < 0.05). Each circle represents an enriched category extracted from Dorner et al. or the KEGG database, with circle size reflecting the number of shared proteins.
Fig. 6
Fig. 6. TREX reveals region-specific and multiregional interactors of 45S rRNA.
a, Unsupervised hierarchical clustering analysis of t-scores for significant hits from TREX analyses of different segments of 45S rRNA, with complete Euclidean distance calculation and K-means preprocessing (t-score color scale, black, 0 or less; red, 2–6; orange, 6–10; yellow, 10 or more). b, Zoomed-in view of cluster 9 and the list of its constituent proteins. c, Fisher’s exact test analysis of known protein categories that are over-represented among the cluster 9 proteins (Benjamini–Hochberg FDR < 0.05). Each circle represents an enriched category extracted from Dorner et al. or the KEGG database, with circle size representing the number of shared proteins. d, Overlap analysis of cluster 9 proteins with lists of known RBFs from ref. and hits from three large-scale RNAi screens of human ribosome biogenesis regulators. Proteins with reported localization to the nucleolus, either as primary or as an additional site of localization, according to the Human Protein Atlas, are also marked on the graph.
Extended Data Fig. 1
Extended Data Fig. 1. Validation of TREX parameters.
(a) Confirmation of the solubilization of intact RNA-protein adducts from the interface of crosslinked HCT116 cells. UV-C crosslinked HCT116 cells were lysed in TRIZOL and subjected to organic phase separation to isolate RNA-protein adducts in the interface (INT). The Interface pellets were subsequently solubilized according to the TREX protocol (SOL), before treatment with or without proteinase-K to remove the crosslinked proteins. The mixtures were then subjected to standard TRIZOL-based RNA extraction. Equal volumes from equivalent starting amounts for each INT or SOL sample, with or without proteinase K treatment, were quantified for RNA content using Nanodrop. Interface primarily contains protein-bound RNA, since the majority of RNA is only recoverable after proteinase K digestion. More than half of this protein-bound RNA is solubilized by the TREX resolubilization protocol. (b) Analysis of the integrity of the recovered RNA from (a) by capillary electrophoresis. Equal volumes from equal starting amounts for each INT or SOL sample, with or without proteinase K treatment, were resolved by capillary electrophoresis using Tapestation. The solubilized protein-bound RNAs are largely intact, as judged by visualization of full-length 28S and 18S rRNA bands. (c) Assessment of the RNase H-mediated degradation of U1 snRNA in solubilized interface fractions, by dose-dependent addition of tiling antisense DNA oligonucleotides. Solubilized protein-bound RNAs from the interface of phase separated UV-C-treated HCT116 cells were heat denatured and annealed to increasing concentrations of a pool of tiling DNA oligonucleotides complementary to the U1 sequence. The annealed interface samples were treated with RNase H to degrade the hybridized RNAs. The remaining amount of U1 snRNA in each sample was then quantified by RT-qPCR, using specific probes against U1. As input control, probes against RPS18 and GAPDH were used, and the U1 levels relative to the two controls were determined using the ΔCt method. Data are presented as mean −/+ range (n = 2 biological replicates). (d) Assessment of the RNase H-mediated degradation of NORAD lncRNA in solubilized interface fractions, by dose-dependent addition of tiling antisense DNA oligonucleotides. Solubilized protein-bound RNAs from the interface of phase separated UV-C-treated HCT116 cells were heat denatured and annealed to increasing concentrations of a pool of tiling DNA oligonucleotides complementary to the NORAD ND4 segment. The annealed interface samples were then treated with RNase H to degrade the hybridized RNAs. The remaining amount of NORAD ND4 segment in each sample was quantified by RT-qPCR, using specific probes against this section of NORAD. As an internal control, probes against the 5′ end of NORAD were used, and the NORAD ND4 levels relative to its 5′ end region were determined using the ΔCt method. (e) Assessment of the RNase H-mediated degradation of 18S rRNA in solubilized interface fractions, by dose-dependent addition of tiling antisense DNA oligonucleotides. Solubilized protein-bound RNAs from the interface of phase separated UV-C-treated HCT116 cells were heat denatured and annealed to increasing concentrations of a pool of tiling DNA oligonucleotides complementary to the 18S sequence. The annealed interface samples were then treated with RNase H to degrade the hybridized RNAs. The amount of 18S in each sample was quantified by RT-qPCR, using specific PCR probes against 18S. As an internal control, probes against 28S rRNA were used, and 18S levels relative to the 28S were determined using the ΔCt method. Data are presented as mean -/+ range (n = 2 biological replicates). (f) Assessment of the RNase H-mediated degradation of 5'ETS region of pre-rRNA in solubilized interface fractions, by dose-dependent addition of tiling antisense DNA oligonucleotides. Solubilized protein-bound RNAs from the interface of phase separated UV-C-treated HCT116 cells were heat denatured and annealed to increasing concentrations of a pool of tiling DNA oligonucleotides complementary to the 5'ETS sequence. The annealed interface samples were then treated with RNase H to degrade the hybridized RNAs. The amount of 5′ETS pre-rRNA in each sample was quantified by RT-qPCR, using specific PCR probes against 5′ETS. As an internal control, probes against 18S rRNA were used, and 5′ETS levels relative to the 18S were determined using the ΔCt method. Data are presented as mean −/+ range (n = 2 biological replicates). (g) Analysis of depletion efficiency in the RNase H-treated vs. untreated samples of the U1 TREX experiment (related to Fig. 1c). Total RNA was extracted from aliquots of RNase H treated and untreated TREX samples, and was subjected to RT-qPCR analysis using specific probes against U1. As input control, probes against RPS18 and GAPDH were used, and U1 levels relative to the two controls were determined in each sample using the ΔCt method. RNAse H treatment results in near complete U1 removal. Data are presented as mean −/+ SD (n = 5 biological replicates). (h) Analysis of depletion specificity in the RNase H-treated vs. untreated samples of the U1 TREX experiment (related to Fig. 1c). Total extracted RNA from (g) was analyzed by whole-transcriptome RNA-seq to reveal differences following RNase H treatment. Median TPM values for RNase H treated and untreated samples were plotted against each other, with significant outliers identified using the multi-dimensional outlier test from Perseus. Several transcript variants of U1, followed by SNORA74A and B, were the only significantly degraded transcripts detected. (i) Principal component analysis (PCA) of the LFQ values from the proteomics analysis of RNase H treated (red) and untreated (black) U1 TREX samples. Five biological replicates per condition were analyzed.
Extended Data Fig. 2
Extended Data Fig. 2. Analysis of NORAD by TREX.
(a) Analysis of depletion efficiency in the RNase H-treated vs. untreated samples of the NORAD ND4 TREX experiment (related to Fig. 2b). Total RNA was extracted from aliquots of RNase H treated and untreated TREX samples, and was subjected to RT-qPCR analysis using specific probes against the NORAD ND4 domain. As input control, probes against RPS18 and GAPDH were used, and NORAD ND4 levels relative to the two controls were determined in each sample using the ΔCt method. RNAse H treatment results in near complete degradation of NORAD ND4 segment. Data are presented as mean −/+ SD (n = 4 biological replicates). (b) Analysis of the depletion region-specificity in the NORAD ND4 TREX samples (related to Fig. 2b). The total RNA extracted from NORAD ND4 TREX samples in (a) was subjected to RT-qPCR analysis using specific probes against the 5′ end segment of NORAD. As input control, probes against RPS18 and GAPDH were used, and the levels NORAD 5′ region relative to the two controls were determined in each sample using the ΔCt method. RNAse H treatment does not degrade the 5′ end segment of NORAD. Data are presented as mean −/+ SD (n = 4 biological replicates). (c) PCA of the LFQ values from the proteomics analysis of RNase H treated (red) and untreated (black) NORAD ND4 TREX samples. Four biological replicates per condition were analyzed. RNase H-treated sample 1 is an outlier and groups much more closely with the untreated samples, suggesting experiment failure. (d) GOCC analysis of the primary subcellular location associated with the significant hits from NORAD ND4 TREX. While 49.7% of the hits were annotated as belonging to the ‘cytoplasmic part’ category of GOCC, 50.3% were annotated as belonging to the ‘nuclear part’ category. (e) Venn diagram of the overlap between the lists of NORAD ND4 hits identified by TREX, and four previous NORAD interactome capture studies (Lee et al.; Munschauer et al.; Spiniello et al.; Tichon et al.). A highly significant overlap, calculated using Fisher’s exact test with Benjamini-Hochberg FDR estimation, was detected in each comparison. The exact number of overlapping vs. non-overlapping proteins in each comparison, as well as the Fisher’s exact test FDR values, are depicted on the Venn diagrams. (f) Western blot analysis of HCT116 input lysates, as well as immunoprecipitates (IPs) from non-specific rabbit IgG, PUM1, and RBMX CLIP analyses. Samples were resolved by SDS-PAGE, and analyzed by immunoblotting with the indicated antibodies, showing specific enrichment of each bait protein. The results are representative of 3 independent experiments. (g) RT-qPCR analysis of PUM1 and IgG control CLIP samples from HCT116 cells, showing specific enrichment of NORAD ND4 region, but not U1 RNA, in PUM1 IPs. CLIP enrichments are presented as % of input RNA, and normalized relative to IgG control average. Data are presented as mean −/+ SD (n = 3 biological replicates). P-values were calculated using an unpaired one-tailed t-test (n.s.: not significant). (h) RT-qPCR analysis of RBMX and IgG control CLIP samples from HCT116 cells, showing specific enrichment of NORAD ND4 region, but not U1 RNA, in RBMX IPs. CLIP enrichments are presented as % of input RNA, and normalized relative to IgG control average. Data are presented as mean −/+ SD (n = 3 biological replicates). P-values were calculated using an unpaired one-tailed t-test (n.s.: not significant). (i) Western blot analysis of HCT116 input lysates, as well as IPs from non-specific rabbit IgG and TOP1 CLIP analyses. Samples were resolved by SDS-PAGE, and analyzed by immunoblotting with the indicated antibodies, showing specific enrichment of TOP1. The results are representative of 4 independent experiments. (j) RT-qPCR analysis of TOP1 and IgG control CLIP samples from HCT116 cells, showing specific enrichment of NORAD ND4 region, but not U1 RNA, in TOP1 IPs. CLIP enrichments are presented as % of input RNA, and normalized relative to IgG control average. Data are presented as mean −/+ SD (n = 4 biological replicates). P-values were calculated using an unpaired one-tailed t-test (n.s.: not significant). Source data
Extended Data Fig. 3
Extended Data Fig. 3. Analysis of 45S by TREX.
(a) Analysis of depletion efficiency in the RNase H-treated vs. untreated samples of the 45S rRNA TREX experiment (related to Fig. 3b). Total RNA was extracted from aliquots of RNase H treated and untreated TREX samples, and was subjected to RT-qPCR analysis using specific probes against two segments of 45S rRNA. As input control, probes against RPS18 and GAPDH were used, and 45S rRNA levels relative to the two controls were determined in each sample using the ΔCt method. RNase H treatment results in near complete degradation of 45S rRNA. Data are presented as mean −/+ SD (n = 4 biological replicates). (b) Analysis of depletion specificity in the RNase H-treated vs. untreated samples of the 45S TREX experiment (related to Fig. 3b). Total extracted RNA from (a) was analyzed by whole-transcriptome RNA-seq to reveal differences in the transcriptome following RNase H treatment. Median TPM values for RNase H treated and untreated samples were plotted against each other, with significant outliers identified using the multi-dimensional outlier test from Perseus. The only significant RNase H-degraded transcript detected was that of RPS26P58 pseudogene (Note that 45S rRNA itself is not detectable in this assay due to the ribo-depletion procedure used in library preparation). (c) PCA of the LFQ values from the proteomics analysis of RNase H treated (red) and untreated (black) 45S rRNA TREX samples. Four biological replicates per condition were analyzed.
Extended Data Fig. 4
Extended Data Fig. 4. Analysis of 18S, 5.8S, and 28S rRNA interactomes by TREX.
(a) Analysis of depletion efficiency in the RNase H-treated vs. untreated samples of the 18S rRNA TREX experiment (related to Fig. 4b). Total RNA was extracted from aliquots of RNase H treated and untreated TREX samples, and was subjected to RT-qPCR analysis using specific probes against the 18S segment of 45S rRNA. As input control, probes against RPS18 and GAPDH were used, and 18S rRNA levels relative to the two controls were determined in each sample using the ΔCt method. RNase H treatment results in near complete degradation of 18S rRNA. Data are presented as mean −/+ SD (n = 4 biological replicates). (b) Analysis of depletion efficiency in the RNase H-treated vs. untreated samples of the 5.8S rRNA TREX experiment (related to Fig. 4d). Total RNA was extracted from aliquots of RNase H treated and untreated TREX samples, and was subjected to RT-qPCR analysis using specific probes against the 5.8S segment of 45S rRNA. As control, probes against the 18S segment and GAPDH were used, and the relative 5.8S rRNA levels were determined in each sample using the ΔCt method. RNAse H treatment results in near complete degradation of the 5.8S segment. Data are presented as mean −/+ SD (n = 5 biological replicates). (c) Analysis of depletion efficiency in the RNase H-treated vs. untreated samples of the 28S rRNA TREX experiment (related to Fig. 4e). Total RNA was extracted from aliquots of RNase H treated and untreated TREX samples, and was subjected to RT-qPCR analysis using specific probes against the 28S segment of 45S rRNA. As control, probes against the 18S segment and GAPDH were used, and the relative 28S rRNA levels were determined in each sample using the ΔCt method. RNase H treatment results in near complete degradation of the 28S segment. Data are presented as mean −/+ SD (n = 5 biological replicates). (d) Structure of the Human 80S ribosome (PDB ID: 4UG0), visualized on PyMOL (version 2.5.4), with the 18S rRNA (yellow) and RPL24 (blue) molecules highlighted on the structure. RPL24 extends from the 60S subunit into the 40S subunit and makes extensive contacts with 18S rRNA. (e) Structure of the Human 80S ribosome (PDB ID: 4UG0), visualized on PyMOL (version 2.5.4), with the 5.8S rRNA (yellow), RPL23A (blue), and RPL35 (blue) molecules highlighted on the structure. Both RPL23A and RPL35 make extensive direct contacts with the 5.8S rRNA in the 60S subunit. (f) Western blot analysis of HCT116 input lysates, as well as immunoprecipitates (IPs) from non-specific rabbit IgG and UBR7 CLIP analyses. Samples were resolved by SDS-PAGE, and analyzed by immunoblotting with the indicated antibodies, showing specific enrichment of UBR7. The results are representative of 3 independent experiments. (g) RT-qPCR analysis of UBR7 and IgG control CLIP samples from HCT116 cells, showing specific enrichment of 5.8S rRNA, but not U1 RNA, in UBR7 IPs. A specific enrichment was also detectable with probes against the last 105 nucleotides of ITS1 that is immediately adjacent to the 5.8S region (5.8S adjacent), suggestive of UBR7 interaction with the premature 5.8S transcript. CLIP enrichments are presented as % of input RNA, and normalized relative to IgG control average. Data are presented as mean −/+ SD (n = 3 biological replicates). P-values were calculated using an unpaired one-tailed t-test (n.s.: not significant). (h) RT-qPCR analysis of ITS1, 5.8S, and ITS2 RNA levels in control vs. UBR7 depleted HCT116 cells. HCT116 cells were transfected with non-targeting control (Ctrl) or UBR7 siRNA pools (UBR7 KD) for 72 hrs, followed by total RNA extraction and RT-qPCR analysis using specific probes against the indicated rRNA segments. As control, probes against the RPS18 and GAPDH were used, and the relative RNA levels were determined using the ΔCt method. UBR7 knockdown results in a significant accumulation of ITS1 and ITS2, with concomitant reduction in 5.8S levels, indicative of a defect in 5.8S processing. Data are presented as mean −/+ SD (n = 3 biological replicates). P-values were calculated using an unpaired two-tailed t-test. (i) RT-qPCR analysis of UBR7 mRNA levels in control vs. UBR7 depleted HCT116 cells from (h). Total extracted RNA from (h) was subjected to RT-qPCR analysis using specific probes against UBR7 mRNA. As control, probes against the RPS18 and GAPDH were used, and the relative RNA levels were determined in each sample using the ΔCt method, confirming efficient siRNA-mediated knockdown of UBR7. Data are presented as mean −/+ SD (n = 3 biological replicates). (j) Structure of the Human 80S ribosome (PDB ID: 4UG0), visualized on PyMOL (version 2.5.4), with the 28S rRNA (yellow), RPS11 (cyan), RPS15 (cyan), RPS19 (cyan), RPS25 (cyan), and RPS26 (cyan) highlighted on the structure. All highlighted proteins are located close to the interface of the two ribosomal subunits. (k) Volcano plot of the two-sided two-sample t-test comparison of 28S rRNA digested vs undigested TREX samples (n = 5 biological replicates), with RPL22, RPL22L1, RPL7, and RPL7L highlighted on the graph. Curved lines mark the significance boundary (FDR = 0.05, S0 = 0.1). Both RPL22 and RPL22L1 paralogues are detected amongst the significant 28S rRNA interactors, while only RPL7 is detected as an interactor. Source data
Extended Data Fig. 5
Extended Data Fig. 5. Analysis of 5′ETS, ITS1, ITS2, and 3′ETS interactomes by TREX.
(a) Analysis of depletion efficiency in the RNase H-treated vs. untreated samples of the 5′ETS rRNA TREX experiment (related to Fig. 5b). Total RNA was extracted from aliquots of RNase H treated and untreated TREX samples, and was subjected to RT-qPCR analysis using specific probes against the 5′ETS segment of 45S rRNA. As control, probes against the 18S segment and GAPDH were used, and the relative 5′ETS rRNA levels were determined in each sample using the ΔCt method. RNAse H treatment results in near complete degradation of the 5′ETS segment. Data are presented as mean −/+ SD (n = 5 biological replicates). (b) Analysis of depletion efficiency in the RNase H-treated vs. untreated samples of the ITS1 rRNA TREX experiment (related to Fig. 5d). Total RNA was extracted from aliquots of RNase H treated and untreated TREX samples, and was subjected to RT-qPCR analysis using specific probes against the ITS1 segment of 45S rRNA. As control, probes against the 18S segment and GAPDH were used, and the relative ITS1 rRNA levels were determined in each sample using the ΔCt method. RNAse H treatment results in near complete degradation of the ITS1 segment. Data are presented as mean −/+ SD (n = 5 biological replicates). (c) Analysis of depletion efficiency in the RNase H-treated vs. untreated samples of the ITS2 rRNA TREX experiment (related to Fig. 5f). Total RNA was extracted from aliquots of RNase H treated and untreated TREX samples, and was subjected to RT-qPCR analysis using specific probes against the ITS2 segment of 45S rRNA. As control, probes against the 18S segment and GAPDH were used, and the relative ITS2 rRNA levels were determined in each sample using the ΔCt method. RNAse H treatment results in near complete degradation of the ITS2 segment. Data are presented as mean −/+ SD (n = 5 biological replicates). (d) Analysis of depletion efficiency in the RNase H-treated vs. untreated samples of the 3′ETS rRNA TREX experiment (related to Fig. 5h). Total RNA was extracted from aliquots of RNase H treated and untreated TREX samples, and was subjected to RT-qPCR analysis using specific probes against the 3′ETS segment of 45S rRNA. As control, probes against the 18S segment and GAPDH were used, and the relative 3′ETS rRNA levels were determined in each sample using the ΔCt method. RNAse H treatment results in near complete degradation of the 3′ETS segment. Data are presented as mean −/+ SD (n = 4 biological replicates). (e) Structure of the Human 80S ribosome (PDB ID: 4UG0), visualized on PyMOL (version 2.5.4), with the 5′ end of 18S rRNA (orange) and RPS9 (cyan) highlighted on the structure. RPS9 binds specifically at the 5′end of 18S. (f) The ranked plot of the iBAQ absolute protein abundance measurements from the total proteome of HCT116, revealing RPP25L to be > 20 fold more expressed than RPP25. (g) RT-qPCR analysis of RPP25L mRNA levels in control vs. RPP25L depleted HCT116 cells. HCT116 cells were transfected with non-targeting control (Ctrl) or RPP25L siRNA pools (RPP25L KD) for 72 hrs, followed by total RNA extraction and RT-qPCR analysis using specific probes against RPP25L mRNA. As control, probes against the RPS18 and GAPDH were used, and the relative RNA levels were determined in each sample using the ΔCt method. Data are presented as mean -/+ range (n = 2 biological replicates). (h) RT-qPCR analysis of 5′ETS, ITS1, and ITS2 spacer RNA levels in control vs. RPP25L depleted HCT116 cells from (g). Total RNA extracts from were subjected to RT-qPCR analysis using specific probes against the indicated rRNA segments. As control, probes against the RPS18 and GAPDH were used, and the relative RNA levels were determined in each sample using the ΔCt method. RPP25L knockdown only results in a significant accumulation of ITS1. Data are presented as mean -/+ SD (n = 3 biological replicates). P-values were calculated using an unpaired two-tailed t-test (n.s.: not significant). (i) Structure of the Human 80S ribosome (PDB ID: 4UG0), visualized on PyMOL (version 2.5.4), with the 3′ end of 28S rRNA (orange) and RPL17 (blue) highlighted on the structure. RPL17 binds specifically at the 3′end of 28S.
Extended Data Fig. 6
Extended Data Fig. 6. Analysis of the role of cluster 9 proteins in rRNA regulation.
(a) eCLIP distribution of SRSF9, GTF2F1, and NOLC1 binding sites, across the annotated human 45S genomic region. Existing eCLIP datasets and their associated controls from two independent replicate experiments in two independent cell lines (HepG2 and K562), were extracted from ENCODE and processed as described in the ‘Experimental procedures’, in order to reveal the binding sites of each protein across the full length of 45S rRNA. The scales represent the positive fold change relative to the control samples for each experiment. SRSF9, GTF2F1, and NOLC1 exhibit a promiscuous binding pattern across the full length of 45S rRNA. (b) Representative images of nascent RNA imaging analysis of HCT116 cells, transfected with a non-targeting control siRNA pool, or siRNA pools against the indicated target genes. Cells were transfected for 72 hrs with the indicated siRNAs, prior to pulse labeling with FUrd (2mM, 30 min) to label nascent RNAs. As a negative control, CX5461 (100nM, 30 min) was used to block rRNA synthesis, prior to the FUrd pulse. Cells were then fixed and immunostained with an anti-FUrd antibody (green) to visualize nascent RNA, along with an anti-nucleolin antibody to reveal the nucleolar boundaries (red), and Hoechst (blue) as the Nuclear marker. Confocal microscopy analysis revealed that knockdown of most investigated proteins, as well as the CX-5461 treatment, significantly inhibited rRNA synthesis, as indicated by reduced nascent RNA levels in the nucleoli. Scale bar = 10 µm. The cell images are representative of at least 50 individual imaged cells per each condition, taken over 2 independent experiments. (c) Quantification of nascent rRNA levels in the nucleoli of HCT116 cells from the experiment shown in (b). The nucleolar FUrd levels, indicative of nascent rRNA, were quantified from individual nucleoli in each treatment condition. Dash lines mark the mean value. 90–263 nucleoli per each condition, were pooled and quantified from 2 independent experiments. P-values were calculated using non-parametric one-way ANOVA with Kruskal-Wallis Multiple comparisons test. (n.s.: not significant).

References

    1. Hafner M, et al. CLIP and complementary methods. Nat. Rev. Methods Prim. 2021;1:20. doi: 10.1038/s43586-021-00018-1. - DOI
    1. Ule J, et al. CLIP identifies Nova-regulated RNA networks in the brain. Science. 2003;302:1212–1215. doi: 10.1126/science.1090095. - DOI - PubMed
    1. Hafner M, et al. Transcriptome-wide identification of RNA-binding protein and microRNA target sites by PAR-CLIP. Cell. 2010;141:129–141. doi: 10.1016/j.cell.2010.03.009. - DOI - PMC - PubMed
    1. Konig J, et al. iCLIP reveals the function of hnRNP particles in splicing at individual nucleotide resolution. Nat. Struct. Mol. Biol. 2010;17:909–915. doi: 10.1038/nsmb.1838. - DOI - PMC - PubMed
    1. Van Nostrand EL, et al. Robust transcriptome-wide discovery of RNA-binding protein binding sites with enhanced CLIP (eCLIP) Nat. Methods. 2016;13:508–514. doi: 10.1038/nmeth.3810. - DOI - PMC - PubMed

MeSH terms