. 2024 May;21(5):835-845.
doi: 10.1038/s41592-024-02175-z. Epub 2024 Feb 19.

SLIDE: Significant Latent Factor Interaction Discovery and Exploration across biological domains

Affiliations

SLIDE: Significant Latent Factor Interaction Discovery and Exploration across biological domains

Javad Rahimikollu et al. Nat Methods. 2024 May.

Abstract

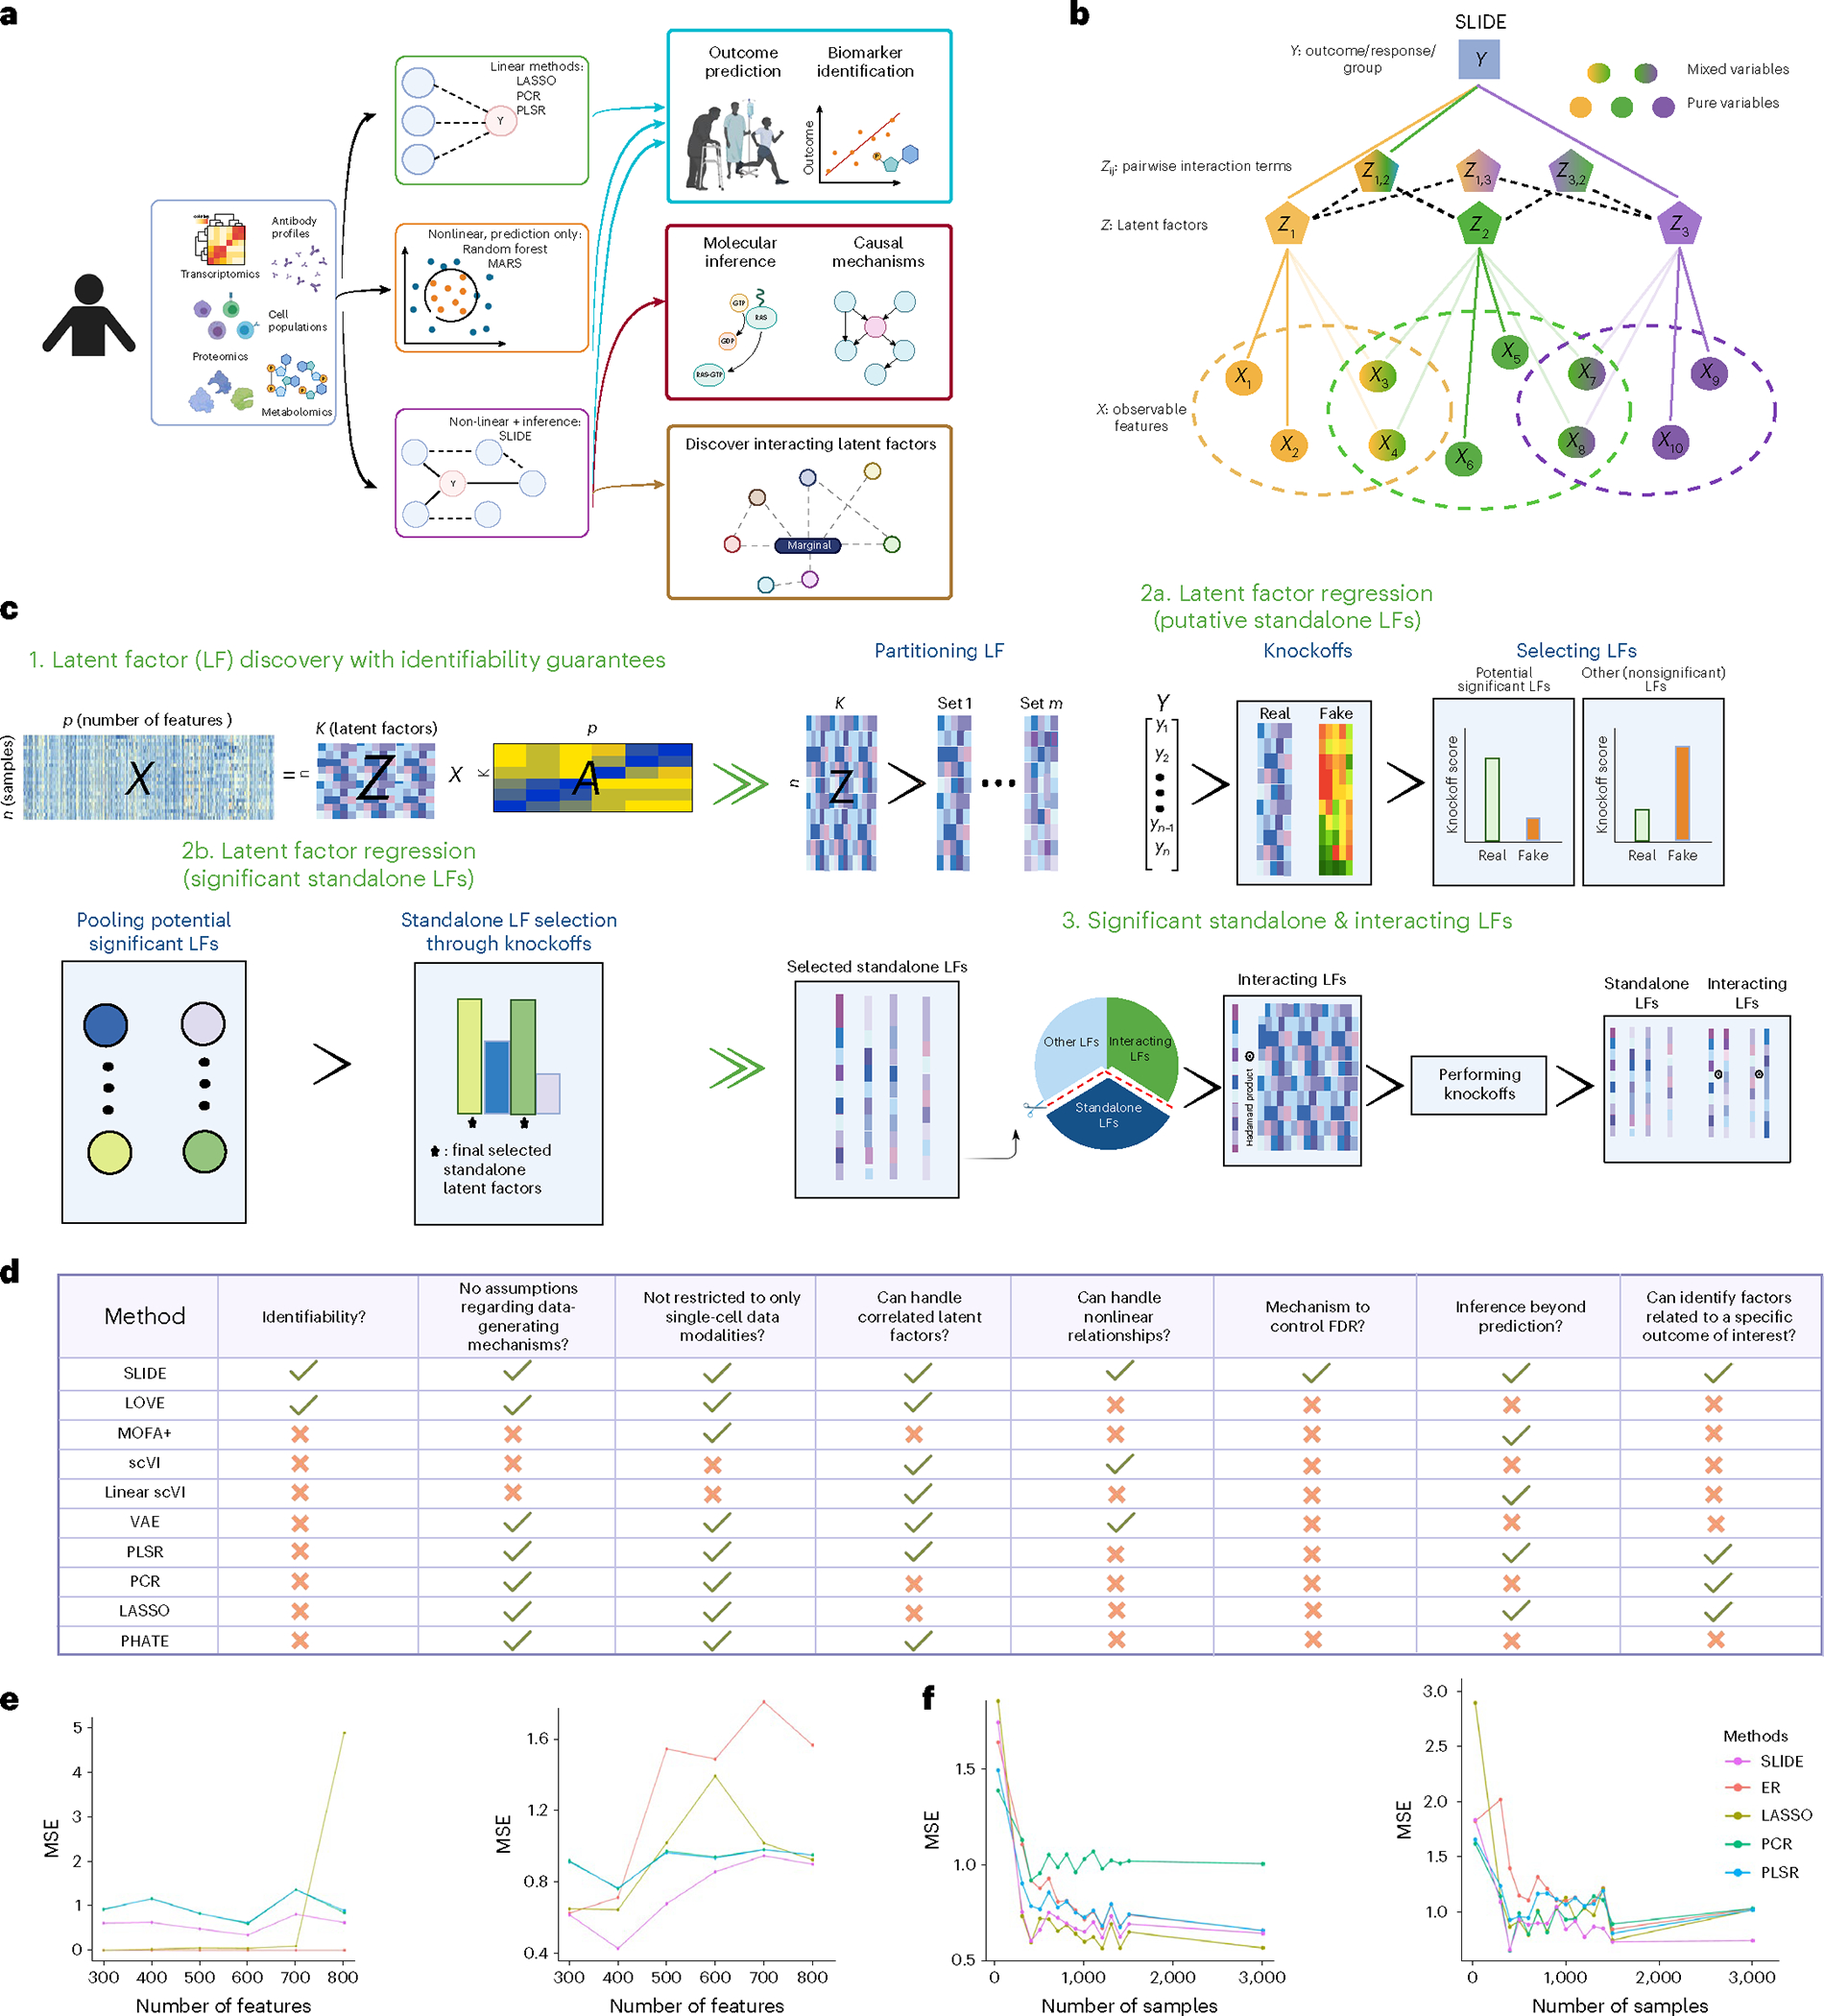
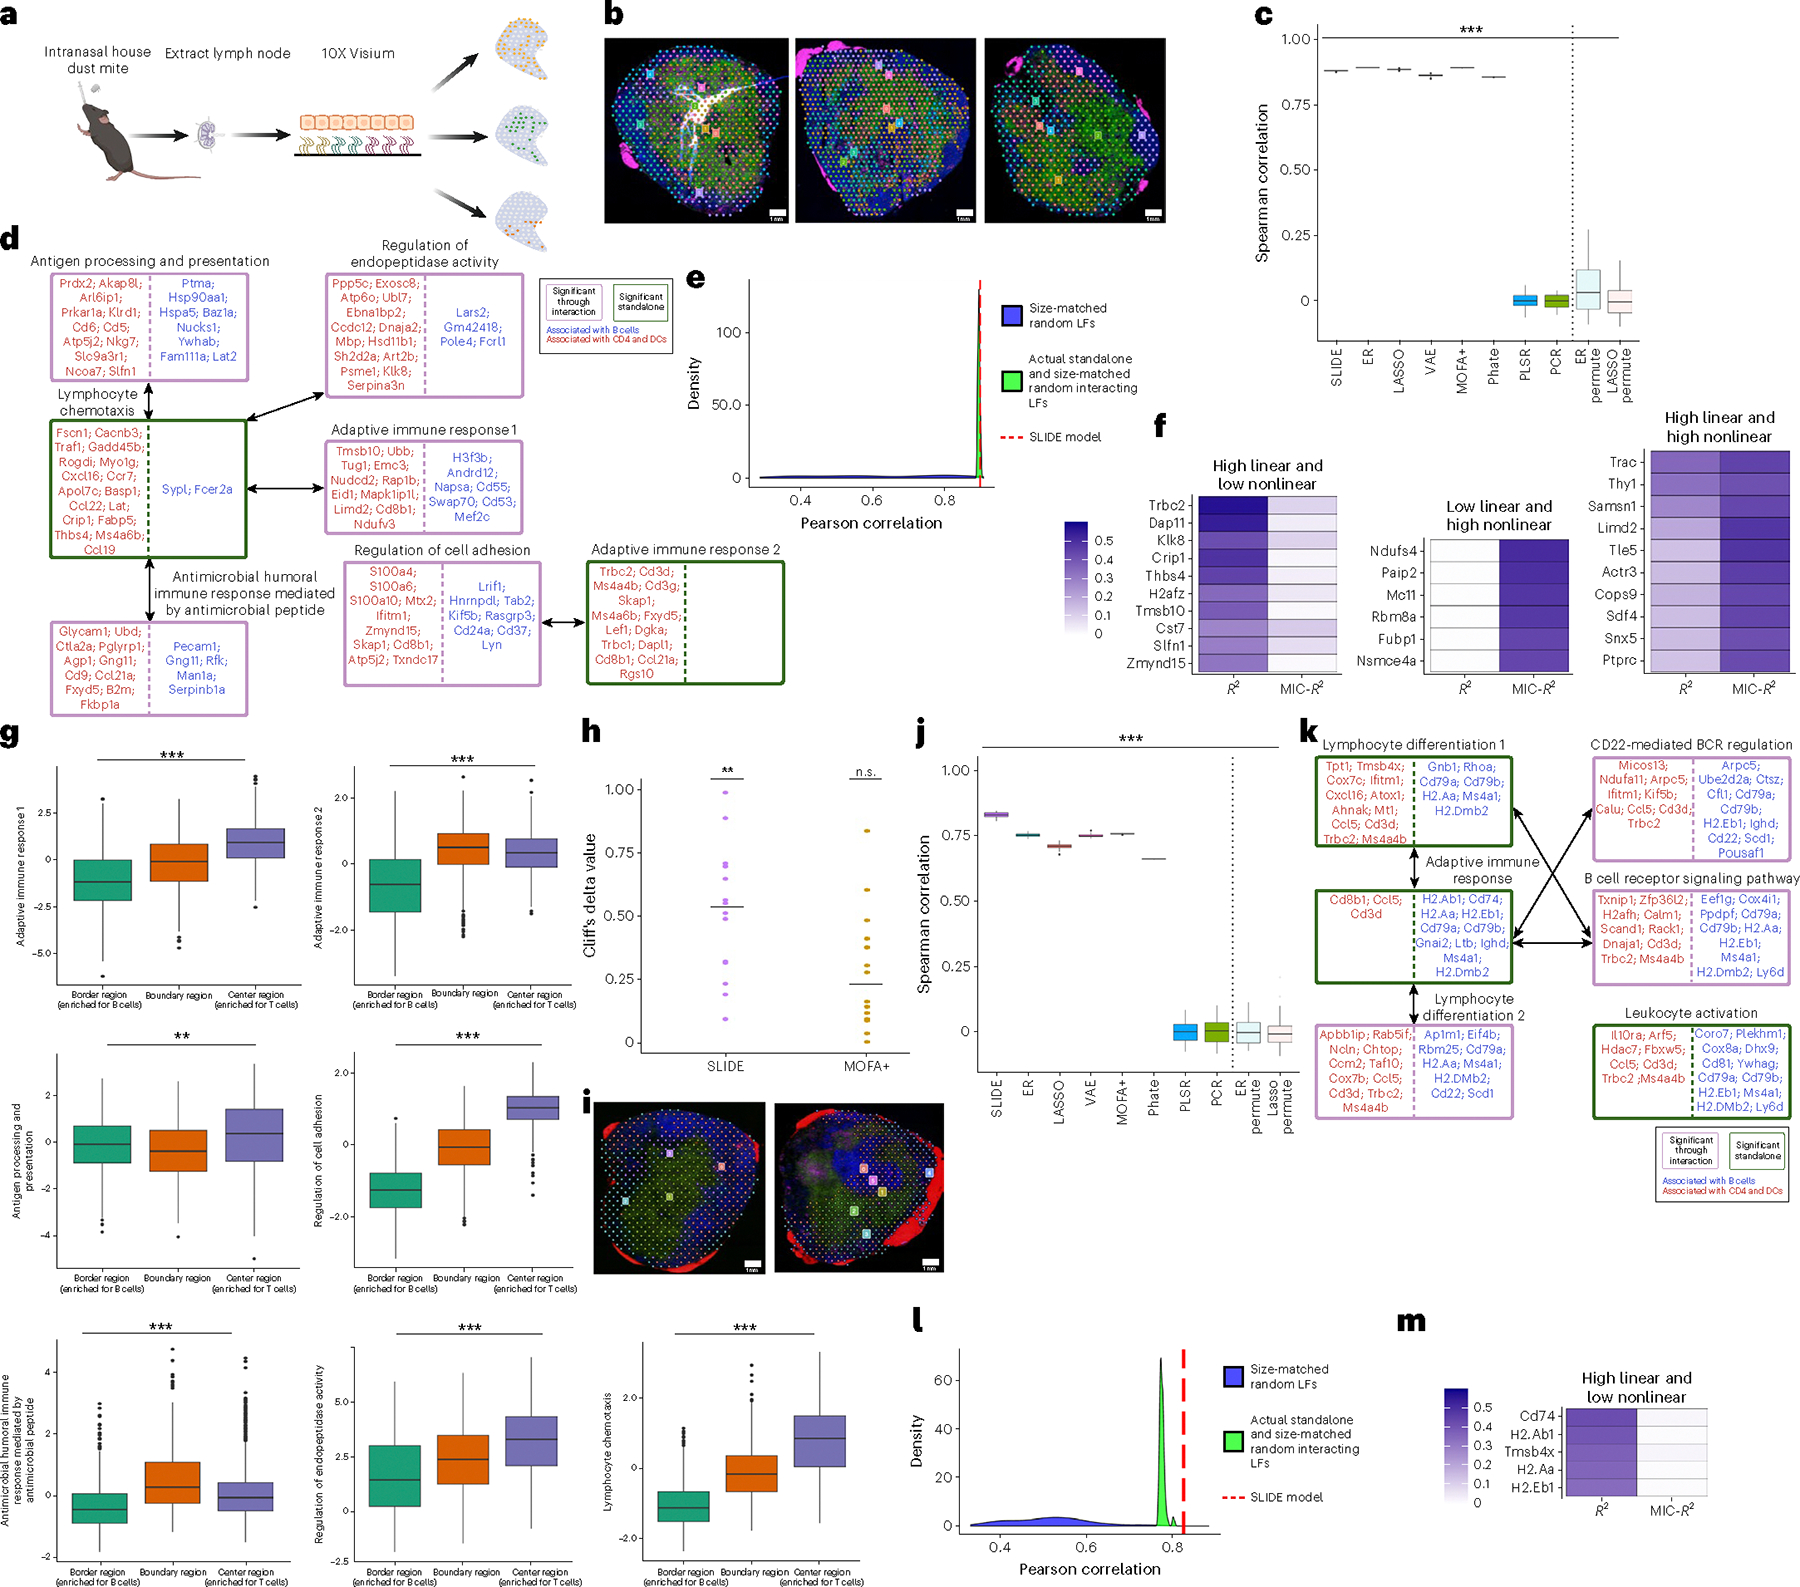
Modern multiomic technologies can generate deep multiscale profiles. However, differences in data modalities, multicollinearity of the data, and large numbers of irrelevant features make analyses and integration of high-dimensional omic datasets challenging. Here we present Significant Latent Factor Interaction Discovery and Exploration (SLIDE), a first-in-class interpretable machine learning technique for identifying significant interacting latent factors underlying outcomes of interest from high-dimensional omic datasets. SLIDE makes no assumptions regarding data-generating mechanisms, comes with theoretical guarantees regarding identifiability of the latent factors/corresponding inference, and has rigorous false discovery rate control. Using SLIDE on single-cell and spatial omic datasets, we uncovered significant interacting latent factors underlying a range of molecular, cellular and organismal phenotypes. SLIDE outperforms/performs at least as well as a wide range of state-of-the-art approaches, including other latent factor approaches. More importantly, it provides biological inference beyond prediction that other methods do not afford. Thus, SLIDE is a versatile engine for biological discovery from modern multiomic datasets.


Conflict of interest statement

Competing interests

The authors declare no competing interests.

Figures

Fig. 1 |
Fig. 1 |. SLIDE—a novel interpretable machine learning method for Significant Latent Factor Interaction Discovery and Exploration.
a, Schematic illustrating the vast array of datasets on which SLIDE can be applied and the key advances over existing analytical frameworks for the analyses of these datasets. b, Conceptual overview of the SLIDE algorithm. c, Schematic summarizing the implementation and different steps in SLIDE. d, Key conceptual innovations of SLIDE. e, Comparison of the predictive performance of ER, LASSO, PCR, PLSR and SLIDE on simulated datasets across a range of number of features without (left) and with (right) interaction terms. MSE, mean squared error. f, Comparison of the predictive performance of ER, LASSO, PCR, PLSR and SLIDE on simulated datasets across a range of sample sizes without (left) and with (right) interaction terms.
Fig. 2 |
Fig. 2 |. SLIDE uncovers novel interacting latent factors that explain SSc pathogenesis.
a, Schematic summarizing the overall setup. t-SNE, t-distributed stochastic neighbor embedding. b, Cellular cluster identities defined by top cell-type-specific differentially expressed genes (DEGs). c, Spearman correlations between true MRSS and MRSS predicted using different methods—SLIDE (spec = 0.1), ER, LASSO, VAE, MOFA+–regression, PHATE–regression, PLSR and PCR. Model performance plotted across 50 replicates of k-fold cross-validation with permutation testing. ***exact P from a permutation test <0.01. d, Significant interacting latent factors identified by SLIDE. Green boxes denote significant standalone latent factors, and purple boxes denote significant interacting latent factors. Color corresponds to the cell type. Genes on the left and right of the dashed line have negative and positive correlations with MRSS, respectively. e, Performance of the real model (spec = 0.1) relative to (1) the distribution of the performance of models built using size-matched random latent factors (blue) and (2) the distribution of the performance of models built using the actual significant standalone latent factors and size-matched random interacting latent factors (green). f, Linear (Spearman correlations) and nonlinear (MIC) relationships between key components of the latent factors and MRSS. g, MRSS and expression of genes with a significant linear relationship with MRSS. h, MRSS and expression of genes with a significant nonlinear relationship with MRSS. UPR, unfolded protein response. i, Scatter plot between each significant latent factor from SLIDE and MRSS. j, The number of known drivers, identified from previously published bulk RNA-seq studies recovered by the SLIDE, VAE and MOFA+ models. k, Effect sizes of the SLIDE, MOFA+ and VAE latent factors in stratifying patients by their MRSS. P calculated by a Mann–Whitney U test. The null distribution is built with random size-matched non-significant SLIDE latent factors. **P < 0.05. n.s., not significant. l, Significant standalone and interacting latent factors underlying changes in MRSS on treatment with tofacitnib. For box plots, the box spans from the first to the third quartile, and the whiskers extend from the first quartile −1.5 interquartile range (IQR) to the third quartile +1.5 IQR.
Fig. 3 |
Fig. 3 |. SLIDE uncovers latent factors underlying immune cell partitioning by 3D localization in a murine model of asthma.
a, Schematic of the 10X Visium experiment. b, K-nearest neighbors (KNN) clustering of the spatial regions overlayed with microscopic images of three D3 technical replicates (blue, B cells; green, CD4 T cells; pink, dendritic cells). c, Spearman correlations between true and predicted spatial region for D3 lymph nodes using different methods—SLIDE (spec = 0.1), ER, LASSO, VAE, MOFA+–regression, PHATE–regression, PLSR and PCR. Model performance is plotted across 50 replicates of fivefold cross-validation framework with permutation testing. ***exact P from a permutation test <0.01. d, Significant interacting latent factors for D3 samples. Green, significant standalone latent factors; purple, significant interacting latent factors. e, Performance of the real model (spec = 0.1) for D3 samples relative to null models as described in Fig. 2e. f, Linear (Spearman correlations) and nonlinear (MIC) relationships between key components of the D3 latent factors and spatial region. g, Box plots illustrating the distributions (across cells) of each SLIDE latent factor across spatial regions. P values are calculated using Kruskal–Wallis test. ***P < 0.01, **P < 0.05. h, Effect sizes of the SLIDE latent factors from g and top size-matched MOFA+ latent factors (each dot corresponds to a latent factor) in discriminating by spatial localization. P from a two-sided Mann–Whitney U test. The null distribution is built with random size-matched nonsignificant SLIDE latent factors. **P = 0.028. n.s., not significant. i, KNN clustering of the spatial regions overlayed with microscopic images of two D5 technical replicates (blue, B cells; green, CD4 T cells; pink, dendritic cells). j, Spearman correlations between true spatial region and spatial region predicted for D5 lymph nodes using different methods—SLIDE (spec = 0.1), ER, LASSO, VAE, MOFA+, PHATE–regression, PLSR and PCR. Model performance is plotted across 50 replicates of k-fold cross-validation with permutation testing. ***P < 0.01. k, Significant interacting latent factors for D5 samples identified by SLIDE. Other conventions correspond to d. BCR, B cell receptor. l, Performance of the real model for D5 samples relative to models as described in Fig. 2e. m, Linear Spearman correlations and nonlinear relationships (quantified using MIC) between key components of the D5 latent factors and spatial region. For box plots, the box spans from the first to the third quartile, and the whiskers extend from the first quartile −1.5 interquartile range (IQR) to the third quartile +1.5 IQR.
Fig. 4 |
Fig. 4 |. SLIDE uncovers latent factors underlying spatial localizations and phenotypes from different spatial transcriptomic and proteomic modalities.
a, Schematic summarizing the Slide-seq experiment. b, KNN clustering of the spatial regions and microscopic images of two technical replicates of mLNs. (blue, B cells; green, CD4 T cells; pink, dendritic cells). c, Spearman correlations between true and predicted spatial region for D3 lymph nodes using different methods—SLIDE (spec = 0.1), ER, LASSO, VAE, MOFA+–regression, PHATE–regression, PLSR and PCR. Model performance is plotted across 50 replicates of fivefold cross-validation with permutation testing. ***P < 0.01. d, Significant interacting latent factors identified by SLIDE. Green, significant standalone latent factors; purple, significant interacting latent factors. e, Performance of the real model (spec = 0.1) relative to null models as described in Fig. 2e. f, Linear (Spearman correlations) and nonlinear (MIC) relationships between key components of the latent factors and spatial region. g, Effect sizes of the SLIDE latent factors from d and top size-matched MOFA+ latent factors (each dot corresponds to a latent factor) in discriminating by spatial localization. P from a Mann–Whitney U test. The null distribution is built with random size-matched nonsignificant SLIDE latent factors. **P < 0.05. n.s., not significant. h, Schematic summarizing MERFISH data from different subsets of glutamatergic neurons spatially distributed across the murine motor cortex. i, Spearman correlations between true spatial region and spatial region predicted for day 3 treated lymph nodes using different methods—SLIDE (spec = 0.1), ER, LASSO, VAE, MOFA+–regression, PHATE–regression, PLSR and PCR. Model performance plotted across 50 replicates of fivefold cross-validation framework with permutation testing. ***P < 0.01. j, Significant interacting latent factors identified by SLIDE. Green, significant standalone latent factors; purple, significant interacting latent factors. k, Performance of the real model for D5 samples relative to null models as described in Fig. 2e. l, Linear Spearman correlations and nonlinear relationships (quantified using MIC) between key components of latent factors and spatial region. m, Schematic summarizing CODEX data from BALBc and MRL/lpr murine spleens. n, Significant interacting latent factors identified by SLIDE. Green, significant standalone latent factors; purple, significant interacting latent factors. o, Performance of the real model for D5 samples relative to null models as described in Fig. 2e. AUC, area under the receiver operating characteristic curve. For box plots, the box spans from the first to the third quartile, and the whiskers extend from the first quartile −1.5 interquartile range (IQR) to the third quartile +1.5 IQR.
Fig. 5 |
Fig. 5 |. SLIDE elucidates novel interacting latent factors underlying the clonal expansion of CD4 T cells in T1D.
a, Schematic summarizing scRNA-seq and TCR-seq data from NOD mice used to infer mechanisms underlying clonal expansion of CD4 T cells. b, UMAP visualization of the three stages of clonal expansion. c, Spearman correlations between true stage of clonal expansion and stage of clonal expansion predicted using different methods—SLIDE (spec = 0.1), ER, LASSO, PLS, PCR and PHATE–regression. Model performance is measured across 50 replicates of fivefold cross-validation with permutation testing. **P < 0.01. d, Significant interacting latent factors (LFs) identified by SLIDE. Green, significant standalone latent factors; purple, significant interacting latent factors. e, Performance of the real model (spec = 0.1) relative to null models as described in Fig. 2e. f, Volcano plots illustrating genes in the significant latent factors. Highlighted genes indicate members in latent factors identified by the SLIDE model. P values from a Wald test. g, Linear Spearman correlations and nonlinear relationships (quantified using MIC) between key components of the latent factors and extent of clonal expansion. FC, fold change. h, Dot plots illustrating frequency (circle size) and median expression (color intensity) of well-known markers of T cell activation, exhaustion and inhibitory receptors at the three stages of clonal expansion. Frequency/expression calculated using data from our study. i, Box plots illustrating the distributions of each SLIDE latent factor (across) cells at the three different stages of clonal expansion. Kruskal–Wallis test is performed to calculate P values. ***P < 0.01. j, Effect sizes of the SLIDE latent factors from d (excluding ribosomal) and top-sized matched MOFA+ and scVI latent factors in stratifying CD4 T cells by extent of clonal expansion. P value is calculated using a Mann–Whitney U test. The null distribution is built with random size-matched nonsignificant SLIDE latent factors. ***P < 0.01. n.s., not significant. k, Dot plots illustrating frequency (circle size) and median expression (color intensity) of well-known markers of T cell activation, exhaustion and inhibitory receptors at the three stages of clonal expansion. Frequency/expression calculated using data from Unanue and colleagues. For box plots, the box spans from the first to the third quartile, and the whiskers extend from the first quartile −1.5 interquartile range (IQR) to the third quartile +1.5 IQR.

Similar articles

Cited by

References

    1. Altman N & Krzywinski M Regression diagnostics. Nat. Methods 13, 385–386 (2016).
    1. Peddireddy SP et al. Antibodies targeting conserved non-canonical antigens and endemic coronaviruses associate with favorable outcomes in severe COVID-19. Cell Rep. 39, 111020 (2022). - PMC - PubMed
    1. Das J et al. Delayed fractional dosing with RTS,S/AS01 improves humoral immunity to malaria via a balance of polyfunctional NANP6- and Pf16-specific antibodies. Medicine 2, 1269–1286 e1269 (2021). - PubMed
    1. Suscovich TJ et al. Mapping functional humoral correlates of protection against malaria challenge following RTS,S/AS01 vaccination. Sci. Transl. Med. 12, eab4757 (2020). - PubMed
    1. Lu LL et al. Antibody Fc glycosylation discriminates between latent and active tuberculosis. J. Infect. Dis. 13, 2093–2102 (2020). - PMC - PubMed