. 2024 Feb 19;15(1):1519.
doi: 10.1038/s41467-024-45307-x.

Causes of death among people living with metastatic cancer

Affiliations

Causes of death among people living with metastatic cancer

Kyle Mani et al. Nat Commun. .

Abstract

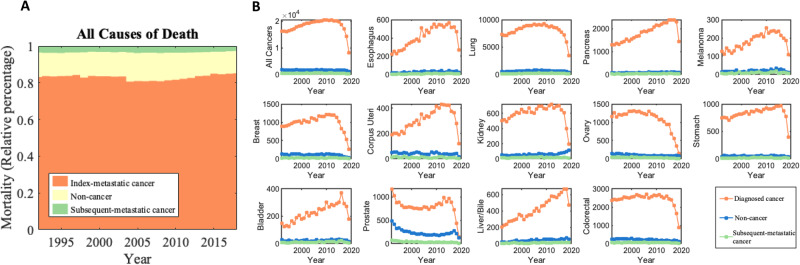
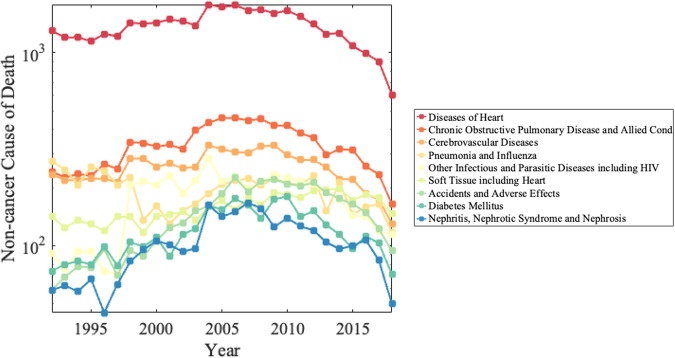
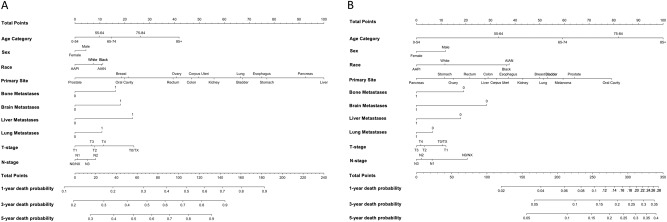
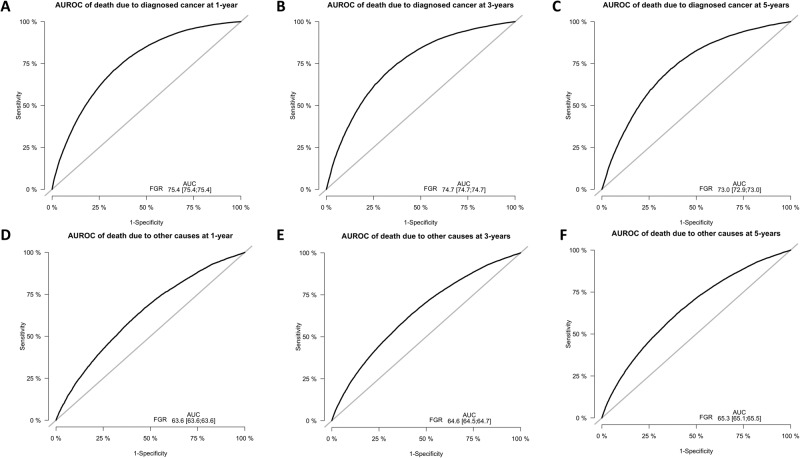
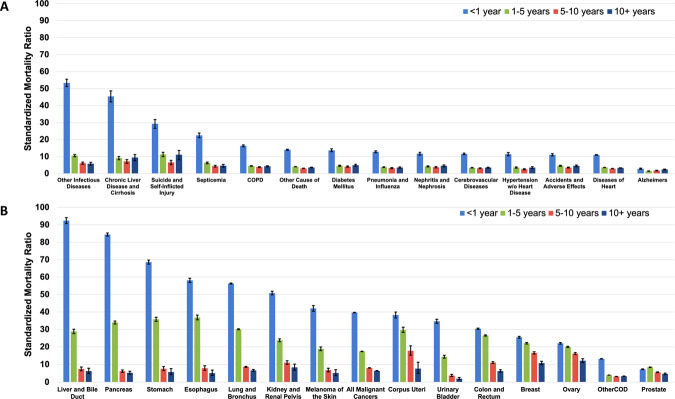
Studying survivorship and causes of death in patients with advanced or metastatic cancer remains an important task. We characterize the causes of death among patients with metastatic cancer, across 13 cancer types and 25 non-cancer causes and predict the risk of death after diagnosis from the diagnosed cancer versus other causes (e.g., stroke, heart disease, etc.). Among 1,030,937 US (1992-2019) metastatic cancer survivors, 82.6% of patients (n = 688,529) died due to the diagnosed cancer, while 17.4% (n = 145,006) died of competing causes. Patients with lung, pancreas, esophagus, and stomach tumors are the most likely to die of their metastatic cancer, while those with prostate and breast cancer have the lowest likelihood. The median survival time among patients living with metastases is 10 months; our Fine and Gray competing risk model predicts 1 year survival with area under the receiver operating characteristic curve of 0.754 (95% CI [0.754, 0.754]). Leading non-cancer deaths are heart disease (32.4%), chronic obstructive and pulmonary disease (7.9%), cerebrovascular disease (6.1%), and infection (4.1%).


Conflict of interest statement

The authors declare no competing interests.

Figures

Fig. 1
Fig. 1. Plots of absolute mortality counts versus year of diagnosis (1992–2019) for various metastatic cancer subtypes.
A Death was stratified due to primary cancer (the cancer originally diagnosed by the patient). B Death was stratified due to primary cancer (the cancer originally diagnosed by the patient), secondary cancer, or all other medical causes of death. Patients diagnosed with indolent cancers in recent years are not included in these graphs as they have not yet died from any cause. Source data are provided as a Source Data File.
Fig. 2
Fig. 2. Mortality counts of the top ten contributing non-cancer causes of death among metastatic patients from 1992–2019.
Diseases of Heart (red color), COPD (dark orange color), Cerebrovascular Diseases (light orange color), and Infectious and Parasitic Diseases including HIV (yellow color) were the leading causes of non-cancer death. The decrease in mortality due to non-cancer death in recent years of diagnosis is due to these patients not living long enough to die from a cause of death. Patients diagnosed with indolent cancers in recent years are not included in these graphs as they have not yet died from any cause. Source data are provided as a Source Data File.
Fig. 3
Fig. 3. Fine-Gray model nomograms to predict 1, 3, and 5-year survival.
A Nomogram to predict 1, 3, and 5-year cancer-specific mortality using clinicopathological variables. The model variables include age group (0–54, 55–64, 75–84, and 85+), sex, race, primary cancer site, presence of metastases to the bone, brain, liver, or lung, t-stage, and n-stage. B Nomogram to predict 1, 3, and 5-year other-cause mortality using clinicopathological variables. The model variables include age group (0–54, 55–64, 75–84, and 85+), sex, race, primary cancer site, presence of metastases to the bone, brain, liver, or lung, t-stage, and n-stage. Source data are provided as a Source Data File.
Fig. 4
Fig. 4. AUROC curves for modeling death due to primary cancer or other cause at 1, 3, and 5-year intervals, respectively.
Sensitivity is plotted on the y-axis and 1-specificity on the x-axis. A AUROC of death due to diagnosed cancer at 1-year, B AUROC of death due to diagnosed cancer at 3-years, C AUROC of death due to diagnosed cancer at 5-years, D AUROC of death due to other causes at 1-year, E AUROC of death due to other causes at 3-years, F AUROC of death due to other causes at 5-years. 95% Confidence Intervals for AUC calculations are included within each plot. The ROC curves for modeling death due to primary cancer demonstrate a good-quality fit. Source data are provided as a Source Data File.
Fig. 5
Fig. 5. Standardized mortality ratios (SMRs) of non-cancer death and primary-specific cancer subtypes.
The y-axis depicts the SMR with 95% CI, and the x-axis depicts A the leading causes of non-cancer death (total person-years at risk = 305,362.9) and B primary-specific cancer subtypes (total person-years at risk = 1,631,087.7, stratified by follow-up time. Different time periods after diagnosis (<1 year vs. 1–5 years vs. 5–10 years vs. >10 years) are shown in orange, yellow, green, and red, respectively. The risk of mortality is highest in the 1st year of diagnosis for all non-cancer deaths and primary-specific cancer subtypes. For most cancers and non-cancer deaths, the SMR subsides with longer follow-up time, but remains greater than the general population. The exact method was used to calculate the 95% CI, and error bars represent the 95% CIs by site. Source data are provided as a Source Data File.

References

    1. Siegel RL, Miller KD, Fuchs HE, Jemal A. Cancer statistics, 2022. CA Cancer J. Clin. 2022;72:7–33. doi: 10.3322/caac.21708. - DOI - PubMed
    1. Dillekås H, Rogers MS, Straume O. Are 90% of deaths from cancer caused by metastases? Cancer Med. 2019;8:5574–5576. doi: 10.1002/cam4.2474. - DOI - PMC - PubMed
    1. Edwards BK, et al. Annual Report to the Nation on the status of cancer, 1975–2010, featuring prevalence of comorbidity and impact on survival among persons with lung, colorectal, breast, or prostate cancer. Cancer. 2014;120:1290–1314. doi: 10.1002/cncr.28509. - DOI - PMC - PubMed
    1. Coleman MP, et al. EUROCARE-3 summary: Cancer survival in Europe at the end of the 20th century. Ann. Oncol. 2003;14:v128–v149. doi: 10.1093/annonc/mdg756. - DOI - PubMed
    1. Masters GA, et al. Clinical cancer advances 2015: Annual report on progress against cancer from the American society of clinical oncology. J. Clin. Oncol. 2015;33:786–809. doi: 10.1200/JCO.2014.59.9746. - DOI - PubMed