Meta-Analysis
. 2024 Feb;30(2):424-434.
doi: 10.1038/s41591-023-02793-8. Epub 2024 Feb 19.

A terminal metabolite of niacin promotes vascular inflammation and contributes to cardiovascular disease risk

Affiliations
Meta-Analysis

A terminal metabolite of niacin promotes vascular inflammation and contributes to cardiovascular disease risk

Marc Ferrell et al. Nat Med. 2024 Feb.

Erratum in

Abstract

Despite intensive preventive cardiovascular disease (CVD) efforts, substantial residual CVD risk remains even for individuals receiving all guideline-recommended interventions. Niacin is an essential micronutrient fortified in food staples, but its role in CVD is not well understood. In this study, untargeted metabolomics analysis of fasting plasma from stable cardiac patients in a prospective discovery cohort (n = 1,162 total, n = 422 females) suggested that niacin metabolism was associated with incident major adverse cardiovascular events (MACE). Serum levels of the terminal metabolites of excess niacin, N1-methyl-2-pyridone-5-carboxamide (2PY) and N1-methyl-4-pyridone-3-carboxamide (4PY), were associated with increased 3-year MACE risk in two validation cohorts (US n = 2,331 total, n = 774 females; European n = 832 total, n = 249 females) (adjusted hazard ratio (HR) (95% confidence interval) for 2PY: 1.64 (1.10-2.42) and 2.02 (1.29-3.18), respectively; for 4PY: 1.89 (1.26-2.84) and 1.99 (1.26-3.14), respectively). Phenome-wide association analysis of the genetic variant rs10496731, which was significantly associated with both 2PY and 4PY levels, revealed an association of this variant with levels of soluble vascular adhesion molecule 1 (sVCAM-1). Further meta-analysis confirmed association of rs10496731 with sVCAM-1 (n = 106,000 total, n = 53,075 females, P = 3.6 × 10⁻¹⁸). Moreover, sVCAM-1 levels were significantly correlated with both 2PY and 4PY in a validation cohort (n = 974 total, n = 333 females) (2PY: rho = 0.13, P = 7.7 × 10⁻⁵; 4PY: rho = 0.18, P = 1.1 × 10⁻⁸). Lastly, treatment with physiological levels of 4PY, but not its structural isomer 2PY, induced expression of VCAM-1 and leukocyte adherence to vascular endothelium in mice. Collectively, these results indicate that the terminal breakdown products of excess niacin, 2PY and 4PY, are both associated with residual CVD risk. They also suggest an inflammation-dependent mechanism underlying the clinical association between 4PY and MACE.


Conflict of interest statement

Declaration of Interests

Drs Hazen and Wang report being named as co-inventors on pending and issued patents held by the Cleveland Clinic relating to cardiovascular diagnostics and therapeutics. Drs Hazen and Wang also report having received royalty payments for inventions or discoveries related to cardiovascular diagnostics or therapeutics from Cleveland Heart Lab, a fully owned subsidiary of Quest Diagnostics, and Procter & Gamble. Dr. Hazen is a paid consultant for Zehna Therapeutics and Proctor & Gamble, and has received research funds from Zehna Therapeutics, Proctor & Gamble, Pfizer, and Roche Diagnostics. Dr. Tang is a consultant for Sequana Medical A.V., Cardiol Therapeutics, Genomics plc, Zehna Therapeutics, and Renovacor, and has received honoraria from Springer Nature for authorship/editorship and American Board of Internal Medicine for exam writing committee. All other authors declare no competing interests.

Figures

Extended Data Fig. 1
Extended Data Fig. 1. Network module-based pathway analysis identifies MACE-associated pathways containing MACE-associated metabolites
(center scatterplot) MACE-associated metabolite enrichment scores versus enrichment P values for metabolic pathways (each point represents a pathway) defined in the Human MFN genome-scale metabolic model, as released with Metaboanalyst v4.0 (Supplemental Methods). Previously, Human MFN was constructed as a network by defining all human metabolites listed in KEGG (release 81.0), SMPDB v2.0, HMDB v4.0, ChEBI (release 131), and Biocyc (release 17.0) as points (nodes) and all chemical reactions (enzymatic or otherwise) as connections (edges) between metabolites (Supplemental Methods). Thus, any two molecules (nodes) participating in the same enzymatic reaction are connected with a line (edge). Metabolites (nodes) are separated into pathways (modules) to maximize the ratio of within-group to between-group connections. Pathway enrichment scores (ratio of observed to expected MACE-associated metabolites) and enrichment P values were determined with mummichog (v1.0.10), as implemented in Metaboanalyst v4.0 (Supplemental Methods), which includes adjustment for multiple testing. In the center scatterplot, each point represents the enrichment score (ratio of observed to expected MACEassociated metabolites) and the P value for the pathway (module). Each pathway (module) with enrichment P value < 0.05 and at least one component metabolite (node) with prospective 3-year MACE hazard ratio (highest vs lowest quartile) P < 0.005 is highlighted in red. P values for all metabolites and pathways are shown in Supplemental Table 5. (outer modules) Shown are nine pathways (network modules) that were enriched with MACE-associated metabolites (enrichment P values < 0.05) and contained at least one component metabolite associated with prospective 3-year MACE (hazard ratio P < 0.005, two-sided Wald test assuming a univariate Cox model with no adjustment for multiple testing). Spectral features detected during untargeted metabolomics analysis were assigned to any molecule with a predicted massto-charge ratio within measurement error of the observed m/z, producing multiple assignments per feature (Supplemental Methods). Names of each network modulebased pathway are shown, and within each pathway, lines (edges) indicate a shared metabolic conversion between the two connected metabolites (nodes), and metabolites (nodes) are colored according to the magnitude of the prospective 3- year MACE hazard ratio. Note that the “Vitamin B3 Metabolism” (niacin/NAD metabolism) pathway module was enriched with MACE-associated metabolites (enrichment P = 0.048) and the top unidentified metabolite (by incident MACE risk hazard ratio), with m/z = 153.0656 Da was assigned to both 2PY and 4PY within the “Vitamin B3 Metabolism” pathway module.
Extended Data Fig. 2
Extended Data Fig. 2. Overview of vitamin B3 metabolism, as defined in the Human MetaFishNet (MFN) model
(a) Network module for vitamin B3 (niacin/NAD) metabolism. Previously, Human MFN was constructed as a network by defining all human metabolites listed in KEGG (release 81.0) SMPDB v2.0, HMDB v4.0, ChEBI (release 131) and Biocyc (release 17.0) as points (nodes) and all chemical reactions (enzymatic or otherwise) as connections (edges) between metabolites (Supplemental Methods). Thus, any two molecules (nodes) participating in the same enzymatic reaction are connected with a line (edge). Metabolites (nodes) are separated into pathways (modules) to maximize the ratio of within-group to between-group connections. Pathway enrichment P values (MACE cases vs controls) were determined with mummichog (v1.0.10), as implemented in Metaboanalyst v4.0 (Supplemental Methods), which includes adjustment for multiple testing. The vitamin B3 network module was enriched with MACE-associated metabolites (enrichment P=0.048), and a mass spectral feature (m/z = 153.0656 Da) assigned to metabolites (nodes) 2PY and 4PY was associated with prospective 3-year MACE risk (highest vs lowest quartile, unadjusted hazard ratio (HR) [95% confidence interval (CI)]=2.77[1.59–4.86], P=0.005[two-sided Wald test, no adjusted for multiple testing]). Further CVD risk analysis of this mass spectral feature is shown in Figure 2a–b. Metabolite (node) colors indicate the MACE hazard ratio (highest vs lowest quartile), while grey indicates the metabolite was not detected. Edges indicate a shared metabolic conversion between the two connected metabolites. Cofactors are not labeled. P values for all metabolites and pathways are shown in Supplemental Table 5. (b) Pathway representation of vitamin B3 metabolism using the molecules and reactions defined in the Human MFN model. The conversion of iminoaspartate to quinolinate was inferred in Human MFN, and so no enzyme is listed. NAD, nicotinamide adenine dinucleotide; ACMS, aminocarboxymuconoate semialdehyde; NAMN, nicotinic acid mononucleotide; SAM Sadenosyl methionine; SAH, S-adenosyl homocysteine.
Extended Data Fig. 3
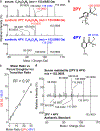
Extended Data Fig. 3. Serum metabolite (m/z = 153.0656 Da) produces CID spectrum similar to a mixture of synthetic 2PY and 4PY
Untargeted metabolomics revealed a serum analyte (m/z = 153.0656 Da) associated with prospective residual MACE risk. Network module-based pathway analysis suggested this serum analyte (m/z = 153.0656 Da) was a mixture of the structural isomers 2PY and 4PY, which have the same elemental composition (Supplemental Methods). As the collision-induced dissociation (CID) mass spectrum of the MACE-associated serum analyte (m/z = 153.0656 Da) included characteristic daughter ions of both 2PY and 4PY, we explored whether a mixture of synthetic 2PY and 4PY could reproduce the CID mass spectrum of the serum analyte before conducting further structural studies and developing a method of independently quantitating 2PY and 4PY. Chemical synthesis of 2PY and 4PY is described in Supplemental Methods, and 1H-NMR spectra of synthetic material are shown in Supplemental Figures 1 and 2. (a) Comparison of the high-resolution collision-induced dissociation (CID) mass spectra in positive ion mode of the unknown MACE-associated serum analyte with m/z = 153.0656 Da and calculated elemental formula C7H8O2N2 (top), with synthetic 2PY (middle) and 4PY (bottom). 2PY and 4PY both have the elemental formula C7H8O2N2, and their observed m/z values are within measurement error (5 ppm) of 153.0656 Da. A CID parent-to-daughter transition characteristic, but not unique to 2PY (m/z = 110.0605 Da) is shown in red while a CID transition characteristic to 4PY (m/z = 136.0395 Da) is shown in blue. The spectrum of the serum analyte (top) contained parent-to-daughter transitions characteristic of 2PY and 4PY. (b) Parent-to-daughter transitions that are predicted to be unique to 2PY (m/z = 126.0555 Da) and 4PY (m/z = 95.0133 Da). These unique daughter fragments are detected at very low intensities as shown in Source Data. (c) We hypothesized the serum analyte with m/z = 153.0656 Da was a mixture of 2PY and 4PY. Without the capability to chromatographically separate 2PY and 4PY and compare to pure authentic chemical standards, we estimated the molar ratio of 2PY and 4PY in human serum in order to compare the presumed mixture to an equivalent mixture of 2PY and 4PY chemical standards. The molar ratio of 2PY:4PY in solution can be calibrated with the ratio of unique predicted parent-to-daughter transition intensities. The calibration curve prepared using 2PY and 4PY chemical standards in deionized water is shown. This molar ratio calibration curve was only used for exploratory structural studies and does not estimate absolute concentrations of 2PY and 4PY. Later, different calibration curves were used for independent quantitation of 2PY and 4PY using chromatographic separation. (d) Comparison of CID spectra of serum analyte with m/z = 153.0656 Da (top) with a solution of 2PY and 4PY in deionized water at the estimated molar ratio.
Extended Data Fig. 4
Extended Data Fig. 4. Illustration of methods development to selectively monitor and quantify serum levels of 2PY and 4PY
Shown is the baseline chromatographic resolution of 2PY and 4PY in serum, coupled with the selective MRM transitions used to quantify 2PY and 4PY. Briefly, isotope labeled synthetic 2PY and 4PY (d3–2PY and d3–4PY) were added to serum samples, protein precipitated with methanol, and then following injection on silica column, the indicated isotopologues of 2PY and 4PY were resolved and monitored by the indicated MRM transitions. The selectivity of the MRM transitions for either 2PY (red) or 4PY (blue) are indicated, with change in font size used to indicate selectivity for either 2PY or 4PY (or their corresponding d3-isotopologue internal standards). Chemical synthesis of 2PY and 4PY is described in Supplemental Methods, and 1H-NMR of synthetic material are shown in Supplemental Figures 1 and 2. Note that the three distinct MRM transitions selected for monitoring natural abundance 2PY, 4PY, and their heavy isotope-labeled are also shown. The selected MRM transitions are also shown in Figure 2d. Note how the silica column-based method baseline resolves 2PY and 4PY within the MACE-associated serum analyte with m/z = 153.0656 Da.
Extended Data Fig. 5
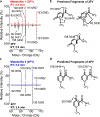
Extended Data Fig. 5. Verifying the MACE-associated serum analyte with m/z = 153.0656 Da is comprised of 2PY and 4PY.
The MACE-associated serum analyte with m/z = 153.0656 Da was resolved into two chromatographically separable structural isomers, 2PY and 4PY, using the new HPLC method. The two analytes have retention times of 2.4 min (metabolite 1; 2PY) and 3.4 min (metabolite 2; 4PY). (a) High resolution CID spectrum of serum metabolite 1 with retention time 2.4 min compared to synthetic 2PY (retention time 2.4 min). Peaks are labeled with their measured m/z in Da. (b) Sizes of predicted fragments of 2PY. Predicted fragments are labeled with their predicted m/z in Da. (c) CID spectrum of metabolite 2 with retention time 3.4 min compared to synthetic 4PY (retention time 3.4 min). Peaks are labeled with their measured m/z in Da. (d) Sizes of predicted fragments of 4PY. Predicted fragments are labeled with their predicted m/z in Da. Chemical synthesis of 2PY and 4PY is described in Supplemental Methods, and 1H-NMR spectra of synthetic material are shown in Supplemental Figures 1 and 2. Differences in m/z among predicted fragments and those observed for synthetic and serum 2PY and 4PY were within expected experimental error and are shown in Supplemental Table 6.
Extended Data Fig. 6
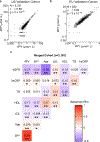
Extended Data Fig. 6. Comparison of 2PY and 4PY levels in US and European Validation Cohorts
(a - b) Serum levels of 2PY and 4PY were highly correlated in both the US and European Validation Cohorts. P values for Pearson correlations determined from t distributions with n-2 degrees of freedom (P=1.2×10−1757 for the US validation cohort and P=2.1×10−986 for the European validation cohort). P values for Spearman correlations determined with two-sided asymptotic t tests, and exact P values <2×10⁻¹⁶ could not be determined.(c) Spearman correlations among 2PY, 4PY, and risk factors for MACE. P values determined with two-sided asymptotic t tests and adjusted for multiple testing using the false discovery rate method. Baseline clinical cohort characteristics are shown in Supplemental Table 2. ** p < 0.0001, * p < 0.05
Extended Data Fig. 7
Extended Data Fig. 7. Sensitivity analysis of 2PY and 4PY association with MACE in the merged cohort
US and European Validation Cohorts were merged (n=3,163), and Hazard Ratio (quartile 4 (Q4) versus quartile 1 (Q1); open circle) for 4PY (panel a) and 2PY (panel b) association with MACE (3yr) risks for the indicated subgroups are shown. Baseline clinical cohort characteristics are shown in Supplemental Table 2. Symbols represent hazard ratios and error bars represent 95% confidence intervals. Ref, reference group. Interaction P values were determined with two-sided Wald tests and adjusted for multiple testing using the method of Benjamani and Hochberg. ** P < 0.0001; * P < 0.05
Extended Data Fig. 8
Extended Data Fig. 8. Transcriptomic analysis of human endothelial cells exposed to 2PY or 4PY
(a) Human endothelial cells were cultured with 2PY, 4PY, or vehicle control, and RNA was harvested after 4 hours. VCAM1 mRNA levels determined by RNA sequencing were elevated in 4PY-treated cells. The bar plot with error bars shows the mean plus or minus one standard error. P values were determined with two-sided Kruskal-Wallis (KW) and Wilcox tests. (b) Volcano plot shows differentially expressed genes for vehicle vs 4PY.(c) Differentially expressed genes for 2PY vs 4PY. Genes whose mRNA expression is impacted by 4PY compared to either control are shown in red. Fold change P values were determined using the log ratio test as implemented in edgeR and adjusted using the false discovery rate method. (d) Gene sets (Gene Ontology terms) whose member genes are enriched with the differentially expressed genes between vehicle and 4PY are shown. Dot size indicates the number of differentially expressed genes in the set. P values determined with two sided Fisher Exact tests and adjusted using the false discovery rate method. Only tip terms are shown, i.e. enriched GO terms with enriched child terms are not shown. All enriched GO terms are included in Source Data. (e) Genes associated with the cellular response to tumor necrosis factor (TNF) (shown in red in (d)) tend to have higher expression in 4PY-treated cells than vehicle- and 2PY-treated cells. Expression in transcripts per million transformed to Z-scores per gene.
Figure 1:
Figure 1:. Niacin is an essential micronutrient fortified in food staples beyond dietary requirements.
(a) NAD, an essential cofactor, is synthesized via salvage or de novo pathways or from nicotinic acid, also known as niacin. Excess niacin or NAD is metabolized to 2PY and 4PY. The enzyme ACMSD regulates de novo NAD synthesis by diverting tryptophan to energy metabolism. (b) Historical estimated niacin equivalents per person per day for US adults are shown in black (USDA Center for Nutrition Policy and Promotion: Nutrient Content of the U.S. Food Supply 1909–2010). Historical pellagra deaths are shown in red (NCHS Vital Statistics 1933–1955). Recommended daily allowances (RDAs), the niacin consumption recommended by the National Academy of Sciences, is indicated for adult males and females, as well as the Tolerable Upper Intake Level, defined as the highest daily intake likely to pose no risk of skin flushing to almost all people (Dietary Reference Intakes 2006). ACMS, aminocarboxymuconate semialdehyde; NAD, nicotinamide adenine dinucleotide; MNA, N1-methyl-nicotinamide.
Figure 2:
Figure 2:. Identification of the MACE-associated metabolite as2PY and 4PY, the terminal metabolites of niacin.
(a,b) Kaplan-Meier estimates and two-sided log-rank test (P=5.0×10⁻⁵) (a) and hazard ratios (b) for MACE in the discovery cohort (n = 1,162) ranked by quartiles of a plasma analyte with m/z = 153.0656 Da. Cox models (unadjusted, open black circles) using the adjustments (adjusted, open red circles) traditional cardiovascular risk factors (age, sex, systolic blood pressure, LDL, HDL, triglycerides, diabetes status), hsCRP, current (active) smoking status, alcohol use, and education level. Symbols represent hazard ratios and error bars represent 95% confidence intervals. Ref, reference group. Hazard ratios for MACE-associated metabolites are shown in Supplemental Tables 3 and 4. (c) Collision-induced dissociation (CID) spectrum in positive-ion mode of the metabolite with m/z = 153.0656 Da in serum (upper) compared to CID spectra of synthetic 2PY (middle) and 4PY (lower). Molecular fragments characteristic of 2PY are shown in red; fragments characteristic of 4PY are shown in blue. (d) Demonstration of chromatography of parent-to-daughter ion transitions for plasma analytes with m/z = 153 Da and comparison to synthetic 2PY and 4PY and stable isotope-labeled d3–2PY and d3–4PY. Parent-to-daughter transitions selective for both 2PY and 4PY (153 → 108 Da) are shown in black; parent-to-daughter transitions selective for 2PY (153 → 110 Da) or d3–2PY (156 → 113 Da) are shown in red; parent-to-daughter transitions selective for 4PY (153 → 136 Da) or d3–4PY (156 → 139 Da) are shown in blueThree parent-to-daughter ion transitions were monitored for each analyte, and chromatograms for all transitions are shown in Extended Data Figure 4. Separate CID spectra were acquired for 2PY and 4PY using the HPLC method shown above (Extended Data Figure 5).
Figure 3:
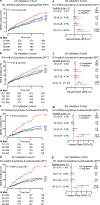
Figure 3:. Niacin metabolites 2PY and 4PY are associated with increased prospective MACE risk in two independent clinical cohorts.
(a, b, c, d) Kaplan-Meier estimates are shown for the risk of incident 3-year MACE by quartiles of serum levels of 2PY and 4PY for the US validation (n=2,331) (a, b) and European validation (n=832) (c, d) cohorts. P values determined with two-sided log-rank tests (for the European validation cohort, P=2.0×10⁻¹² and P=1.9×10⁻¹³ for the 2PY and 4PY, respectively). (e, f, g, h) Forest plots of Cox proportional hazard ratios for MACE by quartiles of serum levels of 2PY and 4PY are shown for the US (e, f) and the European (g, h) validation cohorts. Cox models are shown (unadjusted, open black circles) using the adjustments (adjusted, open red circles) for traditional cardiovascular risk factors (age, sex, systolic blood pressure, LDL, HDL, triglycerides, diabetes status) hsCRP, current (active) smoking status, and alcohol use. The US validation cohort was additionally adjusted for education level. Symbols represent hazard ratios, and error bars represent 95% confidence intervals.
Figure 4:
Figure 4:. The NAD synthesis gene ACMSD is associated with 4PY levels and vascular inflammation.
(a) Miami plot of GWAS meta-analyses for levels of 2PY (top) and 4PY (bottom). Horizontal red and blue lines indicate thresholds for genome-wide significant (P=5.0×10⁻⁸) and suggestive (P=5.0×10⁻⁶) evidence for association, respectively. (b , c) Regional plots showing P values for variants within the chromosome 2 locus associated with 2PY (b) and 4PY (c) levels. Shades of red indicate the degree of linkage disequilibrium (LD) between the lead variants for 2PY (rs10496731, indicated in blue, P=1.6×10−41) and 4PY (rs6430553, P=3.6×10⁻¹²) and other variants at the locus. P values were determined with two-sided Z-score based meta-analysis with sample size weighting as implemented in METAL. P values are not adjusted for multiple testing. Horizontal red lines indicate the threshold for genome-wide significant (P=5.0×10⁻⁸) evidence for association. P values for association with 2PY and 4PY levels are shown for all variants for the US validation cohort in Supplemental Figure 3. (d) Relative expression data for the ratio of the two ACMSD transcript isoforms (functional:nonfunctional) stratified by rs10496731 genotype (n=208) were obatined from the Genotype-Tissue Expression (GTEx) project. The singular P value obtained from GTEx were determined with two-sided Wald tests using linear regression analysis assuming an additive model with adjustment for sex, the top 5 genotyping principal components, sequencing platform, sequencing protocol, and 15 PEER (Probabilistic Estimation of Expression Residuals) factors. The singular obtained from GTEx P value was not adjusted for multiple testing. Central lines indicate medians, hinges indicate the interquartile range, and whiskers indicate the minima and maxima. (e) Liver Acmsd transcript fold-changes are shown for mice transduced with AAV expressing either scrambled shRNA (control) or shRNA targeting Acmsd mRNA transcripts (knockdown). (f) Quantification of ACMSD protein in mouse liver by Western blotting, shown fold-changes for control and knockdown mice. (g) Mouse serum 2PY (left) and 4PY (right) levels are shown for control and knockdown mice. Bar plots with error bars show the mean plus or minus one standard error. P values were determined with two-sided Wilcox tests.
Figure 5:
Figure 5:. The niacin metabolite 4PY enhances VCAM-1 expression and leukocyte adhesion in vivo.
(a,b) Patient serum sVCAM-1 levels are shown stratified by quartiles of 2PY (a) and 4PY (b) serum levels within a subset of the US validation cohort (n=974). Central lines indicate medians, hinges indicate the interquartile range, and whiskers indicate 5th and 95th percentiles. P values were determined with two-sided trend tests (P=8.0×10⁻⁵ for 2PY and P=4.0×10⁻⁵ for 4PY) and Kruskal-Wallis tests (P=2.5×10⁻⁵ for 2PY and P=4.8×10⁻⁹ for 4PY). (c,d) For two separate experiments, VCAM1 transcript fold changes, as determined by real-time quantitative PCR, (c) and VCAM-1 protein fold changes, as determined by Western blotting, (d) are shown following exposure to 2PY or 4PY, or vehicle control, or LPS as a positive control. Bar plots with error bars show the mean ± one standard error. P values were determined with the Kruskal-Wallis test with post-hoc Dunn’s tests. Western blot images are shown in Supplemental Figure 4. (e) Immunohistochemical staining for VCAM-1 and a positive endothelial marker (PECAM) in aortas of mice after treatment with 2PY, 4PY, or vehicle control. Representative microscopy images are shown. Scale bar is 50 μm. (f) Endothelial VCAM-1 protein was quantified using pixel scoring, and the mean pixel H-score of three high-magnification fields is shown. P values determined with one-way ANOVA with post-hoc student t tests. (g) Intravital microscopy of auricular venules of mice treated with 2PY or 4PY or vehicle control. Representative microscopy images are shown. Scale bar is 50 μm. (h) Numbers of adherent leukocytes determined with intravital microscopy. The mean of three venules per animal is shown. Endpoint serum concentrations of 2PY and 4PY are shown as mean ± standard error, and bold text indicates concentrations in 2PY- and 4PY-treated mice that are statistically different from those of control animals. For boxplots, the central line represents the median, the upper and lower hinges represent the interquartile range, and whiskers represent the smallest or largest value within 1.5 times the interquartile range of the lower or upper hinge. P values determined using Kruskal-Wallis Test with post-hoc Dunn’s tests. *, samples below the lower limit of detection (LOD) were assigned a value of ½ the LOD.
Figure 6:
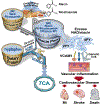
Figure 6:. Niacin metabolites 2PY and 4PY are associated with increased VCAM-1 expression and residual cardiovascular event risk.
Dietary niacin, which is fortified in food staples, contributes to the NAD pool via the salvage pathway, which is the major contributor to the NAD pool. In the de-novo pathway, tryptophan-NAD conversion is regulated by the enzyme ACMSD, which diverts tryptophan to the tricarboxylic acid (TCA) cycle. The gene encoding ACMSD contains genetic variants associated with 2PY, 4PY, and sVCAM-1 levels. Excess NAD is metabolized to 2PY and 4PY, and 4PY induces mRNA and protein expression of VCAM-1 as well as leukocyte adherence to the vascular wall. VCAM-1 is also genetically linked to and correlated with 2PY and 4PY levels in circulation. Elevated circulating levels of 2PY, 4PY, and VCAM-1 are all associated with increased residual risk of prospective MACE (myocardial infarction [MI], stroke, and death).

Comment in

References

    1. Virani SS et al. Heart Disease and Stroke Statistics - 2023 Update: A Report From the American Heart Association. Circulation vol. 147 (2023). - PMC - PubMed
    1. D’Agostino RB et al. General cardiovascular risk profile for use in primary care: The Framingham heart study. Circulation 117, 743–753 (2008). - PubMed
    1. Ridker PM et al. Cardiovascular efficacy and safety of bococizumab in high-risk patients. N. Engl. J. Med. 376, 1527–1539 (2017). - PubMed
    1. Sabatine MS et al. Evolocumab and clinical outcomes in patients with cardiovascular disease. N. Engl. J. Med. 376, 1713–1722 (2017). - PubMed
    1. Pradhan AD, Aday AW, Rose LM & Ridker PM Residual inflammatory risk on treatment with PCSK9 inhibition and statin therapy. Circulation 138, 141–149 (2018). - PMC - PubMed

Methods-only References

    1. Koeth RA et al. Intestinal microbiota metabolism of L-carnitine, a nutrient in red meat, promotes atherosclerosis. Nat. Med. 19, 576–585 (2013). - PMC - PubMed
    1. Brennan ML et al. Comprehensive peroxidase-based hematologic profiling for the prediction of 1-year myocardial infarction and death. Circulation 122, 70–79 (2010). - PMC - PubMed
    1. König M et al. Cohort profile: Role of lipoproteins in cardiovascular disease - The LipidCardio study. BMJ Open 9, (2019). - PMC - PubMed
    1. Inker LA et al. New creatinine- and cystatin c–based equations to estimate GFR without race. N. Engl. J. Med. 385, 1737–1749 (2021). - PMC - PubMed
    1. STROBE statement - Checklist of items that should be included in reports of observational studies (© STROBE Initiative). Int. J. Public Health 53, 3–4 (2008). - PubMed

Publication types