Clinical Trial
. 2024 Mar;30(3):699-707.
doi: 10.1038/s41591-024-02824-y. Epub 2024 Feb 19.

Regorafenib plus nivolumab in unresectable hepatocellular carcinoma: the phase 2 RENOBATE trial

Affiliations
Clinical Trial

Regorafenib plus nivolumab in unresectable hepatocellular carcinoma: the phase 2 RENOBATE trial

Hyung-Don Kim et al. Nat Med. 2024 Mar.

Abstract

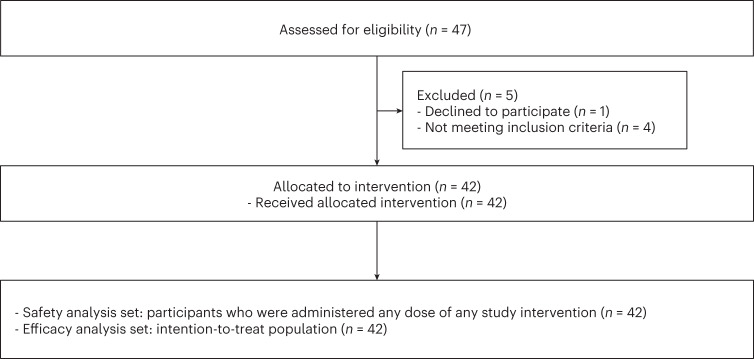
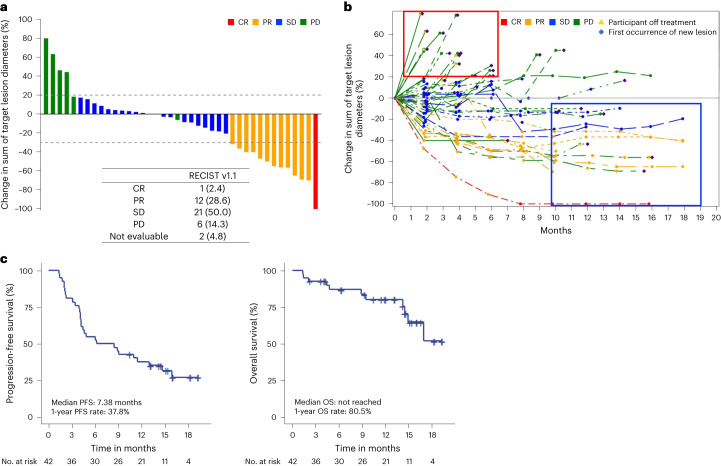
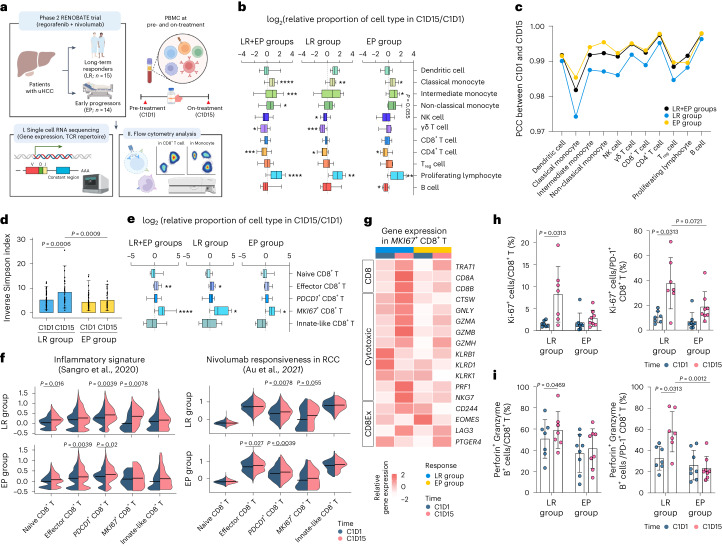
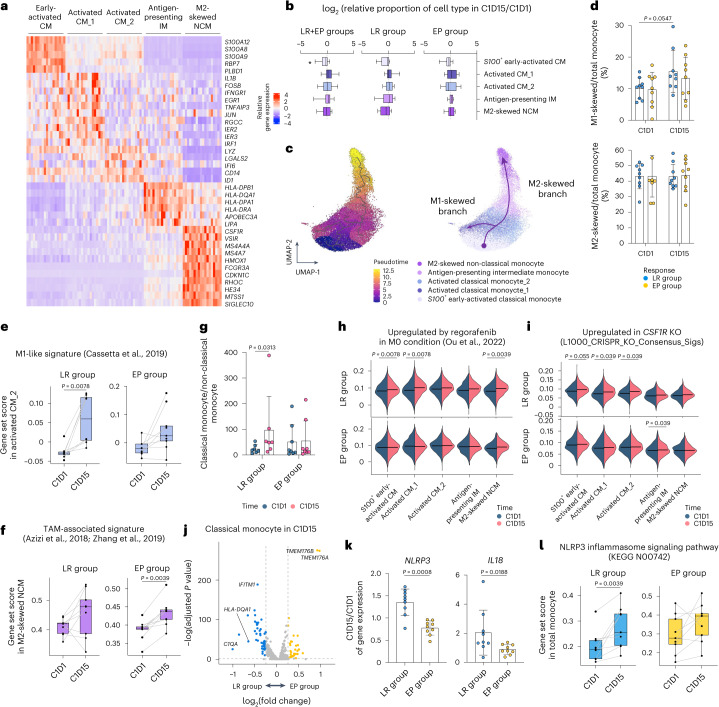
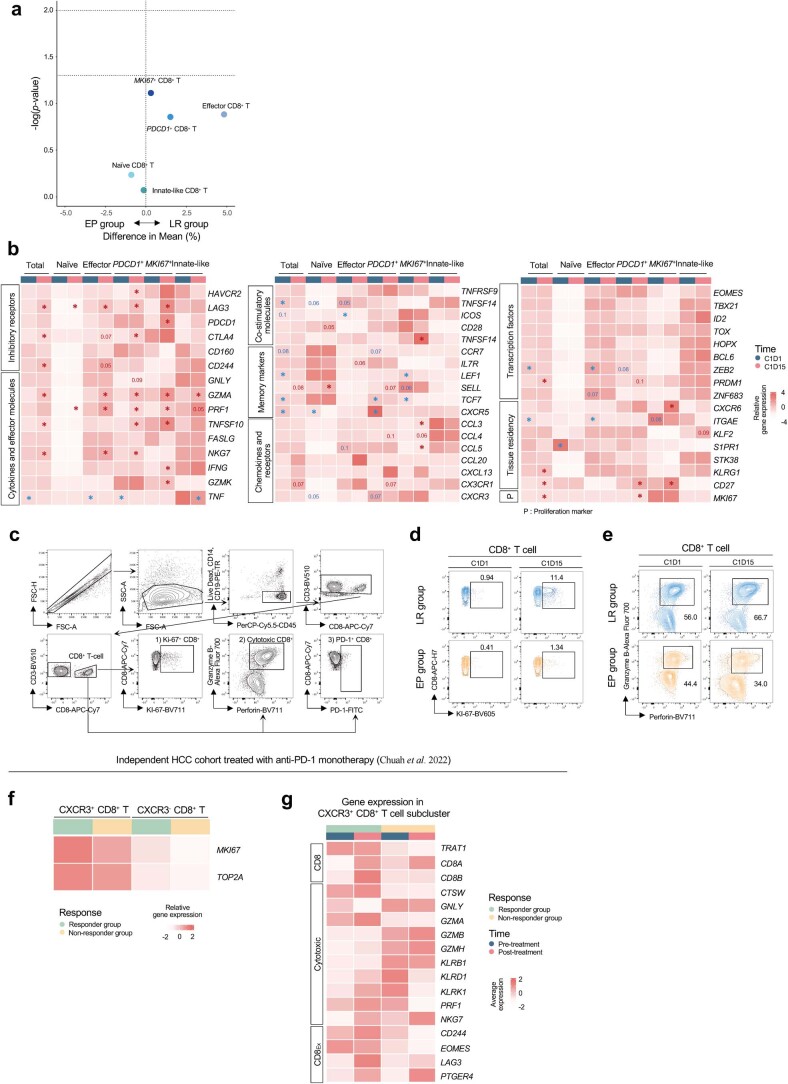
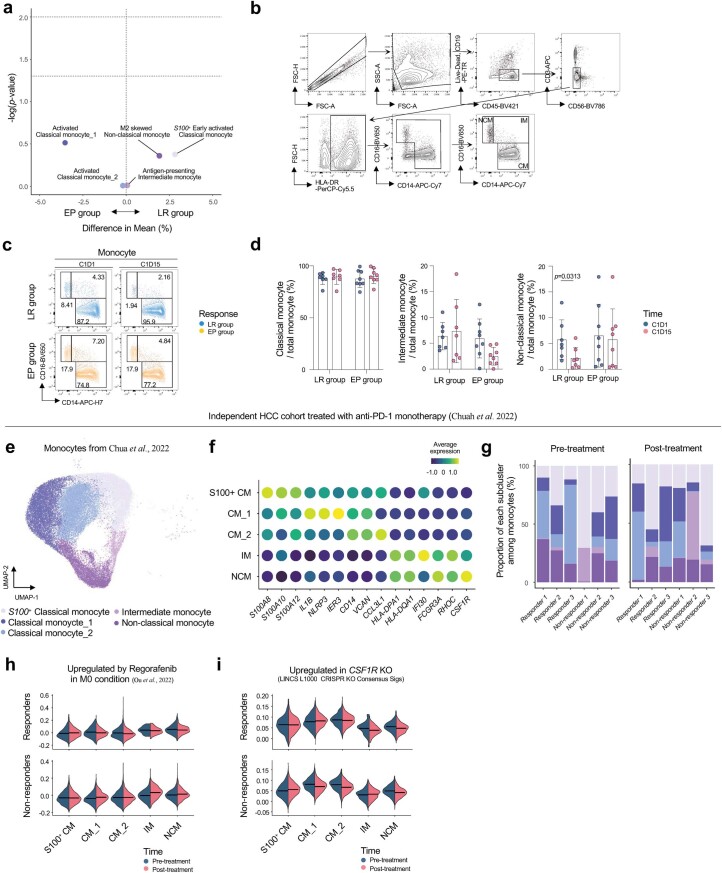
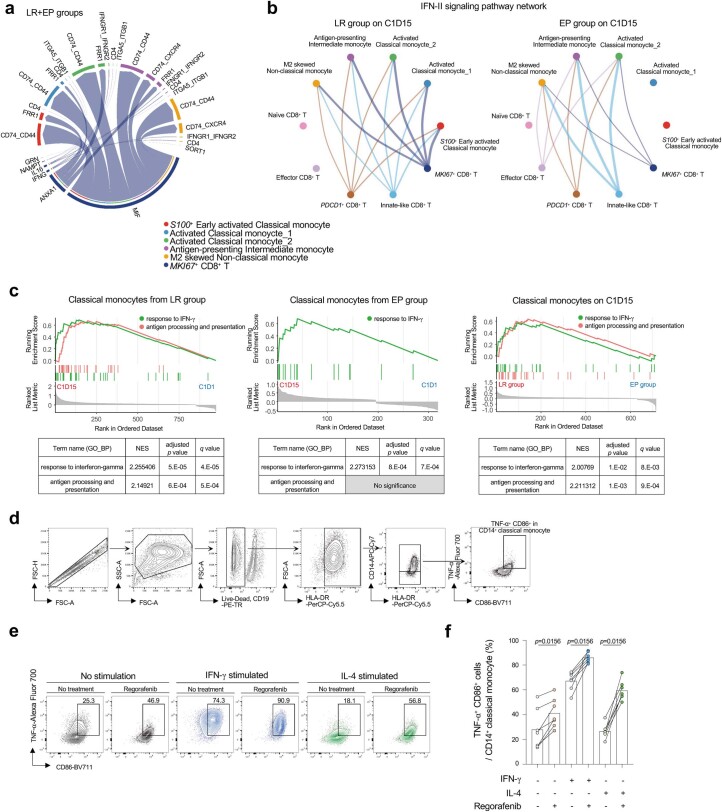
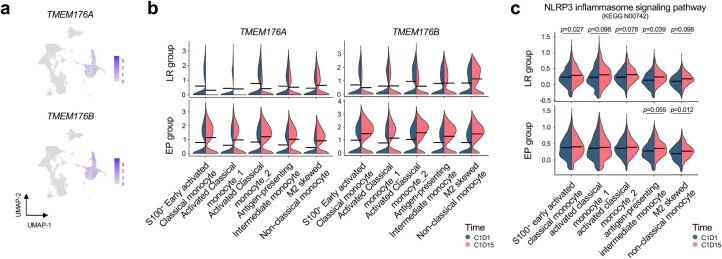
Regorafenib has anti-tumor activity in patients with unresectable hepatocellular carcinoma (uHCC) with potential immunomodulatory effects, suggesting that its combination with immune checkpoint inhibitor may have clinically meaningful benefits in patients with uHCC. The multicenter, single-arm, phase 2 RENOBATE trial tested regorafenib-nivolumab as front-line treatment for uHCC. Forty-two patients received nivolumab 480 mg every 4 weeks and regorafenib 80 mg daily (3-weeks-on/1-week-off schedule). The primary endpoint was the investigator-assessed objective response rate (ORR) per Response Evaluation Criteria in Solid Tumors (RECIST) version 1.1. The secondary endpoints included safety, progression-free survival (PFS) and overall survival (OS). ORR per RECIST version 1.1 was 31.0%, meeting the primary endpoint. The most common adverse events were palmar-plantar erythrodysesthesia syndrome (38.1%), alopecia (26.2%) and skin rash (23.8%). Median PFS was 7.38 months. The 1-year OS rate was 80.5%, and the median OS was not reached. Exploratory single-cell RNA sequencing analyses of peripheral blood mononuclear cells showed that long-term responders exhibited T cell receptor repertoire diversification, enrichment of genes representing immunotherapy responsiveness in MKI67+ proliferating CD8+ T cells and a higher probability of M1-directed monocyte polarization. Our data support further clinical development of the regorafenib-nivolumab combination as front-line treatment for uHCC and provide preliminary insights on immune biomarkers of response. ClinicalTrials.gov identifier: NCT04310709 .


Conflict of interest statement

C.Y. received honoraria from Servier, Bayer, AstraZeneca, Merck Sharp & Dohme, Eisai, Celgene, Bristol Myers Squibb, Ipsen, Novartis, Boryung Pharmaceuticals, Mundipharma and Roche and received research grants from Servier, Bayer, AstraZeneca, Ono Pharmaceuticals, Ipsen and Boryung Pharmaceuticals. H.-D.K. received honoraria from AstraZeneca, Bristol Myers Squibb, Ono Pharmaceuticals, Boryung Pharmaceuticals, Eisai, Daehwa and Boostimmune and served as a consultant for Mustbio. H.J.C. holds consulting or advisory roles with Eisai, Roche, Bayer, Ono Pharmaceuticals, Merck Sharp & Dohme, Bristol Myers Squibb, Sanofi, Servier, AstraZeneca, SillaJen, Menarini and GreenCross Cell and has received research grants from Roche, Dong-A ST and Boryung Pharmaceuticals. D.T. received honoraria from Novartis, Celgene, Sirtex, Merck Sharp & Dohme, Eisai, Ipsen, Bayer, GlaxoSmithKline, Roche and AstraZeneca and research support from Novartis, Sirtex and Bristol Myers Squibb. R.S.F. reports grants or contracts to institution from Adaptimmune, Bayer, Bristol Myers Squibb, Eisai, Eli Lilly, Pfizer, Roche and Genentech; personal consulting fees from Merck, AstraZeneca, Bayer, Bristol Myers Squibb, Exelixis, Cstone, Hengrui, Eisai, Eli Lilly, Merck Sharp & Dohme, Pfizer, Roche and Genentech; personal payments or honoraria from Genentech; and participation on a data safety monitoring or advisory board for AstraZeneca and Hengrui. All other authors have no competing interests to disclose.

Figures

Fig. 1
Fig. 1
CONSORT flow diagram.
Fig. 2
Fig. 2. Clinical outcomes of regorafenib–nivolumab.
a, Waterfall plot showing the change in the sum of target lesion diameters. b, Spider plot showing changes in the sum of target lesion diameters throughout treatment. Red box represents early progressors. Blue box represents long-term responders. c, PFS and OS of the study population.
Fig. 3
Fig. 3. Overall immune landscapes and dynamic changes of CD8+ T cell subsets in peripheral blood.
a, Schematic summary of the design of exploratory analyses. b, Box plots showing the fold change in proportions of immune cell types among PBMCs in long-term responders (LR; n = 9), early progressors (EP; n = 9) and both (n = 18). c, PCC of each cell type between C1D1 and C1D15. d, Bar plots showing the TCR diversity, as represented by the inverse Simpson index for CD8+ T cells in LR (n = 15) and EP (n = 14) between C1D1 and C1D15. e, Box plots showing the fold change in the proportions of CD8+ T cell subclusters among NK/T cells among LR (n = 9), EP (n = 9) and both (n = 18). f, Violin plots showing the module score for gene sets related to inflammatory signature (left) and nivolumab responsiveness in each CD8+ T cell cluster (right). g, Heat map showing expression levels of CD8 and genes related to cytotoxicity and T cell exhaustion among MKI67+CD8+ T cells. h, Proportion of Ki-67+ cells among CD8+ T cells and PD-1+CD8+ T cells, before and after treatment, among LR (n = 7) and EP (n = 8). i, Proportion of Granzyme B+perforin+ cells among CD8+ T cells and PD-1+CD8+ T cells, before and after treatment, among LR (n = 7) and EP (n = 8). Gating strategy of CD8+ T cells is shown in Extended Data Fig. 5c. *P < 0.05, **P < 0.01, ***P < 0.005, ****P < 0.001, according to a Wilcoxon signed-rank test for paired groups and two-tailed Mann–Whitney U-test for unpaired groups. Data are presented as mean ± s.d. In each box plot, the box represents the interquartile range, and whiskers represent minima and maxima. RCC, renal cell carcinoma.
Fig. 4
Fig. 4. Dynamic monocyte response.
a, Heat map of cluster-specific DEGs of monocyte clusters. b, Fold changes in the proportions of monocyte subclusters among myeloid cells among long-term responders (LR; n = 9), early progressors (EP; n = 9) and both (n = 18). c, UMAP and pseudotime trajectory initiated from early-activated classical monocytes toward either M1-skewed or M2-skewed route. d, The proportions of M1-skewed or M2-skewed monocytes among total monocytes among LR (n = 9) and EP (n = 9). e, Module scores for an M1-like gene set within the activated classical monocyte_2 subset in LR (n = 8) and EP (n = 9). f, Module scores for a gene set related to TAM among M2-skewed non-classical monocytes in LR (n = 9) and EP (n = 9). g, Ratio of classical to non-classical monocytes among LR (n = 7) and EP (n = 8). h, Module scores for the gene set upregulated by regorafenib in each monocyte cluster from LR (n = 9) and EP (n = 9). i, Module scores for the gene set upregulated in CSF1R_Up_from_L1000_CRISPR_KO_Consensus_Sigs in each monocyte cluster from LR (n = 9) and EP (n = 9). j, DEGs among total monocytes on C1D15 in LR (n = 9) versus EP (n = 10). Blue and yellow indicate genes significantly upregulated in LR and EP, respectively. k, Changes in the expression of NLRP3 and IL18 in LR (n = 9) and EP (n = 9). l, Module score for the NLRP3 inflammasome signaling pathway-related gene set in total monocytes of LR (n = 9) and EP (n = 9). Gating strategy of monocytes is shown in Extended Data Fig. 6b. *P < 0.05, according to a Wilcoxon signed-rank test for paired groups and two-tailed Mann–Whitney U-test for unpaired groups. Data are presented as mean ± s.d. In each box plot, the box represents the interquartile range, and whiskers represent minima and maxima. CM, classical monocyte; IM, indeterminate monocyte; KO, knockout; NCM, non-classical monocyte.
Extended Data Fig. 1
Extended Data Fig. 1. Circulating tumor DNA analysis.
a, Heatmap of genetic alterations detected using Guardant360 CDx. b, Progression-free survival and overall survival according to the presence of genetic alterations in the Wnt/β-Catenin pathway, evaluated by circulating tumor DNA analysis. Two-sided Log-rank test was used for comparison.
Extended Data Fig. 2
Extended Data Fig. 2. Individual response profiles of peripheral blood mononuclear cells (PBMCs).
a, UMAP projections of PBMC (n = 86,205) colored according to immune cell type. b, UMAP projections of PBMCs splitted by each patient. c, Dot plots showing the average normalized expressions of marker genes in each immune cell cluster. d, Volcano plot showing proportional changes of each cell type among PBMCs at C1D1, between long-term responders (LR; n = 15) and early progressors (EP; n = 13). The unpaired T test was performed for unpaired groups. e, Bar plots showing the proportion of each cell type among PBMCs in individual samples: LR at C1D1 (n = 15); EP at C1D1 (n = 13); LR at C1D15 (n = 9); and EP at C1D15 (n = 10).
Extended Data Fig. 3
Heatmap showing the Pearson correlation coefficient of each cell type upon regorafenib-nivolumab treatment.
Extended Data Fig. 4
Extended Data Fig. 4. Subcluster analysis of T/NK lymphocyte populations.
a, UMAP of T/NK cells colored according to immune cell types. b, UMAP plots showing normalized expressions of marker genes used for subclustering of T/NK cells. c, UMAP plots of proliferating lymphocytes colored according to immune cell types. d, Dot plots showing the average normalized expressions of marker genes used for subclustering of proliferating lymphocytes. e, Dot plots showing the average normalized expression of marker genes in CD8+ T-cell subclusters.
Extended Data Fig. 5
Extended Data Fig. 5. Detailed response profiles of CD8+ T cells upon regorafenib-nivolumab treatment.
a, Volcano plot showing proportional changes in total CD8+ T-cell subclusters at C1D1 between long-term responders (LR; n = 15) and early progressors (EP; n = 13). The unpaired T test was performed for unpaired groups. b, Heatmap of CD8+ T surrogate marker genes among total CD8+ T cells and subclusters. Red and blue astrerisks indicate genes significantly upregulated at C1D1 and C1D15, respectively. c, Gating strategy of CD8+ T-cells PBMC in LR and EP. d, Representative flow cytometry plots for KI-67-expressing cells among CD8+ T-cells. e, Representative flow cytometry plots for granzyme B- and perforin-expressing CD8+ T-cells. f, Heatmap of proliferation marker gene among CXCR3+CD8+ T-cell and CXCR3CD8+ T-cell subclusters from an independent HCC cohort treated with anti-PD-1 monotherapy (Chuah et al. 2022). g, Heatmap of CD8+ T surrogate marker genes among CXCR3+CD8+ T-cell subcluster from the independent HCC cohort treated with anti-PD-1 monotherapy (Chuah et al. 2022). *P < 0.05, according to a two-sided Wilcoxon signed-rank test for paired groups.
Extended Data Fig. 6
Extended Data Fig. 6. Detailed response profiles of monocytes upon regorafenib-nivolumab treatment.
a, Volcano plot showing proportional changes in monocyte subclusters at C1D1 among long-term responders (LR; n = 15) versus early progressors (EP; n = 13). The unpaired T test was performed for unpaired groups. b, Gating strategy of monocytes from PBMCs in LR and EP. c, Representative flow cytometry plots for classical (CD14+CD16), intermediate (CD14+CD16+) and non-classical (CD14dimCD16+) monocytes among total monocytes. d, Proportions of classical, intermediate and non-classical monocytes among total monocytes, before and after regorafenib-nivolumab treatment, in LR (n = 7) and EP (n = 8). Analyses of monocyte clusters from an independent HCC cohort treated with anti-PD-1 monotherapy (Chuah et al. 2022) (e-i). e, UMAP of monocyte clusters. f, Dot plots showing the average normalized expressions of marker genes used for subclustering of monocyte clusters. g, Bar plots showing the proportion of each cell type among monocyte clusters in individual samples. (h-i), Violin plots showing module scores for the gene sets upregulated in each monocyte cluster according to treatment outcomes at pre- and post-treatment; gene sets upregulated in by regorafenib in M0 condition (h), upregulated in CSF1R KO (i). *P < 0.05, **P < 0.01, ***P < 0.005, ****P < 0.001, according to a two-sided Wilcoxon signed-rank test for paired groups, and two-sided Mann-Whitney U test for unpaired groups. Data are presented as mean ± standard deviation.
Extended Data Fig. 7
Extended Data Fig. 7. Communication between proliferating CD8+ T cells and classical monocytes with enrichment of genes of antigen processing and presentation and IFN responses.
a, A chord diagram to visualize cell-cell communication between MKI67+ effector CD8+ T-cells and monocyte subclusters among long-term responders (LR; n = 15) and early progressors (EP; n = 13). b, Dot plots showing the associations of latent patterns with cell groups in the IFN-II signaling pathway network, between LR (n = 9) and EP (n = 10) on C1D15. c, GSEA plots of gene modules related to antigen processing and presentation and response to IFN-γ in classical monocytes, with DEGs (adjusted p value 0.05) from each clinical setting: LR between C1D1 and C1D15 (left column), EP between C1D1 and C1D15 (middle column) and classical monocytes at C1D15 between LR and EP (right column). Significance based on enrichment analysis with Benjamini-Hochberg-adjusted p values. d, Gating strategy of TNF-α+ CD86+ cells among CD14+ classical monocytes of healthy donors. e, Representative flow cytometry plots for TNF-α+ CD86+ cells among CD14+ classical monocytes after combination of IFN-γ (100 ng/ml), IL-4 (50 ng/ml), and regorafenib (1 μM) stimulation. f, Bar plots showing the proportion of TNF-α+ CD86+ cells among CD14+ classical monocytes of healthy donors (n = 7). *P < 0.05, **P < 0.01, ***P < 0.005, ****P < 0.001, according to a two-sided Wilcoxon signed-rank test for paired groups. Data are presented as mean ± standard deviation.
Extended Data Fig. 8
Extended Data Fig. 8. TMEM176A/B expression and expression levels of genes related to the NLRP3 inflammasome in monocytes upon regorafenib-nivolumab treatment.
a, UMAP plots showing normalized expressions of TMEM176A and TMEM176B in PBMCs. b, Violin plots showing the average expression of the TMEM176A and TMEM176B genes before and after treatment among long-term responders (LR; n = 15) and early progressors (EP; n = 13). c, Violin plots showing the module score for the gene set related to the NLRP3 inflammasome signaling pathway in each monocyte subcluster in LR (n = 9) and EP (n = 9). *P < 0.05, **P < 0.01, ***P < 0.005, ****P < 0.001, according to a two-sided Wilcoxon signed-rank test for paired groups.

References

    1. Yau T, et al. Nivolumab versus sorafenib in advanced hepatocellular carcinoma (CheckMate 459): a randomised, multicentre, open-label, phase 3 trial. Lancet Oncol. 2022;23:77–90. doi: 10.1016/S1470-2045(21)00604-5. - DOI - PubMed
    1. Finn RS, et al. Pembrolizumab as second-line therapy in patients with advanced hepatocellular carcinoma in KEYNOTE-240: a randomized, double-blind, phase III trial. J. Clin. Oncol. 2020;38:193–202. doi: 10.1200/JCO.19.01307. - DOI - PubMed
    1. Finn RS, et al. Atezolizumab plus bevacizumab in unresectable hepatocellular carcinoma. N. Engl. J. Med. 2020;382:1894–1905. doi: 10.1056/NEJMoa1915745. - DOI - PubMed
    1. Abou-Alfa, G. K. et al. Tremelimumab plus durvalumab in unresectable hepatocellular carcinoma. NEJM Evid. 10.1056/EVIDoa2100070 (2022). - PubMed
    1. Qin S, et al. Camrelizumab plus rivoceranib versus sorafenib as first-line therapy for unresectable hepatocellular carcinoma (CARES-310): a randomised, open-label, international phase 3 study. Lancet. 2023;402:1133–1146. doi: 10.1016/S0140-6736(23)00961-3. - DOI - PubMed

Publication types

MeSH terms

Associated data