. 2024 Feb 19;7(1):202.
doi: 10.1038/s42003-024-05805-6.

Clonal chromosomal mosaicism and loss of chromosome Y in elderly men increase vulnerability for SARS-CoV-2

Collaborators, Affiliations

Clonal chromosomal mosaicism and loss of chromosome Y in elderly men increase vulnerability for SARS-CoV-2

Luis A Pérez-Jurado et al. Commun Biol. .

Abstract

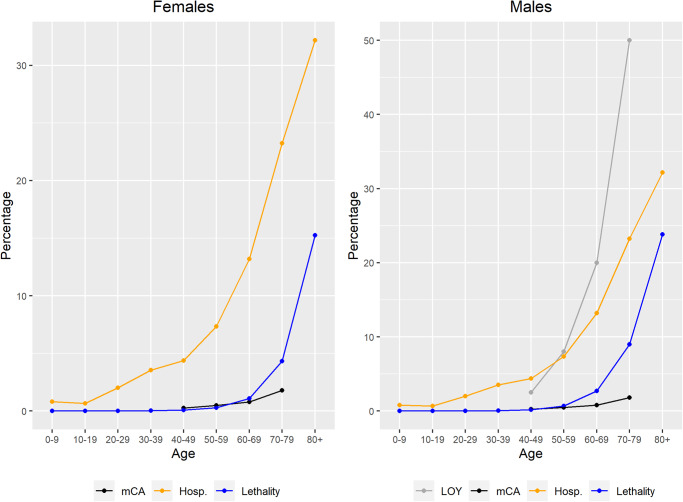
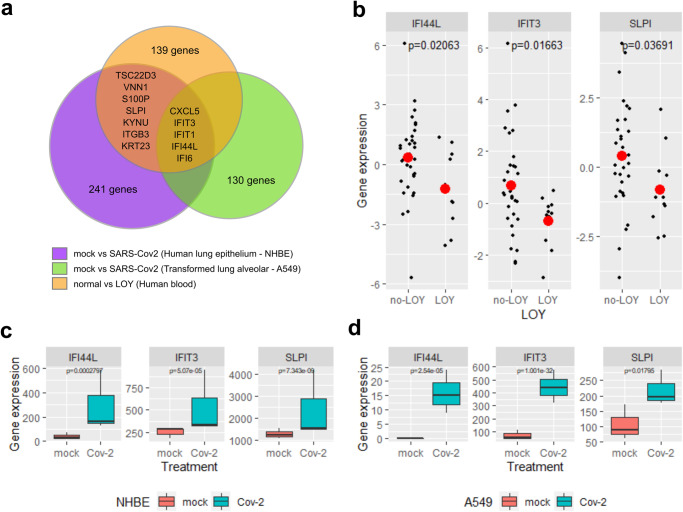
The pandemic caused by severe acute respiratory syndrome coronavirus 2 (SARS-CoV-2, COVID-19) had an estimated overall case fatality ratio of 1.38% (pre-vaccination), being 53% higher in males and increasing exponentially with age. Among 9578 individuals diagnosed with COVID-19 in the SCOURGE study, we found 133 cases (1.42%) with detectable clonal mosaicism for chromosome alterations (mCA) and 226 males (5.08%) with acquired loss of chromosome Y (LOY). Individuals with clonal mosaic events (mCA and/or LOY) showed a 54% increase in the risk of COVID-19 lethality. LOY is associated with transcriptomic biomarkers of immune dysfunction, pro-coagulation activity and cardiovascular risk. Interferon-induced genes involved in the initial immune response to SARS-CoV-2 are also down-regulated in LOY. Thus, mCA and LOY underlie at least part of the sex-biased severity and mortality of COVID-19 in aging patients. Given its potential therapeutic and prognostic relevance, evaluation of clonal mosaicism should be implemented as biomarker of COVID-19 severity in elderly people.


Conflict of interest statement

LAPJ is founding partner and scientific advisor of qGenomics laboratories. The other authors declare no competing interests.

Figures

Fig. 1
Fig. 1. COVID-19 lethality and mCA and LOY prevalence as functions of age.
Increasing sex-specific hospitalization (orange) and mortality (blue) rates for COVID-19 in Spain in the different age intervals (updated July 2022). Estimated prevalence by age in the general population of detectable mCA (black) or LOY in men (grey) in blood is also shown,.
Fig. 2
Fig. 2. mCA and LOY detection if the SCOURGE study.
a Plot representing the whole-genome molecular karyotype obtained by SNParray of blood DNA from an individual with several mCAs. Dots in grey are LRR values (average per widow shown by a green lane), while colored dots are BAF values of homozygous and heterozygous SNPs from odd (red) and even number (orange) chromosomes, respectively. Abnormal BAF and average LRR values in three regions (blue lanes interrupting the black lane in the upper part) correspond to mosaicism for trisomy 12, a small interstitial deletion in 13q and X-chromosome monosomy. The blue lanes interrupting the green lane at LRR = 0 correspond to small regions of homozygosity. b Circus plots showing all detected mCAs in the SCOURGE dataset. In red deletions, in blue gains and in green copy neutral events. c Analysis of LOY in male individuals in the SCOURGE study based on mean LRR from chromosome Y (mLRRY: relative amount of DNA from the Y chromosome with respect to autosomes). Blue dots correspond to males with mosaic LOY in more than 65% of cells (XCM > 65%), green dots to males with LOY/XCM between 25%–65%, and red dots to males with LOY/XCM in less than 25% of cells. The three individuals with top mLRRY values have apparently non-mosaic gains of chromosome Y (47,XYY).
Fig. 3
Fig. 3. Associations of detectable mCAs and LOY with COVID-19-related mortality.
Mortality was reported at most 90 days after infection. The analyses are stratified or adjusted by sex, as indicated. All analyses are adjusted for age and 10 principal components of ancestry. Individuals with prevalent hematologic cancer were excluded from the analysis. Error bars correspond to the 95% CI for the OR estimates.
Fig. 4
Fig. 4. Transcriptomic signatures of LOY.
a Decreased expression of CSF2RA mRNA and increased expression of MYL9 and VWF in individuals with LOY compared with controls with no LOY (mean gene expression in red dot). b Different predicted cell counts underlying the transcriptomic differences between cases with LOY and control individuals (no-LOY). c Gene Ontology (GO) enrichment of top differentially expressed genes. Boxplots show the interquartile range, while error bars represent the spread of data around the median.
Fig. 5
Fig. 5. Transcriptomic overlap between LOY and SARS-CoV-2.
a Overlap between top differentially expressed genes in individuals with LOY and deregulated genes in SARS-CoV-2 infected cells. Panels b, c and d show detailed gene expression patterns of some of these overlapping genes, including down-regulated in individuals with LOY (b), and over-expressed in NHBE (c) and A549 (d) cell lines infected with SARS-CoV-2. Boxplots show the interquartile range, while error bars represent the spread of data around the median.

References

    1. Zhou P, et al. A pneumonia outbreak associated with a new coronavirus of probable bat origin. Nature. 2020;579:270–273. doi: 10.1038/s41586-020-2012-7. - DOI - PMC - PubMed
    1. Verity R, et al. Estimates of the severity of coronavirus disease 2019: a model-based analysis. Lancet Infect. Dis. 2020;20:669–677. doi: 10.1016/S1473-3099(20)30243-7. - DOI - PMC - PubMed
    1. Williamson EJ, et al. Factors associated with COVID-19-related death using OpenSAFELY. Nature. 2020;584:430–436. doi: 10.1038/s41586-020-2521-4. - DOI - PMC - PubMed
    1. Leong H-N, et al. SARS in Singapore-predictors of disease severity. Ann. Acad. Med. Singap. 2006;35:326–331. doi: 10.47102/annals-acadmedsg.V35N5p326. - DOI - PubMed
    1. Alghamdi IG, et al. The pattern of Middle east respiratory syndrome coronavirus in Saudi Arabia: A descriptive epidemiological analysis of data from the Saudi Ministry of Health. Int. J. Gen. Med. 2014;7:417–423. doi: 10.2147/IJGM.S67061. - DOI - PMC - PubMed

Publication types