

The frequency of pathogenic variation in the All of Us cohort reveals ancestry-driven disparities
- PMID: 38374434
- PMCID: PMC10876563
- DOI: 10.1038/s42003-023-05708-y
The frequency of pathogenic variation in the All of Us cohort reveals ancestry-driven disparities
Erratum in
-
Author Correction: The frequency of pathogenic variation in the All of Us cohort reveals ancestry-driven disparities.Commun Biol. 2024 Jun 10;7(1):713. doi: 10.1038/s42003-024-06408-x. Commun Biol. 2024. PMID: 38858496 Free PMC article. No abstract available.
Abstract
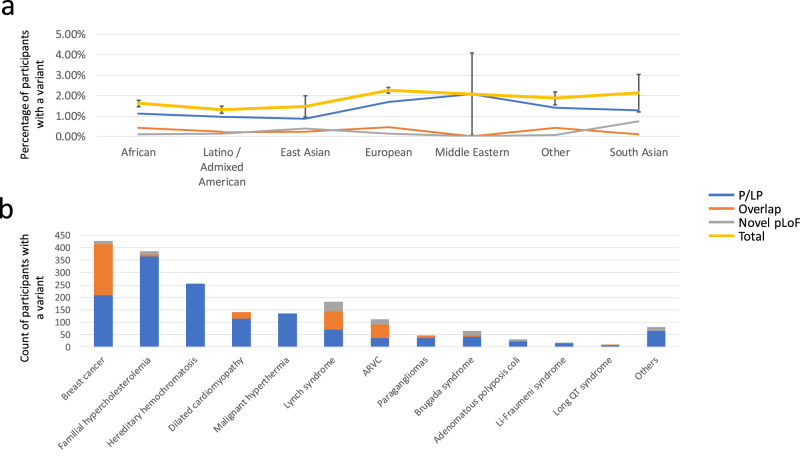
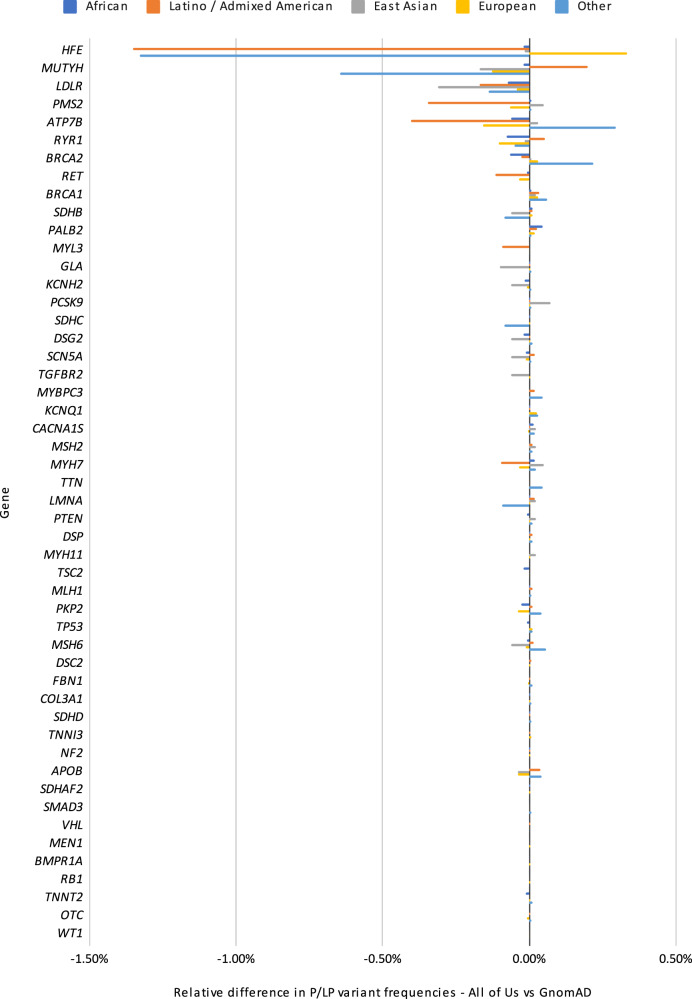
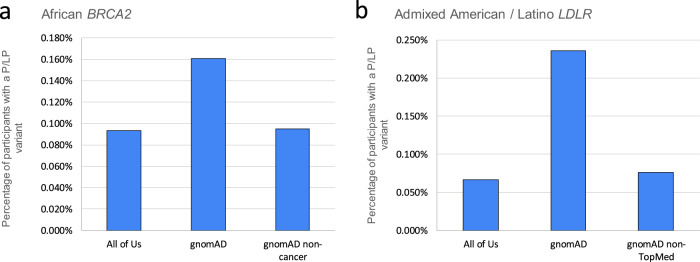
Disparities in data underlying clinical genomic interpretation is an acknowledged problem, but there is a paucity of data demonstrating it. The All of Us Research Program is collecting data including whole-genome sequences, health records, and surveys for at least a million participants with diverse ancestry and access to healthcare, representing one of the largest biomedical research repositories of its kind. Here, we examine pathogenic and likely pathogenic variants that were identified in the All of Us cohort. The European ancestry subgroup showed the highest overall rate of pathogenic variation, with 2.26% of participants having a pathogenic variant. Other ancestry groups had lower rates of pathogenic variation, including 1.62% for the African ancestry group and 1.32% in the Latino/Admixed American ancestry group. Pathogenic variants were most frequently observed in genes related to Breast/Ovarian Cancer or Hypercholesterolemia. Variant frequencies in many genes were consistent with the data from the public gnomAD database, with some notable exceptions resolved using gnomAD subsets. Differences in pathogenic variant frequency observed between ancestral groups generally indicate biases of ascertainment of knowledge about those variants, but some deviations may be indicative of differences in disease prevalence. This work will allow targeted precision medicine efforts at revealed disparities.
© 2024. The Author(s).
Conflict of interest statement
E.V. owns shares in Codified Genomics, a provider of genetic interpretation software. All BCM-affiliated authors declare that Baylor Genetics is a BCM affiliate that derives revenue from genetic testing. All other authors declare no competing interests.
Figures
References
Publication types
MeSH terms
Grants and funding
- OT2 OD026556/OD/NIH HHS/United States
- U2C OD023196/OD/NIH HHS/United States
- OT2 OD025315/OD/NIH HHS/United States
- OT2 OD026551/OD/NIH HHS/United States
- OT2 OD026552/OD/NIH HHS/United States
- OT2 OD026549/OD/NIH HHS/United States
- OT2 OD025337/OD/NIH HHS/United States
- OT2 OD025277/OD/NIH HHS/United States
- OT2 OD026555/OD/NIH HHS/United States
- OT2 OD026550/OD/NIH HHS/United States
- OT2 OD026553/OD/NIH HHS/United States
- OT2 OD023205/OD/NIH HHS/United States
- OT2 OD025276/OD/NIH HHS/United States
- OT2 OD026557/OD/NIH HHS/United States
- OT2 OD026554/OD/NIH HHS/United States
- U24 OD023163/OD/NIH HHS/United States
- OT2 OD023206/OD/NIH HHS/United States
- U24 OD023176/OD/NIH HHS/United States
- OT2 OD026548/OD/NIH HHS/United States
- U24 OD023121/OD/NIH HHS/United States
- P50 HD103538/HD/NICHD NIH HHS/United States
