. 2024 Mar;16(3):506-522.
doi: 10.1038/s44321-024-00038-w. Epub 2024 Feb 19.

mGluR7 allosteric modulator AMN082 corrects protein synthesis and pathological phenotypes in FXS

Affiliations

mGluR7 allosteric modulator AMN082 corrects protein synthesis and pathological phenotypes in FXS

Vipendra Kumar et al. EMBO Mol Med. 2024 Mar.

Abstract

Fragile X syndrome (FXS) is the leading cause of inherited autism and intellectual disabilities. Aberrant protein synthesis due to the loss of fragile X messenger ribonucleoprotein (FMRP) is the major defect in FXS, leading to a plethora of cellular and behavioral abnormalities. However, no treatments are available to date. In this study, we found that activation of metabotropic glutamate receptor 7 (mGluR7) using a positive allosteric modulator named AMN082 represses protein synthesis through ERK1/2 and eIF4E signaling in an FMRP-independent manner. We further demonstrated that treatment of AMN082 leads to a reduction in neuronal excitability, which in turn ameliorates audiogenic seizure susceptibility in Fmr1 KO mice, the FXS mouse model. When evaluating the animals' behavior, we showed that treatment of AMN082 reduces repetitive behavior and improves learning and memory in Fmr1 KO mice. This study uncovers novel functions of mGluR7 and AMN082 and suggests the activation of mGluR7 as a potential therapeutic approach for treating FXS.

Keywords: Autism; FMRP; FXS; Protein Synthesis; mGluR7.


Conflict of interest statement

The authors declare no competing interests.

Figures

Figure 1
Figure 1. Activation of mGluR7 reduces protein synthesis in both WT and Fmr1 KO neurons.
(A) Representative fluorescence images showing expression of mGluR7a in CA1, CA3, and dentate gyrus (DG) in brain sections obtained from WT, Fmr1 KO, and mGluR7 KO mice at postnatal (P) day 60. (B) Representative western blots and quantification showing the expression of mGluR7a and mGluR7b in total brain lysate from WT and Fmr1 KO mice at P60 (n = 4 mice; p = 0.8946 and 0.3038 for mGluR7a and mGluR7b, respectively). (C) Representative western blots and quantification of mGluR7a, mGluR7b, and surface protein marker N-Cadherin from total cell lysates or extracted surface protein fractions in primary cortical neuron cultures made from WT or Fmr1 KO mice (n = 6 independent cultures; p = 0.0387 and 0.0463 for mGluR7a and mGluR7b, respectively). (D) Representative western blots and quantifications of puromycin and GAPDH from WT and Fmr1 KO cortical neuron cultures at DIV 12–14 treated with DMSO, AMN082 (1 µM), or MMPIP (1 µM) for 2 h followed by treatment of puromycin (10 µg/ml) to label newly synthesized protein for another hour. (n = 7 and 6 for WT and Fmr1 KO, respectively) (WT + DMSO vs WT + AMN082, p = 0.0285; WT + DMSO vs WT + MMPIP, p = 0.9141; WT + DMSO vs Fmr1KO + DMSO, p < 0.0001; Fmr1KO + DMSO vs Fmr1KO + AMN082, p < 0.0001; Fmr1KO + DMSO vs Fmr1KO + MMPIP, p = 0.3435). (E) Representative western blots and quantifications of puromycin and GAPDH from mGluR7 KO cortical neuron cultures at DIV 12–14 treated with DMSO, AMN082 (1 µM), or MMPIP (1 µM) for 2 h followed by treatment of puromycin (10 µg/ml). A set of blots showing the levels of mGluR7a and mGluR7b in WT and mGluR7 KO cultures is on the right (n = 4) (DMSO vs AMN082, p = 0.732; DMSO vs MMPIP, p = 0.6935). (FI) Representative western blots and quantifications of ERK1/2 phosphorylation, mTOR phosphorylation, eIF4E phosphorylation and eIF2α phosphorylation from WT and Fmr1 KO cortical neuron cultures at DIV 12–14 treated with DMSO or AMN082 (1 µM) for 2 h. For the quantification, phosphorylation signal of a specific protein was normalized to its total protein signal. (n = 3–5 independent cultures) (F) WT + DMSO vs WT + AMN082, p = 0.0339; WT + DMSO vs Fmr1KO + DMSO, p = 0.0017; Fmr1KO + DMSO vs Fmr1KO + AMN082, p < 0.0001. (G) WT + DMSO vs WT + AMN082, p = 0.9571; WT + DMSO vs Fmr1KO + DMSO, p = 0.4032; Fmr1KO + DMSO vs Fmr1KO + AMN082, p = 0.7514. (H) WT + DMSO vs WT + AMN082, p = 0.0074; WT + DMSO vs Fmr1KO + DMSO, p = 0.8646; Fmr1KO + DMSO vs Fmr1KO + AMN082, p = 0.0005. (I) WT + DMSO vs WT + AMN082, p = 0.7174; WT + DMSO vs Fmr1KO + DMSO, p = 0.8258; Fmr1KO + DMSO vs Fmr1KO + AMN082, p = 0.4377). (J) Representative western blots and quantification of eIF4E and eIF4G pulled down by m7GTP beads from WT and Fmr1 KO cortical neuron cultures treated with DMSO or AMN082 (1 µM) at DIV 12–14 (n = 4 independent cultures) (WT + DMSO vs WT + AMN082, p = 0.0249; WT + DMSO vs Fmr1KO + DMSO, p = 0.7503; Fmr1KO + DMSO vs Fmr1KO + AMN082, p = 0.0038). Data Information: Data were analyzed by Student’s t-test (B, C), one-way ANOVA (E), or two-way ANOVA (D, FJ) with Tukey test and presented as mean ± SEM with *p < 0.05, **p < 0.01, ***p < 0.001, ****p < 0.0001 and NS: non-significant. Source data are available online for this figure.
Figure 2
Figure 2. mGluR7 activation represses protein synthesis and phosphorylation of ERK1/2 and eIF4E in WT and Fmr1 KO mouse hippocampus.
(A) Representative western blots (left) and quantification (right) of puromycin and GAPDH in the hippocampus of 6–8-week-old WT and Fmr1 KO mice injected with saline or AMN082 (1 mg/kg) and puromycin (200 mg/kg) for 1 h. (n = 4 mice per treatment group) (WT+Saline vs WT + AMN082, p = 0.0463; WT+Saline vs Fmr1KO+Saline, p = 0.0135; Fmr1KO+Saline vs Fmr1KO + AMN082, p = 0.0042). (B) Representative western blots of puromycin and GAPDH in the hippocampus of mGluR7 KO mice injected with saline or AMN082 (1 mg/kg) and puromycin (200 mg/kg) for 1 h (n = 4 mice per treatment group; p = 0.3206). (C, D) Left: representative western blots of p-ERK1/2 and p-eIF4E in hippocampal lysates from WT and Fmr1 KO mice treated with AMN082 (1 mg/kg) for 1 h and the quantification (on right) showing phosphorylated protein levels normalized to their respective total protein levels. (n = 5 mice) (C: WT+Saline vs WT + AMN082, p = 0.0044; WT+Saline vs Fmr1KO+Saline, p < 0.0001; Fmr1KO+Saline vs Fmr1KO + AMN082, p < 0.0001. (D) WT+Saline vs WT + AMN082, p = 0.0028; WT+Saline vs Fmr1KO+Saline, p = 0.9998; Fmr1KO+Saline vs Fmr1KO + AMN082, p = 0.0451). (E) The schematic showing the signaling pathway implicated in the reduction of protein synthesis following the activation of mGluR7. Data Information: Data were analyzed by Student’s t-test (B) or two-way ANOVA with Tukey test (A, C, D) and presented as mean ± SEM with *p < 0.05, **p < 0.01, ****p < 0.0001 and NS: non-significant. Source data are available online for this figure.
Figure 3
Figure 3. Activation of mGluR7 reduces neuronal excitability and susceptibility to audiogenic seizure in Fmr1 KO mice.
(A) Representative raster plots of spontaneous spikes from WT (top) and Fmr1 (bottom) cortical neuron cultures treated with DMSO, AMN082 (1 µM), or MMPIP (1 µM) for 2 h at DIV 12–14. Quantification of burst duration, burst frequency and average number of spikes by comparing “after treatment” to “before treatment”, from the same culture was shown on the right (n = 5 independent cultures). (WT, Burst Duration: DMSO vs AMN082, p < 0.0001; DMSO vs MMPIP, p = 0.9924; Burst Frequency: DMSO vs AMN082, p < 0.0001; DMSO vs MMPIP, p = 0.4762; Average number of spikes: DMSO vs AMN082, p < 0.0001; DMSO vs MMPIP, p = 0.1294. Fmr1 KO: Burst Duration: DMSO vs AMN082, p < 0.0001; DMSO vs MMPIP, p = 0.1751; Burst Frequency: DMSO vs AMN082, p < 0.0001; DMSO vs MMPIP, p = 0.5922; Average number of spikes: DMSO vs AMN082, p < 0.0001; DMSO vs MMPIP, p = 0.8932). (B) Left: Representative traces of action potentials induced by 200 pA from wild-type (top) or Fmr1 KO (bottom) cortical neurons treated with DMSO or AMN082 (1 µM) for 2 h. Right: Average action potential firing rates (Hz) evoked by 0–200 pA injection from wild-type (top) or Fmr1 KO (bottom) neurons treated with DMSO or AMN082 (1 µM) (n = 12–14 neurons per treatment group) (WT: p values for current stimulations between 140 pA and 200 pA are 0.0477, 0.0335, 0.0438, 0.0424, 0.0359, 0.0317, and 0.0348. Fmr1 KO: p values for current stimulations between 140 pA and 200 pA are 0.0314, 0.0319, 0.0494, 0.0287, 0.0450, 0.0245, and 0.0266). (C) A schematic showing the experimental design for audiogenic seizure in Fmr1 KO mice (top). Quantification of seizure scores after Fmr1 KO mice were injected with saline or AMN082 (1 mg/kg) for 30 min (bottom) (n = 6 per treatment group; p = 0.0281). Data Information: Data were analyzed by one-way ANOVA with Tukey test (A, B) or two-tailed Mann–Whitney test (C) and presented as mean ± SEM with *p < 0.05, ****p < 0.0001 and NS: non-significant. Source data are available online for this figure.
Figure 4
Figure 4. Activation of mGluR7 ameliorates repetitive behavior without affecting locomotor activity or sociability in Fmr1 KO mice.
(A) Representative images of the marbles’ configuration before and after allowing mice to bury marbles for 30 min (left). WT or Fmr1 KO mice were intraperitoneally injected with saline or AMN082 (1 mg/kg) for 1 h before the test. Quantification of the marble burying activity is shown on the right (n = 10 mice per treatment group) (WT+Saline vs WT + AMN082, p = 0.9791; WT+Saline vs Fmr1KO+Saline, p = 0.0004; Fmr1KO+Saline vs Fmr1KO + AMN082, p = 0.0008). (B) Representative traces from a 5-min test period in an open-field arena (left) showing the movement of WT or Fmr1 KO mice after intraperitoneally injected with saline or AMN082 (1 mg/kg) for 1 h. Quantification of total distance traveled, immobile time and time spent in central zone is shown on the right (n = 10 mice per treatment group) (Distance traveled: WT+Saline vs WT + AMN082, p = 0.9961; WT+Saline vs Fmr1KO+Saline, p = 0.1124; Fmr1KO+Saline vs Fmr1KO + AMN082, p = 0.5765. Immobile time: WT+Saline vs WT + AMN082, p = 0.8525; WT+Saline vs Fmr1KO+Saline, p = 0.1211; Fmr1KO+Saline vs Fmr1KO + AMN082, p = 0.9636. Time in zone: WT+Saline vs WT + AMN082, p = 0.6004; WT+Saline vs Fmr1KO+Saline, p = 0.0482; Fmr1KO+Saline vs Fmr1KO + AMN082, p = 0.9786). (C) The three-chamber social interaction test from WT or Fmr1 KO mice after intraperitoneally injected with saline or AMN082 (1 mg/kg) for 1 h. Schematic representation depicting the sociability protocol for the three-chamber social interaction test was also shown (n = 10 mice per treatment group) (WT+Saline, p < 0.0001; WT + AMN082, p < 0.0001, Fmr1KO+Saline, p = 0.0009, and Fmr1KO + AMN082, p < 0.0001). Data Information: Data were analyzed by two-way ANOVA with Tukey’s or Šidák’s test and presented as mean ± SEM with *p < 0.05, **p < 0.01, ***p < 0.001 and NS: non-significant. Source data are available online for this figure.
Figure 5
Figure 5. Activation of mGluR7 improves learning and memory in Fmr1 KO mice.
(A) A schematic showing the novel object recognition test paradigm (top) and the quantification of preference index from WT or Fmr1 KO mice after intraperitoneally injected with saline or AMN082 (1 mg/kg) for 1 h (bottom) (n = 10 mice per treatment group) (WT+Saline vs WT + AMN082, p = 0.9999; WT+Saline vs Fmr1KO+Saline, p = 0.0008; Fmr1KO+Saline vs Fmr1KO + AMN082, p = 0.0002). (B) A schematic depiction of contextual fear conditioning test paradigm (top) and quantification of the freezing behavior of WT or Fmr1 KO mice after intraperitoneally injected with saline or AMN082 (1 mg/kg) for 1 h (bottom) (n = 10 mice per treatment group) (In Shock groups: WT+Saline vs WT + AMN082, p = 0.1642; WT+Saline vs Fmr1KO+Saline, p = 0.0066; Fmr1KO+Saline vs Fmr1KO + AMN082, p = 0.418). (C) A schematic representation of Barnes maze test showing the training trail and probe trial. WT or Fmr1 KO mice intraperitoneally injected with saline or AMN082 (1 mg/kg) were trained for 4 days with 3 consecutive trials every day to locate the escape box (green circle). The escape latency and number of errors during the training trial were quantified. Quadrant occupancy on probe trial on day 5 was assessed by recording the time spent in the target area (yellow area) (n = 10 mice per treatment group) (Escape latency, Day 1: WT+Saline vs WT + AMN082, p = 0.9999; WT+Saline vs Fmr1KO+Saline, p = 0.9999; Fmr1KO+Saline vs Fmr1KO + AMN082, p = 0.9999; Day 2: WT+Saline vs WT + AMN082, p = 0.9999; WT+Saline vs Fmr1KO+Saline, p = 0.9999; Fmr1KO+Saline vs Fmr1KO + AMN082, p = 0.9999; Day 3: WT+Saline vs WT + AMN082, p = 0.9999; WT+Saline vs Fmr1KO+Saline, p = 0.4132; Fmr1KO+Saline vs Fmr1KO + AMN082, p = 0.3069; Day 1: WT+Saline vs WT + AMN082, p = 0.9999; WT+Saline vs Fmr1KO+Saline, p = 0.9953; Fmr1KO+Saline vs Fmr1KO + AMN082, p = 0.7988. Number of errors, Day 1: WT+Saline vs WT + AMN082, p = 0.9999; WT+Saline vs Fmr1KO+Saline, p = 0.9999; Fmr1KO+Saline vs Fmr1KO + AMN082, p = 0.9999; Day 2: WT+Saline vs WT + AMN082, p = 0.9999; WT+Saline vs Fmr1KO+Saline, p = 0.8944; Fmr1KO+Saline vs Fmr1KO + AMN082, p = 0.9999; Day 3: WT+Saline vs WT + AMN082, p = 0.9999; WT+Saline vs Fmr1KO+Saline, p = 0.9999; Fmr1KO+Saline vs Fmr1KO + AMN082, p = 0.4095; Day 4: WT+Saline vs WT + AMN082, p = 0.9999; WT+Saline vs Fmr1KO+Saline, p = 0.9999; Fmr1KO+Saline vs Fmr1KO + AMN082, p = 0.9999. Quadrant occupancy: WT+Saline vs WT + AMN082, p = 0.0676; WT+Saline vs Fmr1KO+Saline, p = 0.8267; Fmr1KO+Saline vs Fmr1KO + AMN082, p = 0.9493). Data Information: Data were analyzed by two-way ANOVA with Tukey’s test and presented as mean ± SEM with *p < 0.05, **p < 0.01, ***p < 0.001 and NS: non-significant. (D) Summary of the effects from activation of mGluR7 on molecular and behavioral deficits in Fmr1 KO mice. Source data are available online for this figure.
Figure EV1
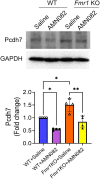
Figure EV1. Activation of mGluR reduced the levels of an Fmrp target protein Pcdh7 in the WT and Fmr1 KO hippocampus.
Top: Representative blot showing expression of Pcdh7 in the hippocampal lysates of 6–8-week-old WT and Fmr1 KO mice injected with saline or AMN082 (1 mg/kg). Bottom: Plot showing the quantification of band intensities of Pcdh7 from 4 independent sets of experiments expressed as fold change. Data were analyzed using Two-way ANOVA with Tukey’s test and presented as mean +/- SEM. WT+Saline vs WT + AMN082, p = 0.0213; WT+Saline vs Fmr1KO+Saline, p = 0.0120; Fmr1KO+Saline vs Fmr1KO + AMN082, p = 0.0021. Source data are available online for this figure.

Similar articles

References

    1. Baker KB, Wray SP, Ritter R, Mason S, Lanthorn TH, Savelieva K., V Male and female Fmr1 knockout mice on C57 albino background exhibit spatial learning and memory impairments. Genes Brain Behav. 2010;9:562–74. - PubMed
    1. Berry-Kravis E, Des Portes V, Hagerman R, Jacquemont S, Charles P, Visootsak J, Brinkman M, Rerat K, Koumaras B, Zhu L, et al. Mavoglurant in fragile X syndrome: Results of two randomized, double-blind, placebo-controlled trials. Sci Transl Med. 2016;8:321. - PubMed
    1. Berry-Kravis E, Hicar M, Ciurlionis R. Reduced cyclic AMP production in fragile X syndrome: cytogenetic and molecular correlations. Pediatr Res. 1995;38:638–643. - PubMed
    1. Berry-Kravis E, Raspa M, Loggin-Hester L, Bishop E, Holiday D, Bailey DB. Seizures in fragile X syndrome: characteristics and comorbid diagnoses. Am J Intellect Dev Disabil. 2010;115:461–472. - PubMed
    1. Berry-Kravis E, Sklena P. Demonstration of abnormal cyclic AMP production in platelets from patients with fragile X syndrome. Am J Med Genet. 1993;45:81–87. - PubMed

MeSH terms

Substances