Optimizing electrode placement for transcranial direct current stimulation in nonsuperficial cortical regions: a computational modeling study
- PMID: 38374912
- PMCID: PMC10874366
- DOI: 10.1007/s13534-023-00335-2
Optimizing electrode placement for transcranial direct current stimulation in nonsuperficial cortical regions: a computational modeling study
Abstract
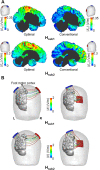
Transcranial direct current stimulation (tDCS) is a noninvasive brain stimulation technique for modulating neuronal excitability by sending a weak current through electrodes attached to the scalp. For decades, the conventional tDCS electrode for stimulating the superficial cortex has been widely reported. However, the investigation of the optimal electrode to effectively stimulate the nonsuperficial cortex is still lacking. In the current study, the optimal tDCS electrode montage that can deliver the maximum electric field to nonsuperficial cortical regions is investigated. Two finite element head models were used for computational simulation to determine the optimal montage for four different nonsuperficial regions: the left foot motor cortex, the left dorsomedial prefrontal cortex (dmPFC), the left medial orbitofrontal cortex (mOFC), and the primary visual cortex (V1). Our findings showed a good consistency in the optimal montage between two models, which led to the anode and cathode being attached to C4-C3 for the foot motor, F4-F3 for the dmPFC, Fp2-F7 for the mOFC, and Oz-Cz for V1. Our suggested montages are expected to enhance the overall effectiveness of stimulation of nonsuperficial cortical areas.
Supplementary information: The online version contains supplementary material available at 10.1007/s13534-023-00335-2.
Keywords: Finite element method; Noninvasive brain stimulation; Nonsuperficial cortical region; Optimal electrode montage; Transcranial direct current stimulation.
© Korean Society of Medical and Biological Engineering 2023. Springer Nature or its licensor (e.g. a society or other partner) holds exclusive rights to this article under a publishing agreement with the author(s) or other rightsholder(s); author self-archiving of the accepted manuscript version of this article is solely governed by the terms of such publishing agreement and applicable law.
Conflict of interest statement
Conflict of interestThe authors declare that they have no competing interests.
Figures


Similar articles
-
State-of-art neuroanatomical target analysis of high-definition and conventional tDCS montages used for migraine and pain control.Front Neuroanat. 2015 Jul 15;9:89. doi: 10.3389/fnana.2015.00089. eCollection 2015. Front Neuroanat. 2015. PMID: 26236199 Free PMC article.
-
Modelling the effect of electrode displacement on transcranial direct current stimulation (tDCS).J Neural Eng. 2018 Feb;15(1):016019. doi: 10.1088/1741-2552/aa8d8a. J Neural Eng. 2018. PMID: 28925375
-
Effects of transcranial stimulating electrode montages over the head for lower-extremity transcranial motor evoked potential monitoring.J Neurosurg. 2017 Jun;126(6):1951-1958. doi: 10.3171/2016.7.JNS16643. Epub 2016 Sep 23. J Neurosurg. 2017. PMID: 27662531
-
Transcranial direct current stimulation in obsessive-compulsive disorder: an update in electric field modeling and investigations for optimal electrode montage.Expert Rev Neurother. 2019 Oct;19(10):1025-1035. doi: 10.1080/14737175.2019.1637257. Epub 2019 Jul 8. Expert Rev Neurother. 2019. PMID: 31244347 Review.
-
A Computational Parcellated Brain Model for Electric Field Analysis in Transcranial Direct Current Stimulation.2020 Aug 6. In: Makarov SN, Noetscher GM, Nummenmaa A, editors. Brain and Human Body Modeling 2020: Computational Human Models Presented at EMBC 2019 and the BRAIN Initiative® 2019 Meeting [Internet]. Cham (CH): Springer; 2021. 2020 Aug 6. In: Makarov SN, Noetscher GM, Nummenmaa A, editors. Brain and Human Body Modeling 2020: Computational Human Models Presented at EMBC 2019 and the BRAIN Initiative® 2019 Meeting [Internet]. Cham (CH): Springer; 2021. PMID: 32966026 Free Books & Documents. Review.
Cited by
-
Multi-physics simulations for investigating the effect of electrode conditions on transscleral ocular iontophoresis for particulate drug delivery into ocular tissues.Biomed Eng Lett. 2024 Feb 12;14(3):439-450. doi: 10.1007/s13534-024-00359-2. eCollection 2024 May. Biomed Eng Lett. 2024. PMID: 38645594 Free PMC article.
References
-
- Ouellet J, et al. Enhancing decision-making and cognitive impulse control with transcranial direct current stimulation (tDCS) applied over the orbitofrontal cortex (OFC): a randomized and sham-controlled exploratory study. J Psychiatr Res. 2015;69:27–34. doi: 10.1016/j.jpsychires.2015.07.018. - DOI - PubMed
LinkOut - more resources
Full Text Sources
Miscellaneous
