

Identification of molecular subtypes and diagnostic model in clear cell renal cell carcinoma based on collagen-related genes may predict the response of immunotherapy
- PMID: 38375034
- PMCID: PMC10875022
- DOI: 10.3389/fphar.2024.1325447
Identification of molecular subtypes and diagnostic model in clear cell renal cell carcinoma based on collagen-related genes may predict the response of immunotherapy
Abstract
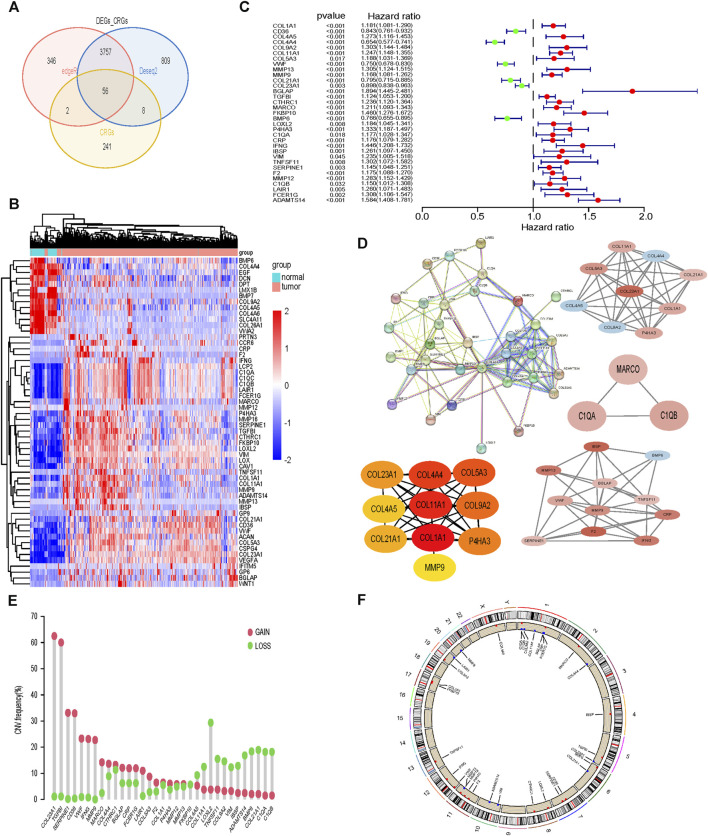
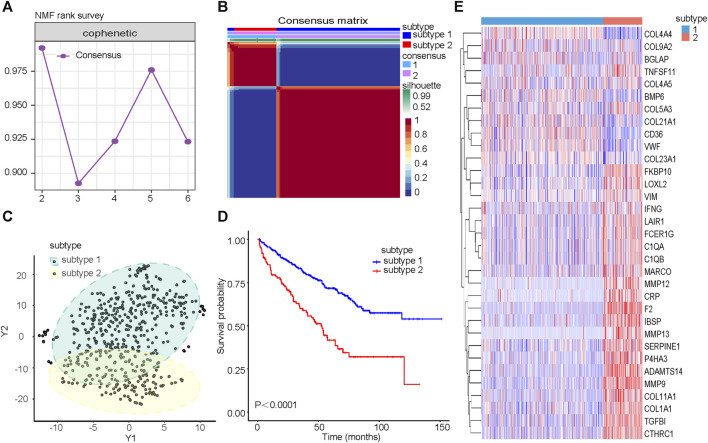
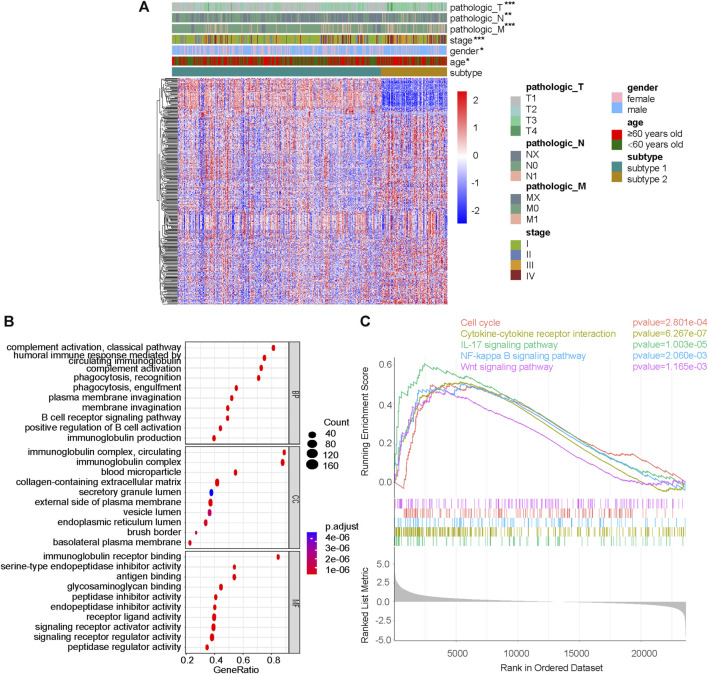
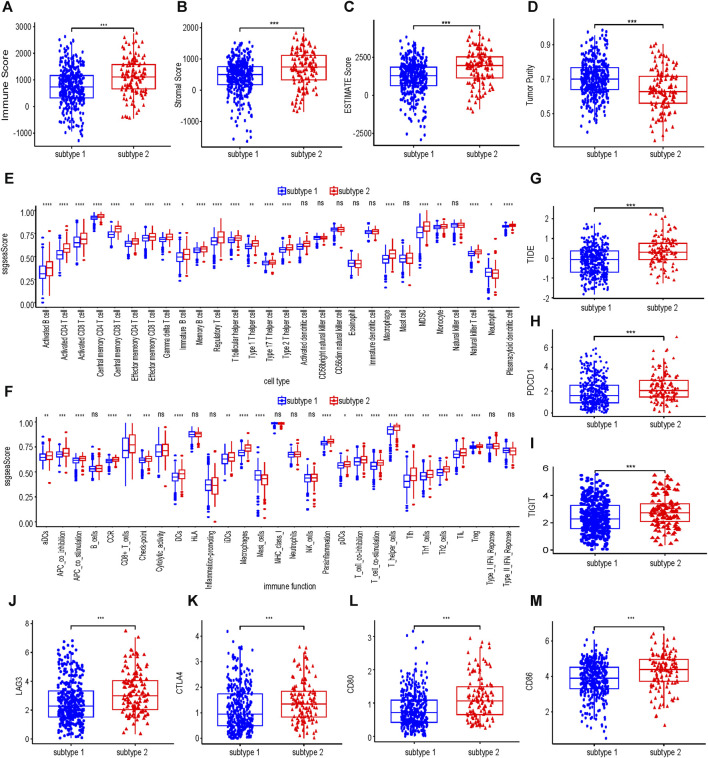
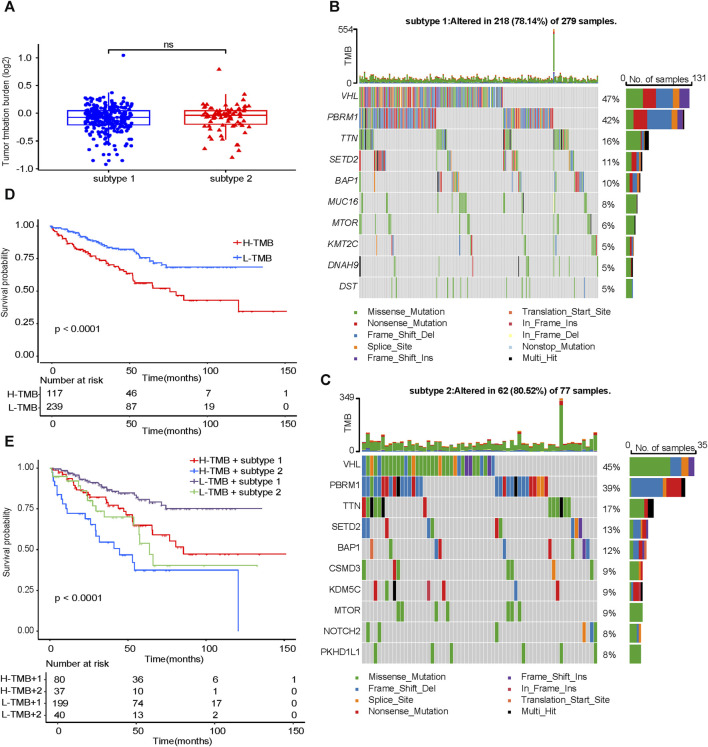
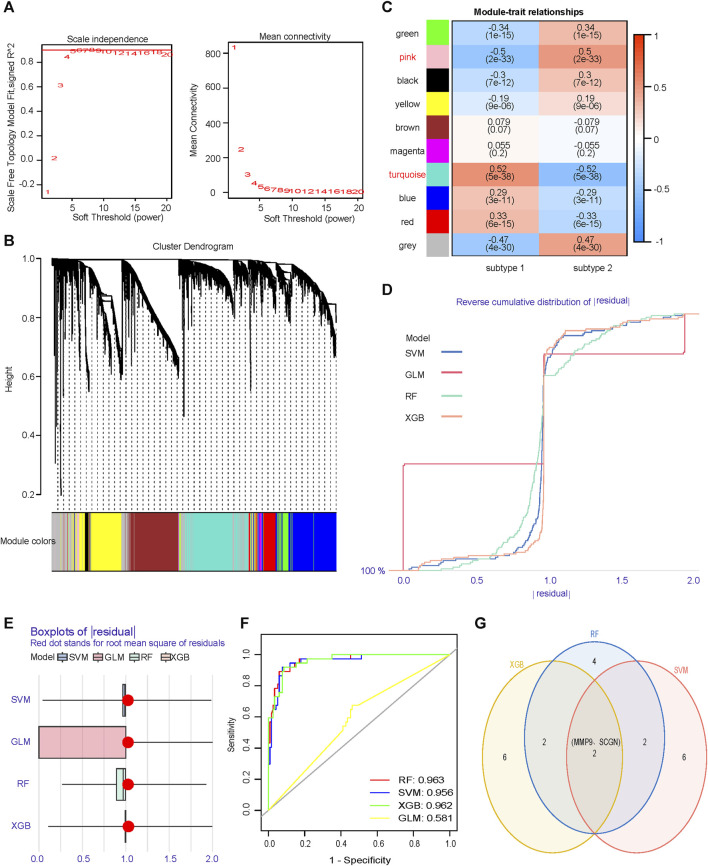
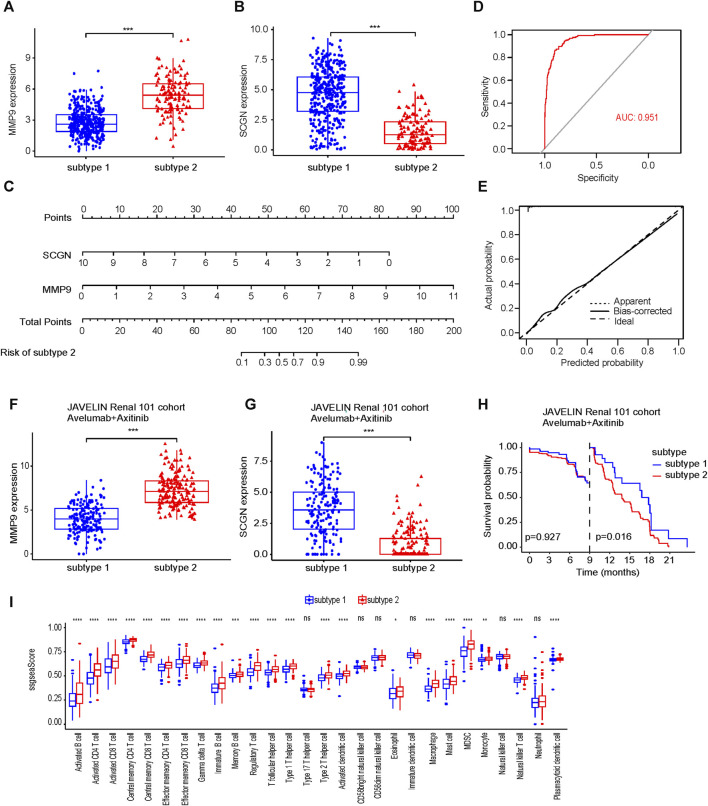
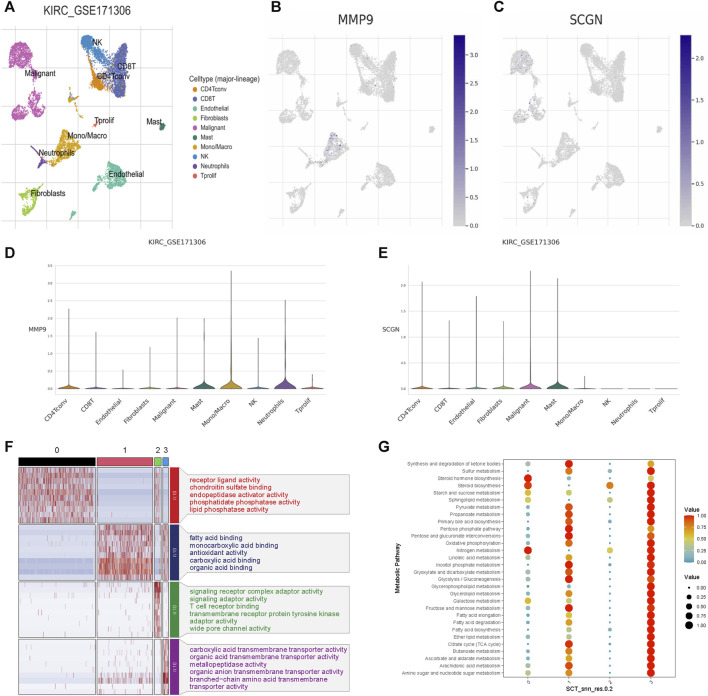
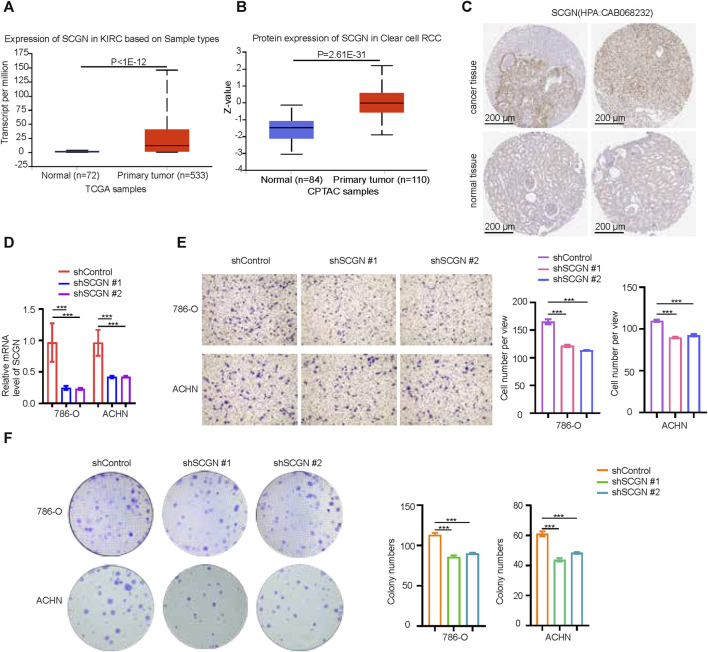
Background: Collagen represents a prominent constituent of the tumor's extracellular matrix (ECM). Nonetheless, its correlation with the molecular subtype attributes of clear cell renal cell carcinoma (ccRCC) remains elusive. Our objective is to delineate collagen-associated molecular subtypes and further construct diagnostic model, offering insights conducive to the precise selection of ccRCC patients for immunotherapeutic interventions. Methods: We performed unsupervised non-negative matrix factorization (NMF) analysis on TCGA-KIRC samples, utilizing a set of 33 collagen-related differentially expressed genes (33CRDs) for clustering. Our analysis encompassed evaluations of subtype-associated differences in pathways, immune profiles, and somatic mutations. Through weighted gene co-expression network analysis (WGCNA) and four machine learning algorithms, two core genes were found and a diagnostic model was constructed. This was subsequently validated in a clinical immunotherapy cohort. Single cell sequencing analysis and experiments demonstrated the role of core genes in ccRCC. Finally, we also analyzed the roles of MMP9 and SCGN in pan-cancer. Results: We described two novel collagen related molecular subtypes in ccRCC, designated subtype 1 and subtype 2. Compared with subtype 1, subtype 2 showed more infiltration of immune components, but had a higher TIDE (tumor immunedysfunctionandexclusion) score and increased levels of immune checkpoint molecules. Furthermore, reduced prognosis for subtype 2 was a consistent finding in both high and low mutation load subgroups. MMP9 and SCGN were identified as key genes for distinguishing subtype 1 and subtype 2. The diagnostic model based on them could better distinguish the subtype of patients, and the differentiated patients had different progression free survival (PFS) in the clinical immunotherapy cohort. MMP9 was predominantly expressed in macrophages and has been extensively documented in the literature. Meanwhile, SCGN, which was overexpressed in tumor cells, underwent experimental validation, emphasizing its role in ccRCC. In various cancers, MMP9 and SCGN were associated with immune-related molecules and immune cells. Conclusion: Our study identifies two collagen-related molecular subtypes of ccRCC and constructs a diagnostic model to help select appropriate patients for immunotherapy.
Keywords: clear cell renal cell carcinoma; collagen; diagnostic model; immunotherapy; machine learning; molecular subtypes.
Copyright © 2024 Hong, Lv, Xing, Xu, Chand, Wang and Li.
Conflict of interest statement
The authors declare that the research was conducted in the absence of any commercial or financial relationships that could be construed as a potential conflict of interest.
Figures
Similar articles
-
Neutrophil extracellular traps-associated modification patterns depict the tumor microenvironment, precision immunotherapy, and prognosis of clear cell renal cell carcinoma.Front Oncol. 2022 Dec 22;12:1094248. doi: 10.3389/fonc.2022.1094248. eCollection 2022. Front Oncol. 2022. PMID: 36620592 Free PMC article.
-
Construction of an interferon regulatory factors-related risk model for predicting prognosis, immune microenvironment and immunotherapy in clear cell renal cell carcinoma.Front Oncol. 2023 Apr 27;13:1131191. doi: 10.3389/fonc.2023.1131191. eCollection 2023. Front Oncol. 2023. PMID: 37182129 Free PMC article.
-
Identification of Hypoxia-Related Subtypes, Establishment of Prognostic Models, and Characteristics of Tumor Microenvironment Infiltration in Colon Cancer.Front Genet. 2022 Jun 17;13:919389. doi: 10.3389/fgene.2022.919389. eCollection 2022. Front Genet. 2022. PMID: 35783281 Free PMC article.
-
EMILIN2 is associated with prognosis and immunotherapy in clear cell renal cell carcinoma.Front Genet. 2022 Dec 5;13:1058207. doi: 10.3389/fgene.2022.1058207. eCollection 2022. Front Genet. 2022. PMID: 36544490 Free PMC article.
-
ISPRF: a machine learning model to predict the immune subtype of kidney cancer samples by four genes.Transl Androl Urol. 2021 Oct;10(10):3773-3786. doi: 10.21037/tau-21-650. Transl Androl Urol. 2021. PMID: 34804821 Free PMC article.
Cited by
-
The role of various collagen types in tumor biology: a review.Front Oncol. 2025 Mar 5;15:1549797. doi: 10.3389/fonc.2025.1549797. eCollection 2025. Front Oncol. 2025. PMID: 40110201 Free PMC article. Review.
-
Machine Learning-Based Pathomics Model to Predict the Prognosis in Clear Cell Renal Cell Carcinoma.Technol Cancer Res Treat. 2024 Jan-Dec;23:15330338241307686. doi: 10.1177/15330338241307686. Technol Cancer Res Treat. 2024. PMID: 39703069 Free PMC article.
-
Versatile roles of annexin A4 in clear cell renal cell carcinoma: Impact on membrane repair, transcriptional signatures, and composition of the tumor microenvironment.iScience. 2025 Mar 11;28(4):112198. doi: 10.1016/j.isci.2025.112198. eCollection 2025 Apr 18. iScience. 2025. PMID: 40212597 Free PMC article.
-
Identification of Molecular Subtypes of Clear-Cell Renal Cell Carcinoma in Patient-Derived Xenografts Using Multi-Omics.Cancers (Basel). 2025 Apr 18;17(8):1361. doi: 10.3390/cancers17081361. Cancers (Basel). 2025. PMID: 40282537 Free PMC article.
References
LinkOut - more resources
Full Text Sources
Miscellaneous