

Neuronal correlates of intensification and acceptance of symptoms during exposure therapy in patients with obsessive-compulsive disorder
- PMID: 38375106
- PMCID: PMC10875107
- DOI: 10.3389/fpsyg.2024.1256046
Neuronal correlates of intensification and acceptance of symptoms during exposure therapy in patients with obsessive-compulsive disorder
Abstract
Introduction: Cognitive behaviour therapy with exposure and response prevention is efficient in treating patients with obsessive-compulsive disorder (OCD). Nevertheless, it would be helpful for many patients to complement the therapeutic treatment with acceptance strategies to further increase the therapeutic benefit. The aim of the present study was to examine neurobiological responses to acceptance and intensification strategies during symptom provocation alongside the psychotherapeutic process.
Method: A total of 23 patients diagnosed with OCD (subtype: washing/contamination fear) was instructed to utilise either an acceptance strategy (ACS) or an intensification strategy (INS) to cope with their emotional and cognitive reactions to personalised symptom-triggering and neutral pictures. Fourteen patients participated twice: at the beginning [T1] and at the end [T2] of an inpatient multimodal treatment including cognitive behaviour therapy with response prevention to assess functional variations.
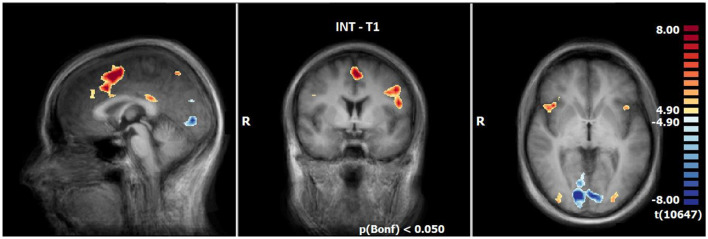
Results: For the contrast of T1 and T2, ACS showed increased brain activity in the left inferior frontal gyrus (IFG), left caudate body, and posterior cingulate gyrus (PCC). They also showed decreased activity in the left anterior insula. INS showed decreased activation in right lingual gyrus and right caudate body. At T2, ACS showed increased activation compared to INS in the left cerebrum: IFG, caudate nucleus, middle and superior temporal gyrus, and PCC/cuneus. For the comparison of T1 and T2, the ACS revealed increased brain activity in the left IFG, left caudate body, and right inferior parietal lobe. It showed decreased activity in the left anterior insula. The INS revealed decreased activity in right lingual gyrus and right caudate body.The psychometric questionnaires suggested that patients were able to reduce obsession, compulsion, and depression symptoms. Furthermore, patients rated the ACS as more useful for themselves compared with the INS.
Conclusion: The increased left IFG activity using ACS (T1 vs. T2) could be interpreted as a better inhibitory top-down process, while the increased PCC response might be due to a better reappraisal strategy after therapy. ACS seems to mobilise neuronal activations under therapy, especially in the left hemisphere. Both strategies showed reductions in emotional networks as a neuronal correlate of therapy success. Overall, ACS may be more efficient than INS, as rated by the patients and as in accordance with neurobiological findings.
Keywords: acceptance strategy; exposure therapy; fMRI; neuroscience; obsessive-compulsive disorder.
Copyright © 2024 Karch, Maywald, Schwartz, Heil, Neumüller, Keeser, Garcia, Tschentscher, Pogarell, Paolini and Voderholzer.
Conflict of interest statement
The authors declare that the research was conducted in the absence of any commercial or financial relationships that could be construed as a potential conflict of interest.
Figures


References
-
- American Psychiatric Association . (2013). Diagnostic and statistical manual of mental disorders (5th ed.). London: American Psychiatric Pub.
LinkOut - more resources
Full Text Sources