. 2024 Feb 5:13:1313735.
doi: 10.3389/fonc.2023.1313735. eCollection 2023.

Loss of symbiotic and increase of virulent bacteria through microbial networks in Lynch syndrome colon carcinogenesis

Affiliations

Loss of symbiotic and increase of virulent bacteria through microbial networks in Lynch syndrome colon carcinogenesis

Mohammad Sadeghi et al. Front Oncol. .

Abstract

Purpose: Through a pilot study, we performed whole gut metagenomic analysis in 17 Lynch syndrome (LS) families, including colorectal cancer (CRC) patients and their healthy first-degree relatives. In a second asymptomatic LS cohort (n=150) undergoing colonoscopy-screening program, individuals with early precancerous lesions were compared to those with a normal colonoscopy. Since bacteria are organized into different networks within the microbiota, we compared related network structures in patients and controls.

Experimental design: Fecal prokaryote DNA was extracted prior to colonoscopy for whole metagenome (n=34, pilot study) or 16s rRNA sequencing (validation study). We characterized bacteria taxonomy using Diamond/MEGAN6 and DADA2 pipelines and performed differential abundances using Shaman website. We constructed networks using SparCC inference tools and validated the construction's accuracy by performing qPCR on selected bacteria.

Results: Significant differences in bacterial communities in LS-CRC patients were identified, with an enrichment of virulent bacteria and a depletion of symbionts compared to their first-degree relatives. Bacteria taxa in LS asymptomatic individuals with colonic precancerous lesions (n=79) were significantly different compared to healthy individuals (n=71). The main bacterial network structures, constructed based on bacteria-bacteria correlations in CRC (pilot study) and in asymptomatic precancerous patients (validation-study), showed a different pattern than in controls. It was characterized by virulent/symbiotic co-exclusion in both studies and illustrated (validation study) by a higher Escherichia/Bifidobacterium ratio, as assessed by qPCR.

Conclusion: Enhanced fecal virulent/symbiotic bacteria ratios influence bacterial network structures. As an early event in colon carcinogenesis, these ratios can be used to identify asymptomatic LS individual with a higher risk of CRC.

Keywords: Lynch syndrome; cancer; colorectal cancer; gut microbiota; microbial network inference.


Conflict of interest statement

The authors declare that the research was conducted in the absence of any commercial or financial relationships that could be construed as a potential conflict of interest.

Figures

Figure 1
Figure 1
Fresh stool samples were collected prior to colonoscopy, surgery and/or chemotherapy. Bacterial DNA was extracted from the collected stools and submitted to whole-genome shotgun sequencing. After trimming the reads, they were aligned to the non-redundant protein database (nr) using the Diamond software. Taxonomical profiling was obtained using MEGAN6. Principal Coordinate Analysis (PCoA) was performed at the genus level using the SHAMAN website.
Figure 2
Figure 2
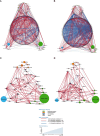
In the gut microbiota analysis of LS-CRC patients (A, C) and their healthy first-degree relatives (B, D), networks were constructed based on significant bacterial correlations. In Figures (A, B), all bacteria, regardless of their prevalence, were included in the network construction. However, in Figures (C, D), only bacteria with a prevalence of 30% or more were included. In these network visualizations, each node represents a bacterium, and the size of the node is proportional to its average abundance in the studied population. The edges between nodes represent correlations with other bacteria, where colors design the direction of the correlation; red indicates positive correlations (co-occurrence) and blue indicates negative correlations (co-exclusion). The width of the edges corresponds to the value of the correlation coefficient, reflecting the strength of the correlation between bacteria.
Figure 3
Figure 3
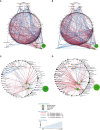
In all figures, each node represents a bacterium, and its size is proportional to its average abundance in the studied population. The edges between the nodes represent correlation of the relative abundance of the bacteria. Positive correlations (co-occurrence) are shown in red, while negative correlations (co-exclusion) are shown in blue. The width of the edges indicates the value of the correlation coefficient, providing an indication of the strength of the correlation. (A, B) depict the bacterial networks of fecal bacteria in LS individuals presenting with and without precancerous lesions during colonoscopy, respectively. In both figures, all bacteria were included in the analysis. (C, D) represent the bacterial networks in LS individuals with and without precancerous lesions, respectively. These figures include only those bacteria with a prevalence of 50% or more.
Figure 4
Figure 4
Fecal bacteria quantification in asymptomatic LS individuals according to colonoscopy and pathology findings. Abundances of all bacteria (represented by consensus sequences) as well as Bifidobacterium and Escherichia coli were determined using real-time qPCR with targeted primers in 51 individuals with precancerous lesion (blue; designed as Yes) and in 49 without precancerous lesion (orange; designed as No) observed during colonoscopy. The quantification of Bifidobacterium and Escherichia coli levels was normalized and reported as log (Bifidobacterium -all bacteria and Escherichia -all bacteria) per gram of stool. These values were normalized with respect to the quantity of all bacterial DNA present in the samples.

Similar articles

Cited by

References

    1. Bray F, Ferlay J, Soerjomataram I, Siegel RL, Torre LA, Jemal A. Global cancer statistics 2018: GLOBOCAN estimates of incidence and mortality worldwide for 36 cancers in 185 countries. CA Cancer J Clin (2018) 68:394–424. doi: 10.3322/caac.21492 - DOI - PubMed
    1. Henrikson NB, Webber EM, Goddard KA, Scrol A, Piper M, Williams MS, et al. . Family history and the natural history of colorectal cancer: systematic review. Genet Med (2015) 17:702–12. doi: 10.1038/gim.2014.188 - DOI - PMC - PubMed
    1. Chen Y, Zhou J, Wang L. Role and mechanism of gut microbiota in human disease. Front Cell Infect Microbiol (2021) 11:625913. doi: 10.3389/fcimb.2021.625913 - DOI - PMC - PubMed
    1. Irrazábal T, Belcheva A, Girardin SE, Martin A, Philpott DJ. The multifaceted role of the intestinal microbiota in colon cancer. Mol Cell (2014) 54:309–20. doi: 10.1016/j.molcel.2014.03.039 - DOI - PubMed
    1. Jiao S, Peters U, Berndt S, Brenner H, Butterbach K, Caan BJ, et al. . Estimating the heritability of colorectal cancer. Hum Mol Genet (2014) 23:3898–905. doi: 10.1093/hmg/ddu087 - DOI - PMC - PubMed