. 2024 Feb 5;27(3):109134.
doi: 10.1016/j.isci.2024.109134. eCollection 2024 Mar 15.

The mechanisms and therapeutic potential of clopidogrel in mitigating diabetic cardiomyopathy in db/db mice

Affiliations

The mechanisms and therapeutic potential of clopidogrel in mitigating diabetic cardiomyopathy in db/db mice

Bing Li et al. iScience. .

Abstract

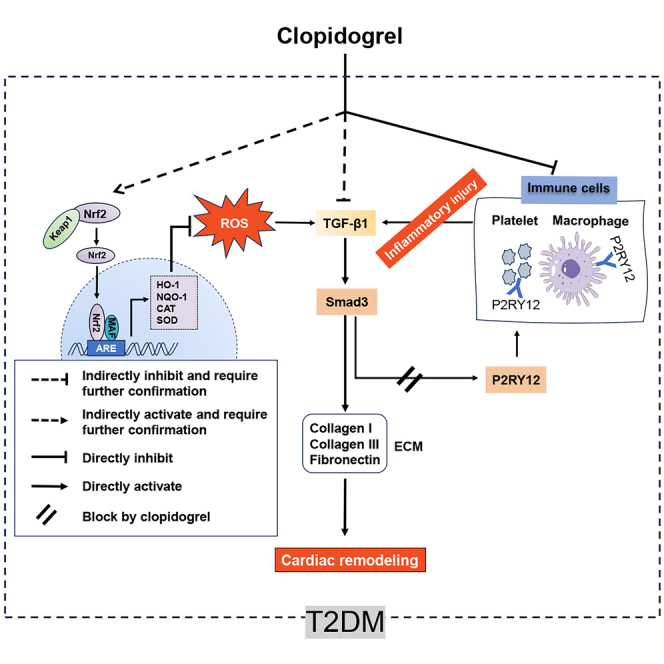
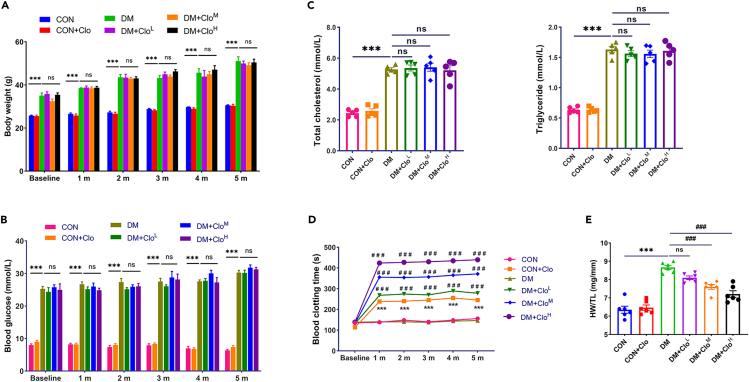
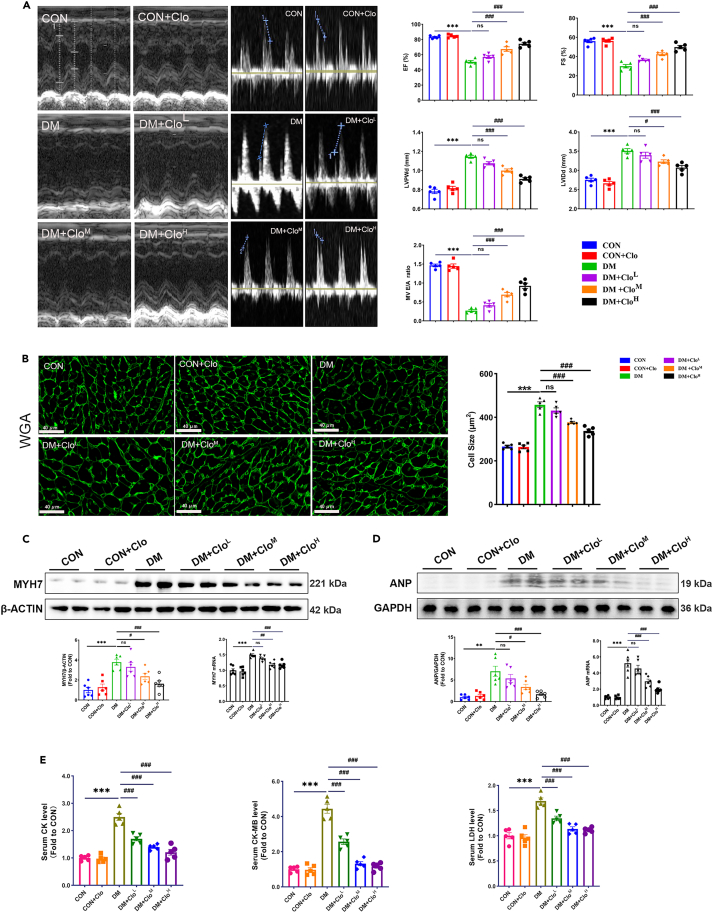
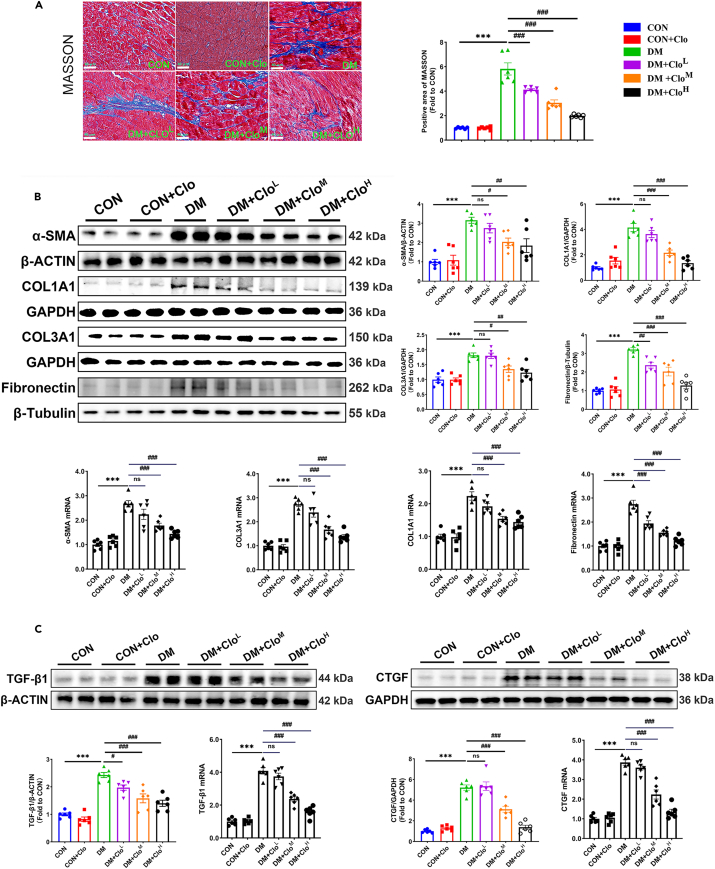
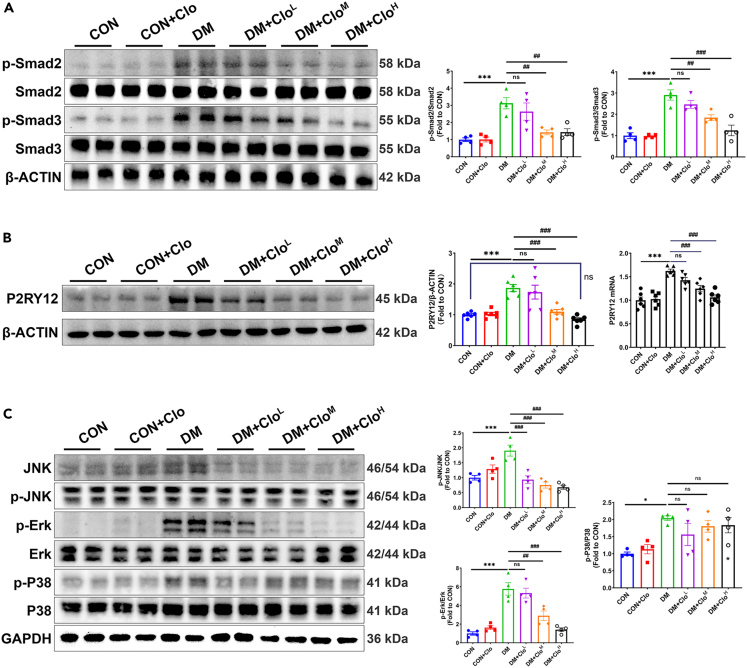
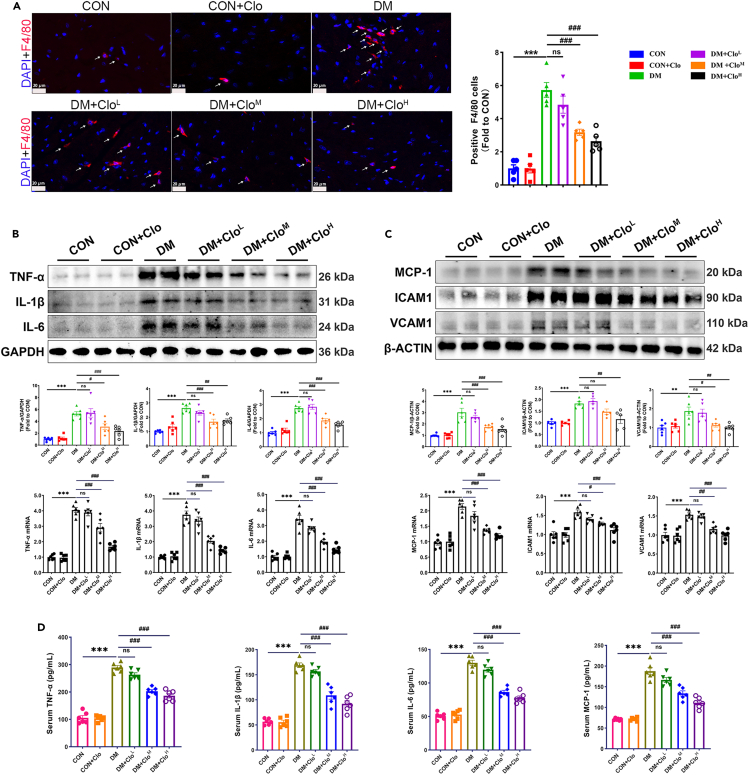
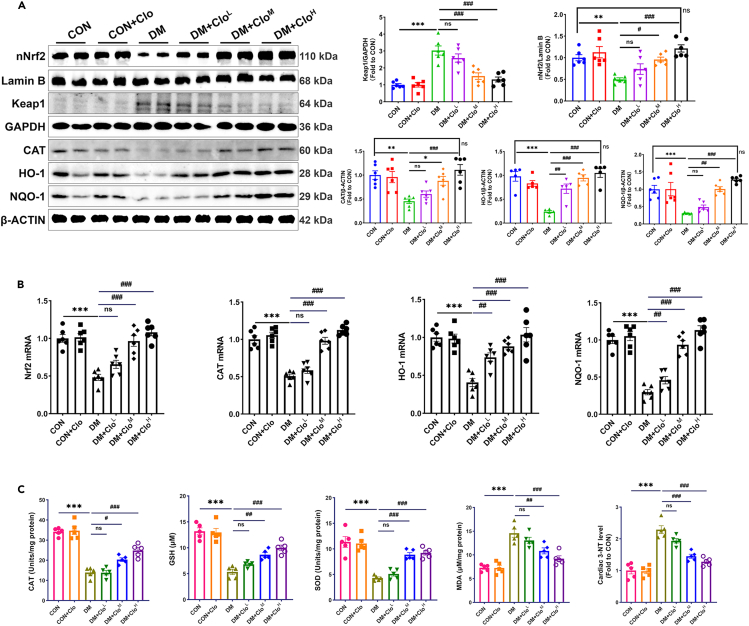
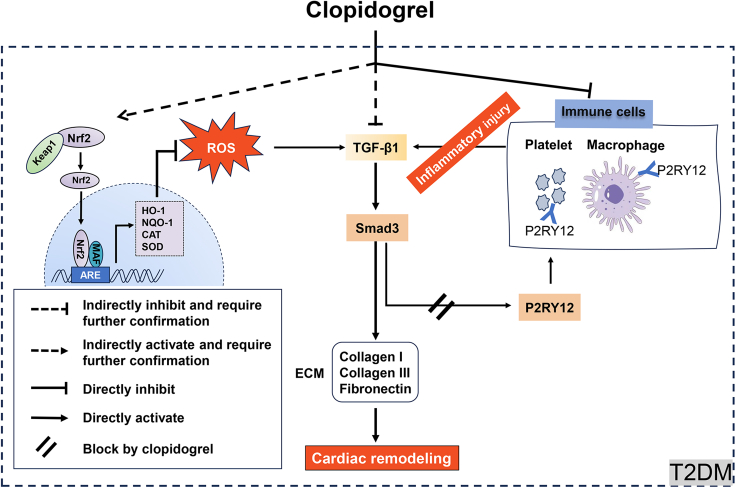
Clopidogrel has been shown to play a protective role against diabetic nephropathy. However, whether clopidogrel exerts a protective effect against diabetic cardiomyopathy (DCM) is unknown. Three-month-old male db/db mice were administered clopidogrel daily at doses of 5, 10, and 20 mg/kg by gavage for 5 months. Here, we showed that clopidogrel effectively attenuated diabetes-induced cardiac hypertrophy and cardiac dysfunction by inhibiting cardiac fibrosis, inflammatory responses, and oxidative stress damage in db/db mice. Diabetes-induced cardiac fibrosis was inhibited by clopidogrel treatment via blockade of the TGF-β1/Smad3/P2RY12 pathway and inhibition of macrophage infiltration in db/db mice. The protective effects of clopidogrel against oxidative damage were mediated by the induction of the Nrf2 signaling pathway. Taken together, our findings provide strong evidence that clopidogrel is a promising effective agent for the treatment of DCM by alleviating diabetes-induced cardiac hypertrophy and dysfunction. P2RY12 might be an effective target for the treatment of DCM.

Keywords: Biological sciences; Diabetology; Endocrinology; Natural sciences; Pathophysiology; Pharmacology; Physiology.


Conflict of interest statement

The authors declare no competing interests.

Figures

None
Graphical abstract
Figure 1
Figure 1
Physical and biochemical characteristics of the mice (A) Body weight of the mice (n = 6 per group). (B) Fasting blood glucose levels of the mice (n = 6 per group). (C) Serum triglyceride and total cholesterol levels of the mice (n = 5 per group). (D) Blood clotting time of the mice (n = 6 per group). (E) Heart weight/tibial length ratio (HW/TL) showing the relative heart weight (n = 6 per group). The data are presented as the mean ± SEM. Multiple comparisons were conducted with one-way ANOVA, followed by Tukey’s pairwise test. ∗∗∗p < 0.001 vs. the CON group; ###p < 0.001 vs. the DM group; ns (no significant difference).
Figure 2
Figure 2
Clo decreases DM-induced cardiac dysfunction and cardiac hypertrophy (A) Representative echocardiography and cardiac parameters measured via echocardiography (n = 5 per group). (B) WGA staining of the cardiac tissue for assessing cardiomyocyte size in cross-sections of the heart (n = 5 per group). Scale bar: 40 μm. (C) The protein and mRNA expression levels of MYH7 were used to evaluate cardiac hypertrophy (n = 6 per group). (D) The protein and mRNA expression levels of ANP were used to evaluate cardiac function (n = 6 per group). (E) Serum LDH, CK, and CK-MB levels in the mice (n = 5 per group). The data are presented as the mean ± SEM. Multiple comparisons were conducted with one-way ANOVA, followed by Tukey’s pairwise test. ∗p < 0.05, ∗∗p < 0.01, ∗∗∗p < 0.001 vs. the CON group; #p < 0.05, ##p < 0.01, ###p < 0.001 vs. the DM group; ns (no significant difference).
Figure 3
Figure 3
Negative correlation between Clo dosage and DM-induced cardiac fibrosis (A) Representative images of Masson’s trichrome staining followed by quantification of the percent positive area (n = 6 per group). Scale bar: 40 μm. (B) Western blotting and RT-qPCR analysis of α-SMA, COL1A1, COL3A1, and Fibronectin, and quantitation of their expression (n = 6 per group). (C) TGF-β1 and CTGF were analyzed using western blotting and RT-qPCR (n = 6 per group). The data are presented as the mean ± SEM. Multiple comparisons were conducted with one-way ANOVA, followed by Tukey’s pairwise test. ∗∗∗p < 0.001 vs. the CON group; #p < 0.05, ##p < 0.01, ###p < 0.001 vs. the DM group; ns (no significant difference).
Figure 4
Figure 4
The TGF-β1/Smad pathway is involved in Clo-induced decreases in DM-induced cardiac fibrosis (A) The levels of p-Smad2, Smad2, p-Smad3, and Smad3 were analyzed via western blotting, and the ratios of p-Smad2 to Smad2 and p-Smad3 to Smad3 were quantified (n = 4 per group). (B) P2RY12 was analyzed using western blotting and RT-qPCR (n = 6 per group). (C) Western blotting of ERK, p-ERK, JNK, p-JNK, P38, and p-P38 and quantitative analysis of the ratios of p-ERK to ERK, p-JNK to JNK, and p-P38 to P38 (n = 4 per group). The data are presented as the mean ± SEM. Multiple comparisons were conducted with one-way ANOVA, followed by Tukey’s pairwise test. ∗p < 0.05, ∗∗p < 0.01, ∗∗∗p < 0.001 vs. the CON group; #p < 0.05, ##p < 0.01, ###p < 0.001 vs. the DM group; ns (no significant difference).
Figure 5
Figure 5
Reduced DM-induced cardiac macrophage infiltration and cardiac inflammatory responses are implicated in Clo effectiveness (A) Representative fluorescence images of F4/80 and quantification of F4/80 expression. The white arrows indicate F4/80-positive cells (n = 5 per group). Scale bar: 20 μm. (B) Western blotting and mRNA expression of TNF-α, IL-1β, and IL-6 (n = 6 per group). (C) Western blotting and mRNA levels of MCP-1, ICAM1, and VCAM1 (n = 5–6 per group). (D) Serum levels of TNF-α, IL-1β, IL-6, and MCP-1 in mice (n = 6 per group). The data are presented as the mean ± SEM. Multiple comparisons were conducted with one-way ANOVA, followed by Tukey’s pairwise test. ∗p < 0.05, ∗∗p < 0.01, ∗∗∗p < 0.001 vs. the CON group; #p < 0.05, ##p < 0.01, ###p < 0.001 vs. the DM group; ns (no significant difference).
Figure 6
Figure 6
Clo-induced Nrf2 pathway activation prevents DM-induced cardiac oxidative stress damage (A) Western blotting and quantitative analysis of nuclear Nrf2 (nNrf2), Keap1, CAT, HO-1, and NQO-1 (n = 5–6 per group). (B) RT-qPCR and quantitative analysis of Nrf2, CAT, HO-1, and NQO-1 expression (n = 6 per group). (C) The levels of SOD, CAT, GSH, MDA, and 3-NT in heart tissues (n = 5 per group). The data are presented as the mean ± SEM. Multiple comparisons were conducted with one-way ANOVA, followed by Tukey’s pairwise test. ∗p < 0.05, ∗∗p < 0.01, ∗∗∗p < 0.001 vs. the CON group; #p < 0.05, ##p < 0.01, ###p < 0.001 vs. the DM group; ns (no significant difference).
Figure 7
Figure 7
Mechanism for the protective effects of clopidogrel on DCM T2DM-induced inflammatory responses, ROS accumulation, and cardiac fibrosis are hallmark mediators of DCM development. Clopidogrel attenuates DM-induced ROS accumulation by activating Nrf2 and its downstream effects (HO-1, NQO-1, SOD, and CAT). Clopidogrel attenuated the DM-induced increase in macrophage infiltration and hyperactive platelets by inhibiting P2RY12. Along these lines, the DM-induced increase in the expression of TGF-β1, which is partly secreted by macrophages and platelets, was inhibited by clopidogrel treatment. Diabetes-induced cardiac fibrosis can be alleviated by clopidogrel treatment via repression of the TGF-β1/Smad3/P2RY12 pathway.

Similar articles

Cited by

References

    1. Mortada I. Hyperuricemia, Type 2 Diabetes Mellitus, and Hypertension: an Emerging Association. Curr. Hypertens. Rep. 2017;19:69. doi: 10.1007/s11906-017-0770-x. - DOI - PubMed
    1. Hu X., Bai T., Xu Z., Liu Q., Zheng Y., Cai L. Pathophysiological Fundamentals of Diabetic Cardiomyopathy. Compr. Physiol. 2017;7:693–711. doi: 10.1002/cphy.c160021. - DOI - PubMed
    1. Palmer A.K., Gustafson B., Kirkland J.L., Smith U. Cellular senescence: at the nexus between ageing and diabetes. Diabetologia. 2019;62:1835–1841. doi: 10.1007/s00125-019-4934-x. - DOI - PMC - PubMed
    1. Saeedi P., Petersohn I., Salpea P., Malanda B., Karuranga S., Unwin N., Colagiuri S., Guariguata L., Motala A.A., Ogurtsova K., et al. Global and regional diabetes prevalence estimates for 2019 and projections for 2030 and 2045: Results from the International Diabetes Federation Diabetes Atlas, 9 (th) edition. Diabetes Res. Clin. Pract. 2019;157 doi: 10.1016/j.diabres.2019.107843. - DOI - PubMed
    1. Rubler S., Dlugash J., Yuceoglu Y.Z., Kumral T., Branwood A.W., Grishman A. New type of cardiomyopathy associated with diabetic glomerulosclerosis. Am. J. Cardiol. 1972;30:595–602. doi: 10.1016/0002-9149(72)90595-4. - DOI - PubMed

LinkOut - more resources