. 2024 Feb 5:15:1293618.
doi: 10.3389/fimmu.2024.1293618. eCollection 2024.

Location matters: spatial dynamics of tumor-infiltrating T cell subsets is prognostic in colon cancer

Affiliations

Location matters: spatial dynamics of tumor-infiltrating T cell subsets is prognostic in colon cancer

Hehuan Zhu et al. Front Immunol. .

Abstract

Background: Colon cancer is a heterogeneous disease and consists of various molecular subtypes. Despite advances in high-throughput expression profiling, limitations remain in predicting clinical outcome and assigning specific treatment to individual cases. Tumor-immune interactions play a critical role, with tumors that activate the immune system having better outcome for the patient. The localization of T cells within tumor epithelium, to enable direct contact, is essential for antitumor function, but bulk DNA/RNA sequencing data lacks spatial distribution information. In this study, we provide spatial T cell tumor distribution and connect these data with previously determined genomic data in the AC-ICAM colon cancer patient cohort.

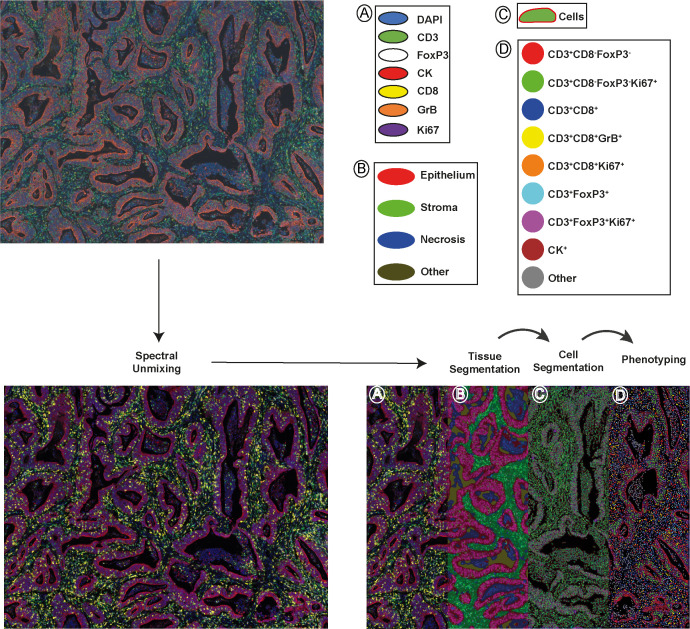
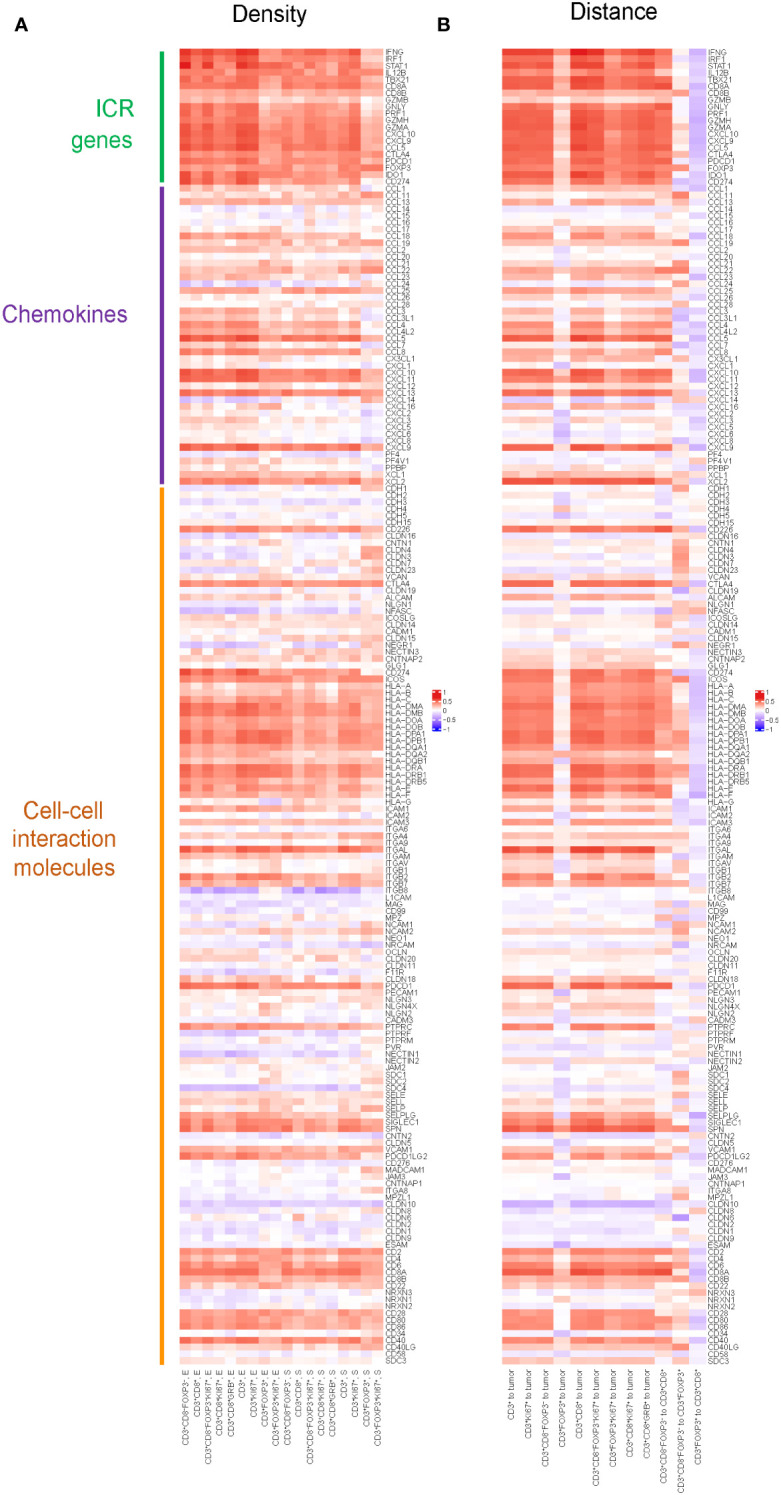
Methods: Colon cancer patients (n=90) with transcriptome data available were selected. We used a custom multiplex immunofluorescence assay on colon tumor tissue sections for quantifying T cell subsets spatial distribution in the tumor microenvironment, in terms of cell number, location, mutual distance, and distance to tumor cells. Statistical analyses included the previously determined Immunologic Constant of Rejection (ICR) transcriptome correlation and patient survival, revealing potential prognostic value in T cell spatial distribution.

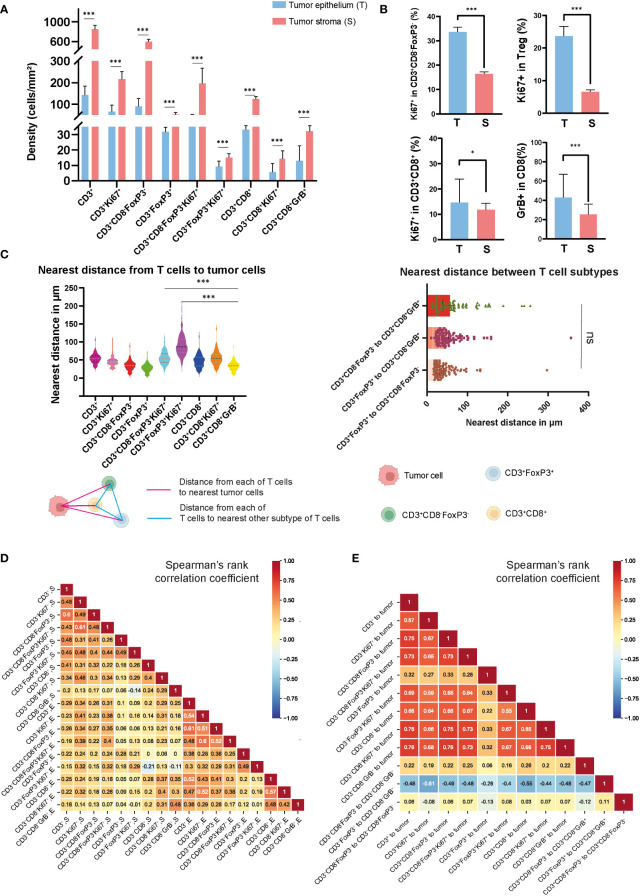
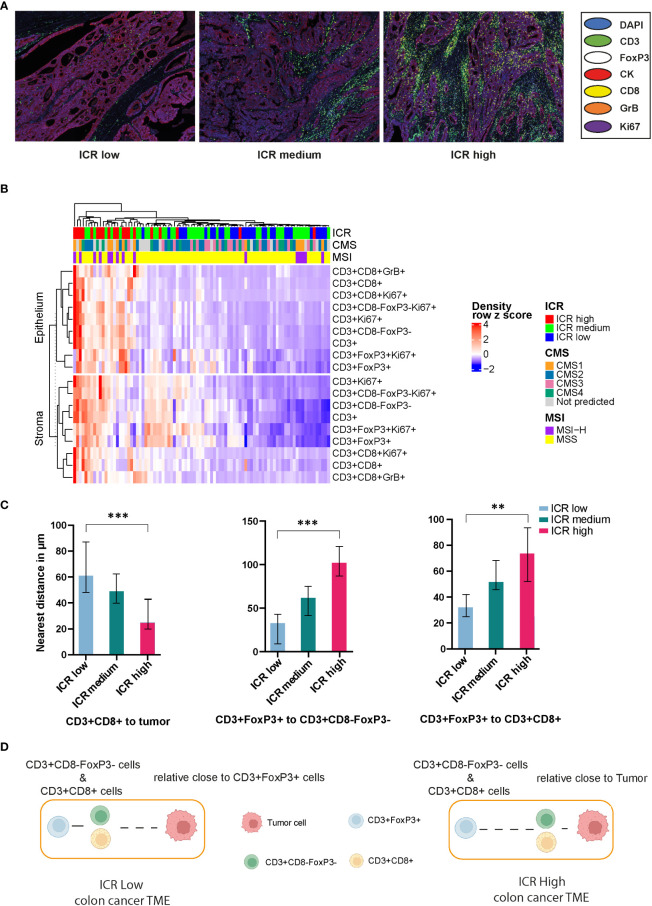
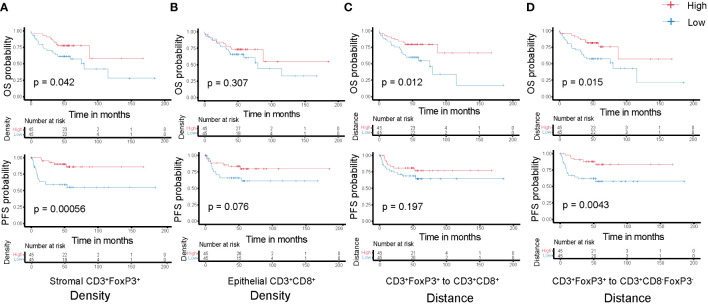
Results: T cell phenotypes were characterized and CD3+CD8-FoxP3- T cells were found to be the predominant tumor-infiltrating subtype while CD3+FoxP3+ T cells and CD3+CD8+ T cells showed similar densities. Spatial distribution analysis elucidated that proliferative T cells, characterized by Ki67 expression, and Granzyme B-expressing T cells were predominantly located within the tumor epithelium. We demonstrated an increase in immune cell density and a decrease in the distance of CD3+CD8+ T cells to the nearest tumor cell, in the immune active, ICR High, immune subtypes. Higher densities of stromal CD3+FoxP3+ T cells showed enhanced survival outcomes, and patients exhibited superior clinical benefits when greater spatial distances were observed between CD3+CD8-FoxP3- or CD3+CD8+ T cells and CD3+FoxP3+ T cells.

Conclusion: Our study's in-depth analysis of the spatial distribution and densities of major T cell subtypes within the tumor microenvironment has provided valuable information that paves the way for further research into the intricate relationships between immune cells and colon cancer development.

Keywords: T cell; colon cancer; immunologic constant of rejection; multiplex immunofluorescence; spatial analysis; tumor microenvironment.


Conflict of interest statement

DB reports employment with Kite, a Gilead Company. The remaining authors declare that the research was conducted in the absence of any commercial or financial relationships that could be construed as a potential conflict of interest.

Figures

Figure 1
Figure 1
A schematic depiction of the analytical pipeline, encompassing spectral unmixing, tissue segmentation, cell segmentation, and phenotyping, is provided. The top-left panel displays the original image and the bottom-left panel shows the unmixed image featuring all stained markers: DAPI (blue), CD3 (green), FoxP3 (white), CK (red), CD8 (yellow), GrB (orange), and Ki67 (purple). In the bottom-right panel, tissue segmentation and cell segmentation are illustrated in the middle-left and middle-right of the panel, separately. Tumor epithelial regions are shown in red, stromal areas in green, necrotic zones in blue and empty space in dark yellow. The right part of the panel exhibits phenotyped cells from one project, represented as dots with corresponding marker combination colors. Scale bar is 100 µm.
Figure 2
Figure 2
Densities and spatial distribution of T cell subsets in colon tumors. (A) Overview of the densities of T cell subsets in colon tumor epithelium and stroma, separately. (B) Comparison of the percentage of Ki67+ and GrB+ in different T cell subsets in epithelial and stromal compartments. (C) The top-left panel showed the nearest distance from different T cell subsets to tumor cells. The top-right panel showed the nearest distance between different T cell subsets. On the bottom side, a schematic diagram illustrated the spatial distances between various T cell populations or from T cell subsets to tumor cells (D) Correlation matrix of Spearman correlation coefficients between the densities of intraepithelial and stromal T cells. (E) Correlation matrix of Spearman correlation coefficients between the distances from T cells to tumor cells or between T cell subtypes. *** represent p value< 0.001, * represent p value< 0.05, ns represent p value> 0.05.
Figure 3
Figure 3
Pearson correlation between spatial distribution of T cell subtypes and gene expression of selected genes including chemokines, cell-cell interaction molecules and ICR genes. (A) Pearson correlation between densities of T cell subtypes and gene expression of selected genes including chemokines, cell-cell interaction molecules and ICR genes. Positive correlation in densities implies higher gene expression is associated with higher density. The color in the heatmap defines the correlation, red means a strong positive correlation, blue an inverse correlation, and white meaning no correlation. (B) Pearson correlation between distances of T cells to tumor cells, as well as the distances among different T cell subtypes, and the gene expression of selected genes including chemokines, cell-cell interaction molecules and ICR genes. Positive correlation in distance implies higher gene expression is associated with shorter distance.
Figure 4
Figure 4
Correlation of Immunologic Constant of Rejection (ICR) classification and spatial distribution of T cell subsets in colon cancer. (A) Representative mIF images of different ICR immune subtypes. (B) Heatmap of correlations among ICR classification, CMS classification and MSI status with T cell subtypes. (C) Correlation of ICR classification and the distance from CD3+CD8+ T cells to tumor cells, the distance between CD3+FoxP3+ to CD3+CD8-FoxP3- T cells and CD3+FoxP3+ to CD3+CD8+ T cells. (D) A proposed model of tumor microenvironment (TME) characteristics for colon cancer patients. In ICR low patients, the TME exhibits persistent immune regulation, with CD3+CD8-FoxP3- and CD3+CD8+ T cells in closer proximity to CD3+FoxP3+ T cells. In contrast, ICR high patients exhibit an enhanced functional immune state, facilitating closer proximity of CD3+CD8-FoxP3- and CD3+CD8+ T cells to tumor cells. The p-values of comparison between the three immune subtypes (one-way ANOVA test) are shown on the top (NS represent not significant; ** represent p value <0.01; *** represent p value <0,001).
Figure 5
Figure 5
Kaplan-Meier curves of overall (top-panels) and progression-free (bottom-panels) survival according to the densities of T cell subtypes (A) Stromal CD3+FoxP3+ T cells; (B) Epithelial CD3+CD8+ T cells and the distances among different T cell subtypes (C) CD3+FoxP3+ to CD3+CD8+ T cells; (D) CD3+FoxP3+ to CD3+CD8-FoxP3- T cells. Densities and distances above the median are designated as ‘high’, while those below the median are classified as ‘low’.

Similar articles

Cited by

References

    1. Morgan E, Arnold M, Gini A, Lorenzoni V, Cabasag CJ, Laversanne M, et al. . Global burden of colorectal cancer in 2020 and 2040: incidence and mortality estimates from GLOBOCAN. Gut (2023) 72(2):338–44. doi: 10.1136/gutjnl-2022-327736 - DOI - PubMed
    1. Ishibe A, Watanabe J, Suwa Y, Nakagawa K, Suwa H, Misumi T, et al. . A prospective, single-arm, multicenter trial of diverting stoma followed by neoadjuvant chemotherapy using mFOLFOX6 for obstructive colon cancer: YCOG 1305 (PROBE study). Ann Surg (2022) 276(1):140–5. doi: 10.1097/SLA.0000000000004494 - DOI - PubMed
    1. de Gooyer JM, Elekonawo FMK, Bos DL, van der Post RS, Pelegrin A, Framery B, et al. . Multimodal CEA-targeted image-guided colorectal cancer surgery using (111)In-labeled SGM-101. Clin Cancer Res (2020) 26(22):5934–42. doi: 10.1158/1078-0432.CCR-20-2255 - DOI - PubMed
    1. Chalabi M, Fanchi LF, Dijkstra KK, Van den Berg JG, Aalbers AG, Sikorska K, et al. . Neoadjuvant immunotherapy leads to pathological responses in MMR-proficient and MMR-deficient early-stage colon cancers. Nat Med (2020) 26(4):566–76. doi: 10.1038/s41591-020-0805-8 - DOI - PubMed
    1. Amin MB, Greene FL, Edge SB, Compton CC, Gershenwald JE, Brookland RK, et al. . The Eighth Edition AJCC Cancer Staging Manual: Continuing to build a bridge from a population-based to a more "personalized" approach to cancer staging. CA Cancer J Clin (2017) 67(2):93–9. doi: 10.3322/caac.21388 - DOI - PubMed

Publication types

Substances