

Prognostic iron-metabolism signature robustly stratifies single-cell characteristics of hepatocellular carcinoma
- PMID: 38375529
- PMCID: PMC10875160
- DOI: 10.1016/j.csbj.2024.01.022
Prognostic iron-metabolism signature robustly stratifies single-cell characteristics of hepatocellular carcinoma
Abstract
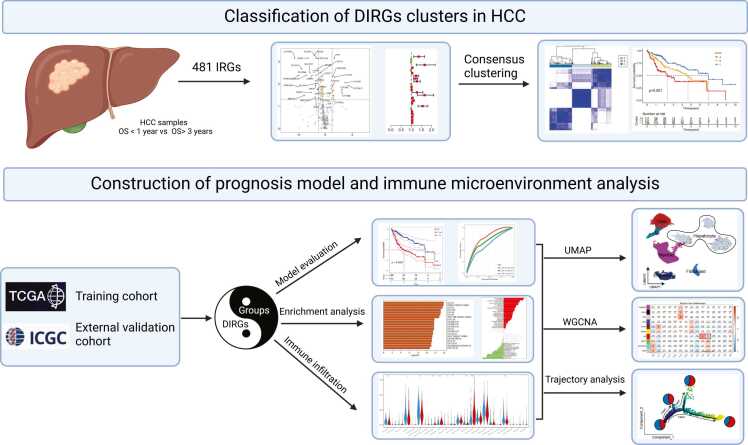
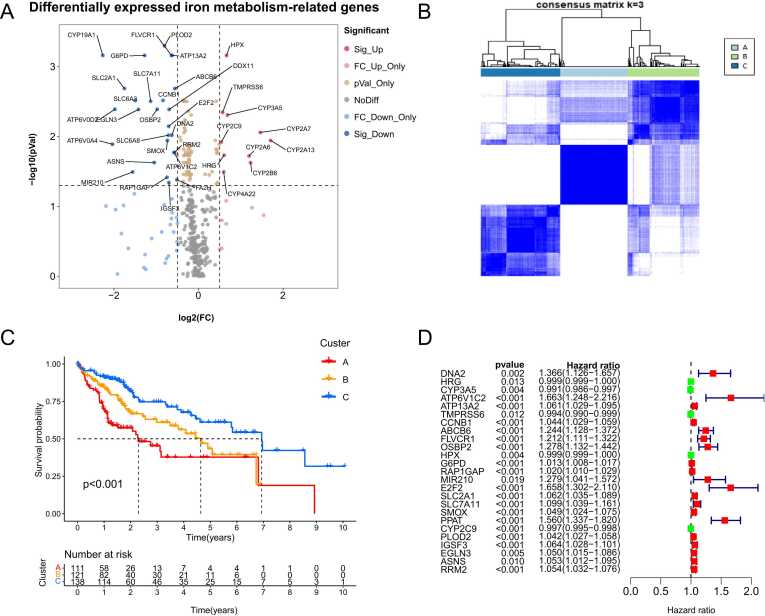
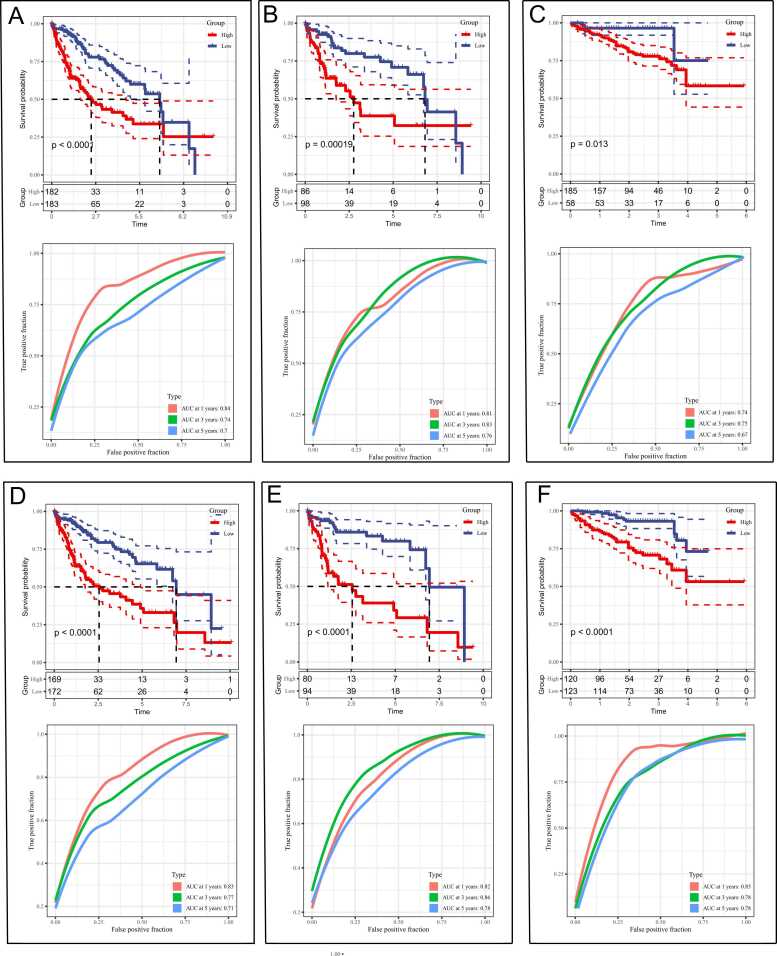
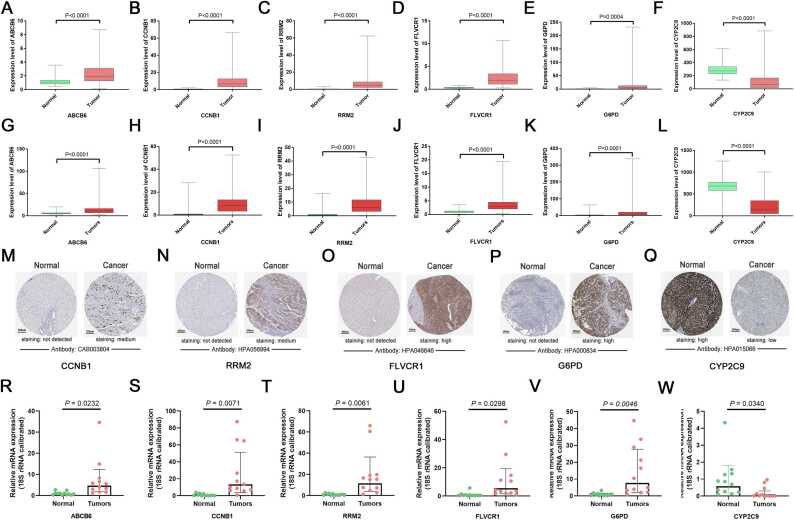
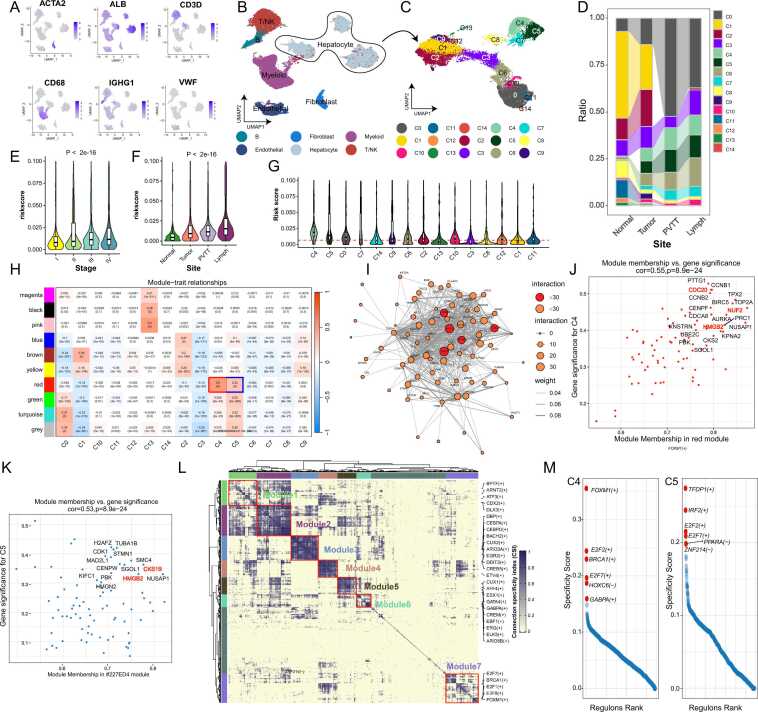
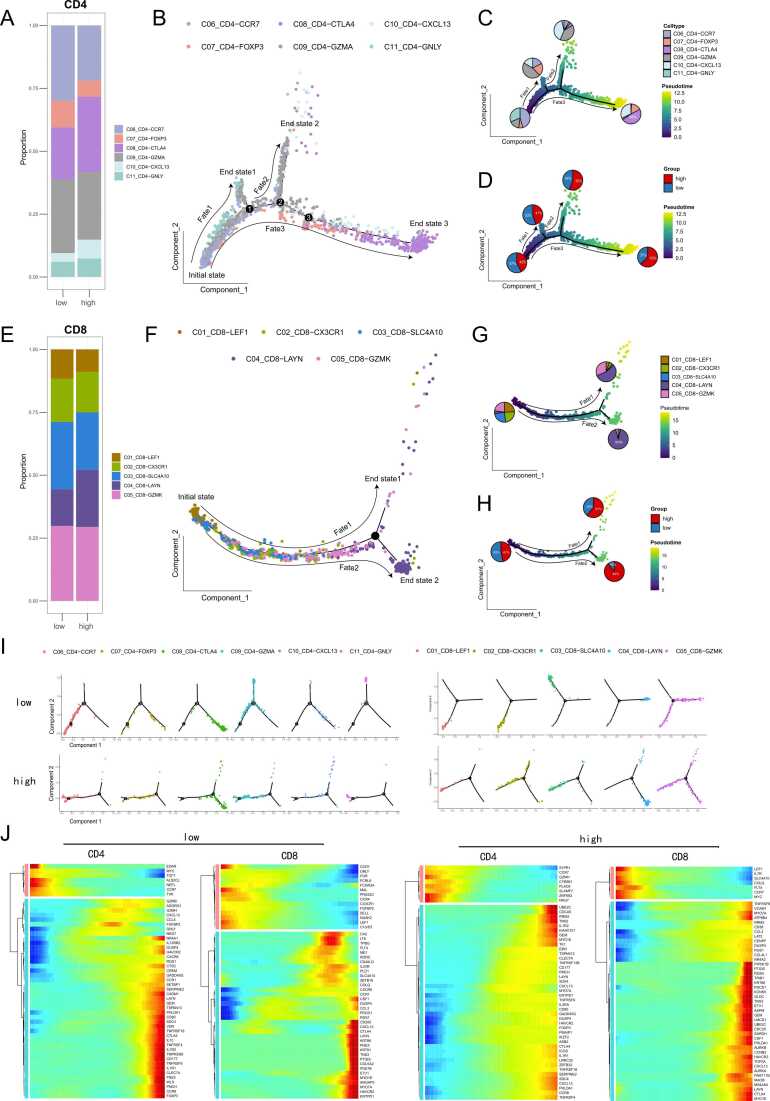
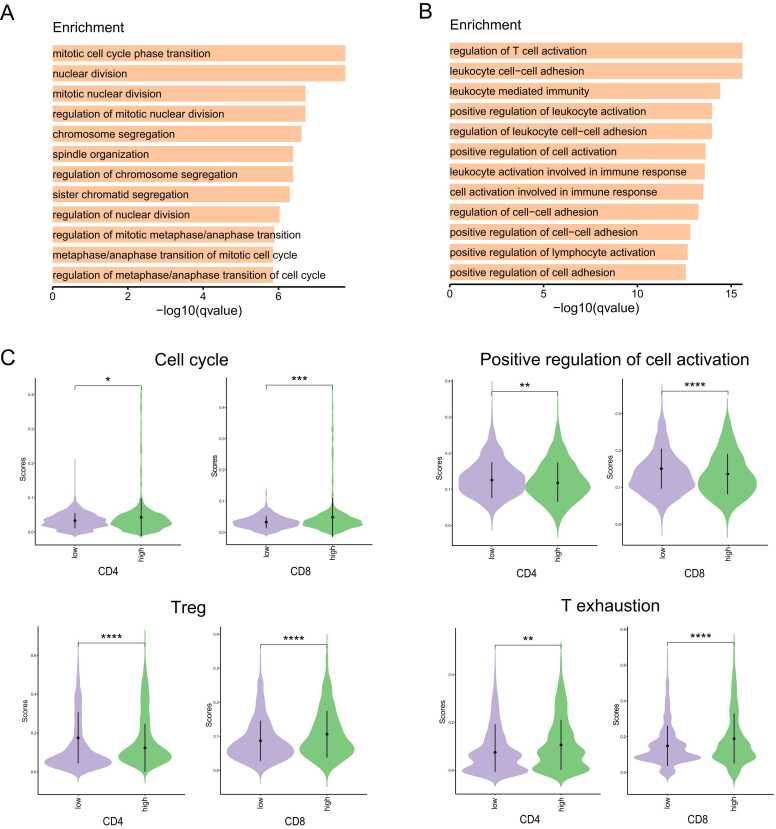
Cancer immunotherapy has shown to be a promising method in treating hepatocellular carcinoma (HCC), but suboptimal responses in patients are attributed to cellular and molecular heterogeneity. Iron metabolism-related genes (IRGs) are important in maintaining immune system homeostasis and have the potential to help develop new strategies for HCC treatment. Herein, we constructed and validated the iron-metabolism gene prognostic index (IPX) using univariate Cox proportional hazards regression and LASSO Cox regression analysis, successfully categorizing HCC patients into two groups with distinct survival risks. Then, we performed single-sample gene set enrichment analysis, weighted correlation network analysis, gene ontology enrichment analysis, cellular lineage analysis, and SCENIC analysis to reveal the key determinants underlying the ability of this model based on bulk and single-cell transcriptomic data. We identified several driver transcription factors specifically activated in specific malignant cell sub-populations to contribute to the adverse survival outcomes in the IPX-high subgroup. Within the tumor microenvironment (TME), T cells displayed significant diversity in their cellular characteristics and experienced changes in their developmental paths within distinct clusters identified by IPX. Interestingly, the proportion of Treg cells was increased in the high-risk group compared with the low-risk group. These results suggest that iron-metabolism could be involved in reshaping the TME, thereby disrupting the cell cycle of immune cells. This study utilized IRGs to construct a novel and reliable model, which can be used to assess the prognosis of patients with HCC and further clarify the molecular mechanisms of IRGs in HCC at single-cell resolution.
Keywords: Hepatocellular carcinoma (HCC); Immune infiltration; Iron metabolism-related gene prognostic index (IPX); Iron metabolism-related genes (IRGs); Personalized medicine.
© 2024 The Authors.
Conflict of interest statement
The authors report no conflict of interest.
Figures

Similar articles
-
Identification of a prognostic and therapeutic immune signature associated with hepatocellular carcinoma.Cancer Cell Int. 2021 Feb 10;21(1):98. doi: 10.1186/s12935-021-01792-4. Cancer Cell Int. 2021. PMID: 33568167 Free PMC article.
-
A New Risk Score Based on Eight Hepatocellular Carcinoma- Immune Gene Expression Can Predict the Prognosis of the Patients.Front Oncol. 2021 Nov 19;11:766072. doi: 10.3389/fonc.2021.766072. eCollection 2021. Front Oncol. 2021. PMID: 34868990 Free PMC article.
-
Comprehensive analysis of immune-related gene signature based on ssGSEA algorithms in the prognosis and immune landscape of hepatocellular carcinoma.Front Genet. 2022 Dec 9;13:1064432. doi: 10.3389/fgene.2022.1064432. eCollection 2022. Front Genet. 2022. PMID: 36568383 Free PMC article.
-
A novel risk score based on immune-related genes for hepatocellular carcinoma as a reliable prognostic biomarker and correlated with immune infiltration.Front Immunol. 2022 Oct 24;13:1023349. doi: 10.3389/fimmu.2022.1023349. eCollection 2022. Front Immunol. 2022. PMID: 36353638 Free PMC article.
-
Identification and Validation of a Tumor Microenvironment-Related Gene Signature in Hepatocellular Carcinoma Prognosis.Front Genet. 2021 Nov 26;12:717319. doi: 10.3389/fgene.2021.717319. eCollection 2021. Front Genet. 2021. PMID: 34899826 Free PMC article.
Cited by
-
Iron and Cancer.Adv Exp Med Biol. 2025;1480:271-289. doi: 10.1007/978-3-031-92033-2_18. Adv Exp Med Biol. 2025. PMID: 40603797 Review.
-
Targeting liver cancer stem cells: the prognostic significance of MRPL17 in immunotherapy response.Front Immunol. 2024 Dec 17;15:1519324. doi: 10.3389/fimmu.2024.1519324. eCollection 2024. Front Immunol. 2024. PMID: 39742265 Free PMC article.
-
Exploring the Role of Metabolic Hyperferritinaemia (MHF) in Steatotic Liver Disease (SLD) and Hepatocellular Carcinoma (HCC).Cancers (Basel). 2025 Feb 28;17(5):842. doi: 10.3390/cancers17050842. Cancers (Basel). 2025. PMID: 40075688 Free PMC article. Review.
References
-
- Sung H., Ferlay J., Siegel R.L., et al. Global cancer statistics 2020: GLOBOCAN estimates of incidence and mortality worldwide for 36 cancers in 185 countries. CA Cancer J Clin. 2021;71:209–249. - PubMed
-
- Siegel R.L., Miller K.D., Wagle N.S., Jemal A. Cancer statistics, 2023. CA Cancer J Clin. 2023;73:17–48. - PubMed
LinkOut - more resources
Full Text Sources