. 2024 May 1;326(5):L638-L645.
doi: 10.1152/ajplung.00017.2024. Epub 2024 Feb 20.

A novel interaction between aquaporin 1 and caspase-3 in pulmonary arterial smooth muscle cells

Affiliations

A novel interaction between aquaporin 1 and caspase-3 in pulmonary arterial smooth muscle cells

Shannon Niedermeyer et al. Am J Physiol Lung Cell Mol Physiol. .

Abstract

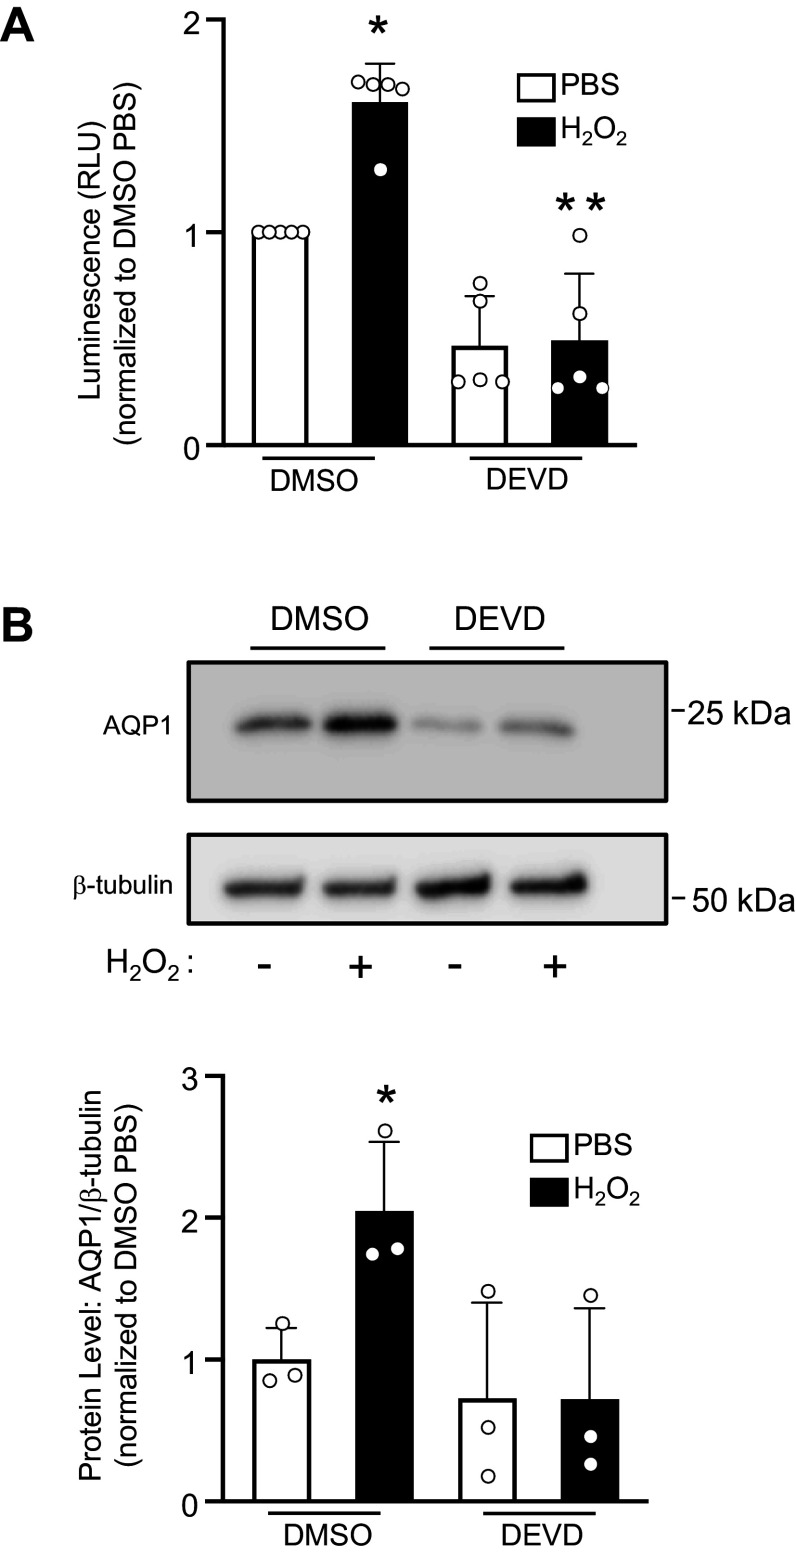
Pulmonary hypertension (PH) is a condition in which remodeling of the pulmonary vasculature leads to hypertrophy of the muscular vascular wall and extension of muscle into nonmuscular arteries. These pathological changes are predominantly due to the abnormal proliferation and migration of pulmonary arterial smooth muscle cells (PASMCs), enhanced cellular functions that have been linked to increases in the cell membrane protein aquaporin 1 (AQP1). However, the mechanisms underlying the increased AQP1 abundance have not been fully elucidated. Here we present data that establishes a novel interaction between AQP1 and the proteolytic enzyme caspase-3. In silico analysis of the AQP1 protein reveals two caspase-3 cleavage sites on its C-terminal tail, proximal to known ubiquitin sites. Using biotin proximity ligase techniques, we establish that AQP1 and caspase-3 interact in both human embryonic kidney (HEK) 293A cells and rat PASMCs. Furthermore, we demonstrate that AQP1 levels increase and decrease with enhanced caspase-3 activity and inhibition, respectively. Ultimately, further work characterizing this interaction could provide the foundation for novel PH therapeutics.NEW & NOTEWORTHY Pulmonary arterial smooth muscle cells (PASMCs) are integral to pulmonary vascular remodeling, a characteristic of pulmonary arterial hypertension (PAH). PASMCs isolated from robust animal models of disease demonstrate enhanced proliferation and migration, pathological functions associated with increased abundance of the membrane protein aquaporin 1 (AQP1). We present evidence of a novel interaction between the proteolytic enzyme caspase-3 and AQP1, which may control AQP1 abundance. These data suggest a potential new target for novel PAH therapies.

Keywords: lung; myocytes; pulmonary vascular disease.


Conflict of interest statement

Larissa Shimoda is an editor of American Journal of Physiology-Lung Cellular and Molecular Physiology and was not involved and did not have access to information regarding the peer-review process or final disposition of this article. An alternate editor oversaw the peer-review and decision-making process for this article. None of the other authors has any conflicts of interest, financial or otherwise, to disclose.

Figures

None
Graphical abstract
Figure 1.
Figure 1.
Primary sequence (A) and schematic representation (B) of human aquaporin 1 (AQP1) protein. Potential caspase-3 (Casp3) cleavage sites are indicated in red and ubiquitin sites are indicated in orange. Tables showing relevant plasmid (C) and adenoviral (D) constructs used in this study. Dark blue in AQP1 constructs indicates transmembrane region, light blue indicates C-terminal cytosolic region. E: bar and scatter graph shows mean ± SD values for the time constant of decay (τ) of calcein fluorescence (quenching) measured in adherent calcein-loaded PASMCs. τ, a measure of water transport, was calculated when perfusate was switched from 140 to 380 mOsm/L in cells infected with AdGFP, AdWTAQP1, and AdBioAQP1. *Significant difference (P < 0.05) from AdGFP (control). F: bar and scatter graph shows means ± SD of caspase-3 activity in HEK293A cells transfected with enhanced green fluorescent protein (eGFP, control) or with wild-type (WTCasp3) or biotin ligase-fused (BioCasp3) caspase 3. *Significant difference (P < 0.001) from eGFP (control) by ANOVA and Holm–Sidak post hoc test. There was no significant difference between WTCasp3 and BioCasp3 (P = 0.139). AdBioAQP1, adenoviral constructs containing biotin ligase-fused AQP1; AdWTAQP1, adenoviral constructs containing wild-type AQP1; AQP1, aquaporin-1; AdGFP, adenoviral constructs containing green fluorescent protein; HEK293A, human embryonic kidney 293A; PASMC, pulmonary arterial smooth muscle cell.
Figure 2.
Figure 2.
A: representative image showing expression of wild-type (WTAQP1) and biotin ligase-conjugated AQP1 (BioAQP1) in HEK293A cells, which do not express native AQP1. The addition of a biotin ligase increases the molecular weight by ∼35 kD. M-cherry (MC) was used as a control. Bar and scatter graph shows mean ± SD values for expressed AQP1 constructs normalized to β-tubulin (loading control). There was no difference between WTAQP1 and BioAQP1 by 2-tailed t test (P = 0.121). B: representative image showing caspase-3 (casp3) protein captured by streptavidin pull down (eluent) and in total lysates (input) in HEK293A cells transfected with WTAQP1 and BioAQP1. Bar and scatter graph represents mean ± SD ratio values for casp3 in eluent and input (loading control). *Significant difference (P < 0.001) by 2-tailed t test. C: representative image showing expression of wild-type casp3 (WTCasp3) and biotin ligase-conjugated casp3 (BioCasp3) in HEK293A cells. Enhanced green fluorescent protein (eGFP) was used as a control. Bar and scatter graph shows means ± SD of expressed casp3 constructs normalized to β-tubulin. There was no significant difference between groups by 2-tailed t test (P = 0.257). D: representative image showing AQP1 protein captured by streptavidin pull down (eluent) and expression in total lysates (input) in HEK293A cells transfected with WTCasp3 and BioCasp3. Bar and scatter graph represents mean ± SD values for ratio of AQP1 protein in eluent and input. *Significant difference (P < 0.001) by 2-tailed t test. For all graphs, individual dots represent experimental replicates. AQP1, aquaporin-1; HEK293A, human embryonic kidney 293A.
Figure 3.
Figure 3.
A: representative image showing expressed wild-type (WTAQP1) and AQP1 fused to biotin ligase (BioAQP1) in PASMCs (probed with HA). Samples are from the same blot but cropped for size. Bar and scatter graph shows mean ± SD values for expressed AQP1 constructs normalized to β-tubulin (loading control). There was no significant difference between AdWTAQP1 and AdBioAQP1 by 2-tailed t test (P = 0.098). B: representative image showing caspase-3 (casp3) protein captured by streptavidin pull down (eluent) and in total lysates (input) in PASMCs infected with WTAQP1 and BioAQP1. Bar and scatter graph represents means ± SD of casp3 in eluent. *Significant difference (P = 0.006) by 2-tailed t test. C: representative image showing expression of biotin ligase-conjugated casp3 (BioCasp3) in PASMCs, with eGFP used as a control. Bar and scatter graph shows means ± SD of casp3 protein. *Significant difference (P = 0.003) by 2-tailed t test. D: representative image showing AQP1 protein captured by streptavidin pull down (eluent) and in total lysates (input) in PASMCs infected with BioCasp3. Bar and scatter graph represents means ± SD of AQP1 in eluent. *Significant difference (P = 0.047) by 1-tailed t test. For all experiments, individual dots represent experimental replicates in cells isolated from different animals. AdBioAQP1, adenoviral constructs containing biotin ligase-fused AQP1; AdWTAQP1, adenoviral constructs containing wild-type AQP1; AQP1, aquaporin-1; AdeGFP, adenoviral constructs containing enhanced green fluorescent protein; HA, hemagglutinin; PASMC, pulmonary arterial smooth muscle cell.
Figure 4.
Figure 4.
A: bar and scatter graph shows mean ± SD caspase-3/7 activity in PASMCs treated with the caspase-3 (casp3) inhibitor DEVD (50 µg/mL) or DMSO (vehicle) for 1 h and then challenged with hydrogen peroxide (H2O2; 500 µM; 24 h) or PBS (vehicle). *Significant difference from DMSO PBS (P < 0.012) and **significant difference (P = 0.002) from DMSO H2O2 by 2-way ANOVA with Holm–Sidak post hoc test. B: representative image showing AQP1 and β-tubulin (loading control) protein in cells pretreated with DEVD or DMSO and then challenged with H2O2 or PBS. Bar and scatter graph shows means ± SD of AQP1 protein. *Significant difference (P < 0.05) by 2-way ANOVA. For all graphs, individual dots represent experimental replicates in cells isolated from different animals. PASMC, pulmonary arterial smooth muscle cell.

Similar articles

References

    1. Boucherat O, Chabot S, Antigny F, Perros F, Provencher S, Bonnet S. Potassium channels in pulmonary arterial hypertension. Eur Respir J 46: 1167–1177, 2015. doi:10.1183/13993003.00798-2015. - DOI - PubMed
    1. Thenappan T, Ormiston ML, Ryan JJ, Archer SL. Pulmonary arterial hypertension: pathogenesis and clinical management. BMJ 360: j5492, 2018.doi:10.1136/bmj.j5492. - DOI - PMC - PubMed
    1. Lai N, Lade J, Leggett K, Yun X, Baksh S, Chau E, Crow MT, Sidhaye V, Wang J, Shimoda LA. The aquaporin 1 C-terminal tail is required for migration and growth of pulmonary arterial myocytes. Am J Respir Cell Mol Biol 50: 1010–1020, 2014. doi:10.1165/rcmb.2013-0374OC. - DOI - PMC - PubMed
    1. Yun X, Philip NM, Jiang H, Smith Z, Huetsch JC, Damarla M, Suresh K, Shimoda LA. Upregulation of aquaporin 1 mediates increased migration and proliferation in pulmonary vascular cells from the rat su5416/hypoxia model of pulmonary hypertension. Front Physiol 12: 763444, 2021.doi:10.3389/fphys.2021.763444. - DOI - PMC - PubMed
    1. Galiè N, Channick RN, Frantz RP, Grünig E, Jing ZC, Moiseeva O, Preston IR, Pulido T, Safdar Z, Tamura Y, McLaughlin VV. Risk stratification and medical therapy of pulmonary arterial hypertension. Eur Respir J 53: 1801889, 2019. doi:10.1183/13993003.01889-2018. - DOI - PMC - PubMed

Publication types

LinkOut - more resources