. 2024 Jan;14(1):e3350.
doi: 10.1002/brb3.3350.

No significant change of N6 -methyladenosine modification landscape in mouse brain after morphine exposure

Affiliations

No significant change of N6 -methyladenosine modification landscape in mouse brain after morphine exposure

Xiaoli Wu et al. Brain Behav. 2024 Jan.

Abstract

Objectives: N6 -methyladenosine (m6 A) plays a crucial role in regulating neuroplasticity and different brain functions at the posttranscriptional level. However, it remains unknown whether m6 A modification is involved in acute and chronic morphine exposure.

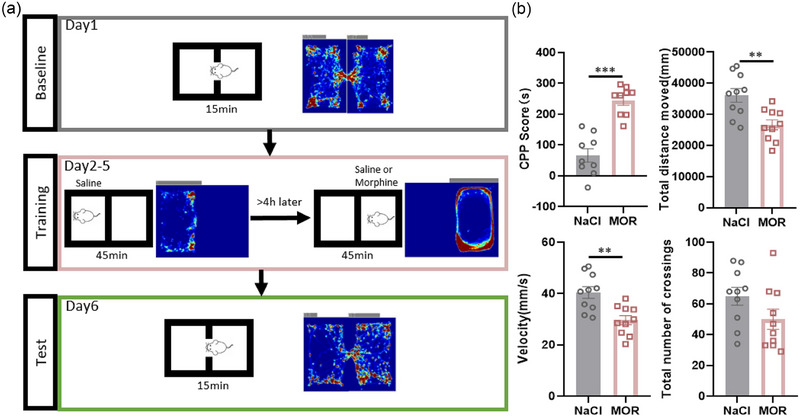
Materials and methods: In this study, we conducted a direct comparison of m6 A levels and mRNA expression of m6 A-associated factors between morphine-treated and nontreated C57BL/6 wild-type mice. We established animal models of both acute and chronic morphine treatment and confirmed the rewarding effects of chronic morphine treatment using the conditioned place preference (CPP) assay. The activation status of different brain regions in response to morphine was assessed by c-fos staining. To assess overall m6 A modification levels, we employed the m6 A dot blot assay, while mRNA levels of m6 A-associated proteins were measured using a quantitative polymerase chain reaction (qPCR) assay. These analyses were performed to investigate whether and how m6 A modification and m6 A-associated protein expression will change following morphine exposure.

Results: The overall m6 A methylation and mRNA levels of m6 A-associated proteins were not significantly altered in brain regions that were either activated or not activated during acute morphine stimulation. Similarly, the overall m6 A modification and mRNA levels of m6 A-associated proteins remained unaffected in several key brain regions associated with reward following chronic morphine exposure.

Conclusion: This study showed that the overall m6 A modification level and mRNA expression levels of m6 A-associated factors were not affected after acute and chronic morphine exposure in different brain regions, indicating m6 A modification may not be involved in brain response to morphine exposure.

Keywords: N6-methyladenosine; epigenetics; morphine; opioid; posttranscriptional RNA modification; reward.


Conflict of interest statement

The authors declare no conflict of interest.

Figures

FIGURE 1
FIGURE 1
Activation of brain region following a single exposure to morphine. (a) C‐fos positive cells (green) were observed in the PRL, PVT, NAc, M2, and HIP after a single exposure to morphine or NaCl (n = 3–6). The square diagram on the right provides a magnified view of the field of view inside the white box on the left. Scale bar, 100 μm. PRL, prelimbic cortex; PVT, paraventricular thalamic nucleus; NAc, nucleus accumbens; M2, secondary motor cortex; HIP, hippocampus. (b–f) Quantification of the number of c‐fos positive cells in the PRL, PVT, NAc, M2, and HIP of mice exposed to a single dose of morphine (green) compared to control mice (gray). (p = .0032 in PRL; p = .0134 in PVT; p = .0026 NAc).*p < .05, **p < .01. Unpaired t‐test. Data represent means ± SEM (n = 3–6 animals.) (g) Hot plate test reveals a significantly longer latency of initial reaction (paw lick, paw lift or paw shake) in mice exposed to a single dose of morphine (green) compared to control mice (gray). **p < .01, Unpaired t‐test. Data represent means ± SEM (n = 8 animals).
FIGURE 2
FIGURE 2
m6A modification landscape after single exposure to morphine. (a) The m6A level in total RNA was assessed using m6A dot blot analysis in the PRL, PVT, NAc, and HIP regions of mice exposed to a single dose of morphine‐treated (MOR, n = 5–6) and nontreated (NaCl, n = 5–6) mice. RNA samples were diluted to 150 ng, 75 ng, and 37.5 ng for the analysis. (b) Quantification of m6A dot blot in the PRL, PVT, NAc, and HIP (n = 5–6), with methylene blue staining serving as the loading control. (p = .7311 in PRL; p = .8528 in PVT; p = .7254 in NAc; p = .4039 in HIP), p ≥ .05, not significant. Multiple t‐test. Data represent means ± SEM (n = 5–6 animals.) (c) The relative mRNA expression levels of m6A‐related proteins, normalized to GAPDH as a reference, including ALKBH5, alkB homolog 5; FTO, the fat mass and obesity‐associated protein; METTL3, methyltransferase‐like 3; METTL14, methyltransferase‐like 14; VIRMA, vir‐like m6A methyltransferase associated; YTHDF1/2/3, YTH‐domain‐containing proteins. (YTHDF2 in HIP, *p = .024; YTHDF3 in NAc, **p = .009; YTHDF3 in HIP, *p = .024.) Multiple t‐test, *p < .05; **p < .01; ***p < .001; p ≥ .05, not significant. Data represent means ± SEM (n = 5–6 animals). (d) The relative mRNA expression levels of Mu‐opioid receptor (Oprm1), normalized to GAPDH as a reference. (p = .033 in PVT; p = .009 in NAc). Multiple t‐test. *p < .05; p ≥ .05, not significant. Data represent means ± SEM (n = 5 animals.)
FIGURE 3
FIGURE 3
Chronic morphine treatment induced CPP model. (a) Schematic representation of the construction of the chronic morphine administration model. Baseline period (gray): to determine baseline preferences of mice; Training period (red): implementation of the continuous morphine exposure training regimen in a specific environment; Test period (green): assessment of the rewarding effect of morphine. (b) The extent of morphine preference (CPP score), total distance traveled, movement speed (Velocity), and the count of transitions between the two chambers (total number of crossings) were measured in both continuously morphine‐exposed (MOR) and nonexposed (NaCl) mice, during the test period. (***p = .0001 in CPP score, **p = .0026 in total distance moved, **p = .0015 in Velocity, p = .1037 in total number of crossings.) Unpaired t‐test. *p < .05; **p < .01; ***p < .001; p ≥ .05, not significant. Data represent means ± SEM (n = 9 animals).
FIGURE 4
FIGURE 4
m6A modification landscape after chronic morphine exposure. (a) The level of m6A in total RNA was assessed using m6A dot blot in the PRL, PVT, NAc, HIP, and VTA regions of mice with morphine exposure (MOR, n = 8–9) and nonexposure (NaCl, n = 8–9). RNA samples were diluted to 150 ng, 75 ng for the analysis. (b) Quantification of m6A dot blot in the PRL, PVT, NAc, HIP, and VTA (n = 8–9), with methylene blue staining serving as the loading control. (p = .4501 in PRL; p = .3862 in PVT; p = .4692 in NAc; p = .1313 in HIP; p = .5117 in VTA.) p ≥ .05, not significant. Multiple t‐test. Data represent means ± SEM (n = 8–9 animals). (c) The relative mRNA expression levels of m6A‐related proteins, normalized to GAPDH as a reference, including ALKBH5, FTO, METTL3, METTL14, VIRMA, YTHDF1/2/3. (FTO in PVT, *p = .02.) Multiple t‐test. *p < .05; p ≥ .05, not significant. Data represent means ± SEM (n = 5–6 animals). (d) The relative mRNA expression levels of Mu‐opioid receptor (Oprm1), normalized to GAPDH as a reference. p ≥ .05, not significant. Multiple t‐test. Data represent means ± SEM (n = 4–5 animals).

Similar articles

Cited by

References

    1. Almeida‐Santos, A. F. , Gobira, P. H. , Souza, D. P. , Ferreira, R. C. M. , Romero, T. R. , Duarte, I. D. , Aguiar, D. C. , & Moreira, F. A. (2014). The antipsychotic aripiprazole selectively prevents the stimulant and rewarding effects of morphine in mice. European Journal of Pharmacology, 742, 139–144. 10.1016/j.ejphar.2014.09.004 - DOI - PubMed
    1. Barrow, T. M. , Byun, H.‐M. , Li, X. , Smart, C. , Wang, Y.‐X. , Zhang, Y. , Baccarelli, A. A. , & Guo, L. (2017). The effect of morphine upon DNA methylation in ten regions of the rat brain. Epigenetics, 12(12), 1038–1047. 10.1080/15592294.2017.1398296 - DOI - PMC - PubMed
    1. Bazov, I. , Sarkisyan, D. , Kononenko, O. , Watanabe, H. , Taqi, M. M. , Stålhandske, L. , Verbeek, D. S. , Mulder, J. , Rajkowska, G. , Sheedy, D. , Kril, J. , Sun, X. , Syvänen, A.‐C. , Yakovleva, T. , & Bakalkin, G. (2018). Neuronal expression of opioid gene is controlled by dual epigenetic and transcriptional mechanism in human brain. Cerebral Cortex, 28(9), 3129–3142. 10.1093/cercor/bhx181 - DOI - PMC - PubMed
    1. Bokar, J. A. , Shambaugh, M. E. , Polayes, D. , Matera, A. G. , & Rottman, F. M. (1997). Purification and cDNA cloning of the AdoMet‐binding subunit of the human mRNA (N6‐adenosine)‐methyltransferase. RNA, 3(11), 1233–1247. https://www.ncbi.nlm.nih.gov/pubmed/9409616 - PMC - PubMed
    1. Brodsky, M. , Elliott, K. , Hynansky, A. , & Inturrisi, C. E. (1995). Cns levels of Mu‐Opioid Receptor (Mor‐1) messenger‐RNA during chronic treatment with morphine or naltrexone. Brain Research Bulletin, 38(2), 135–141. 10.1016/0361-9230(95)00079-T - DOI - PubMed

Publication types

LinkOut - more resources