Mitochondrial-related genes PDK2, CHDH, and ALDH5A1 served as a diagnostic signature and correlated with immune cell infiltration in ulcerative colitis
- PMID: 38376420
- PMCID: PMC10929806
- DOI: 10.18632/aging.205561
Mitochondrial-related genes PDK2, CHDH, and ALDH5A1 served as a diagnostic signature and correlated with immune cell infiltration in ulcerative colitis
Abstract
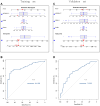
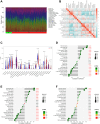
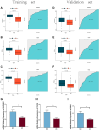
We conducted an investigation to determine the potential of mitochondrial-related genes as diagnostic biomarkers in ulcerative colitis (UC), while also examining their association with immune cell infiltration. To achieve this, we acquired four datasets pertaining to UC, which included gene expression arrays and clinical data, from the GEO database. Subsequently, we selected three signature genes (PDK2, CHDH, and ALDH5A1) to construct a diagnostic model for UC. The nomogram and ROC curves exhibited exceptional diagnostic efficacy. Following this, quantitative real-time polymerase chain reaction and western blotting assays validated the decreased mRNA and protein expression of PDK2, CHDH, and ALDH5A1 in the model of UC cells and dextran sulfate sodium salt (DSS)-induced mice colitis tissues, aligning with the findings in the risk model. This investigation suggested a negative correlation between the expression of ALDH5A1, CHDH, and PDK2 and the infiltration of M1 macrophages. Then, immunofluorescence analysis confirmed the augmented expression of CD86 in the tissue of mice subjected to DSS, while a diminished expression of ALDH5A1, CHDH, and PDK2 was observed. Consequently, it can be inferred that targeting mitochondria-associated genes, namely PDK2, CHDH, and ALDH5A1, holds potential as a viable strategy for prognostic prediction and the implementation of immune therapy for UC.
Keywords: aldehyde dehydrogenase 5 family member A1; choline dehydrogenase; immune infiltration; mitochondria; pyruvate dehydrogenase kinase 2; ulcerative colitis.
Conflict of interest statement
Figures




Similar articles
-
Comprehensive analysis of cuproptosis-related genes in immune infiltration and diagnosis in ulcerative colitis.Front Immunol. 2022 Oct 25;13:1008146. doi: 10.3389/fimmu.2022.1008146. eCollection 2022. Front Immunol. 2022. PMID: 36389705 Free PMC article.
-
Revealing immune infiltrate characteristics and potential diagnostic value of immune-related genes in ulcerative colitis: An integrative genomic analysis.Front Public Health. 2022 Oct 31;10:1003002. doi: 10.3389/fpubh.2022.1003002. eCollection 2022. Front Public Health. 2022. PMID: 36388363 Free PMC article.
-
Identification of differentially expressed genes in ulcerative colitis and verification in a colitis mouse model by bioinformatics analyses.World J Gastroenterol. 2020 Oct 21;26(39):5983-5996. doi: 10.3748/wjg.v26.i39.5983. World J Gastroenterol. 2020. PMID: 33132649 Free PMC article.
-
Comprehensive analysis of key biomarkers, immune infiltration and potential therapeutic agents for ulcerative colitis.Life Sci. 2020 Nov 1;260:118437. doi: 10.1016/j.lfs.2020.118437. Epub 2020 Sep 17. Life Sci. 2020. PMID: 32950577
-
Identification of cuproptosis-associated subtypes and signature genes for diagnosis and risk prediction of Ulcerative colitis based on machine learning.Front Immunol. 2023 Apr 5;14:1142215. doi: 10.3389/fimmu.2023.1142215. eCollection 2023. Front Immunol. 2023. PMID: 37090740 Free PMC article.
Cited by
-
Exploring the Biomarkers and Potential Mechanisms of Botulinum Toxin Type A in the Treatment of Microglial Inflammatory Activation through P2X7 Receptors based on Transcriptome Sequencing.Curr Pharm Des. 2024;30(38):3038-3053. doi: 10.2174/0113816128318908240730093036. Curr Pharm Des. 2024. PMID: 39177140
-
Mitophagy-Related Gene CHDH Predicts Prognosis and Immune Response and Inhibits Proliferation and Migration in vitro and in vivo of Oral Squamous Cell Carcinoma.J Inflamm Res. 2025 May 26;18:6831-6851. doi: 10.2147/JIR.S516427. eCollection 2025. J Inflamm Res. 2025. PMID: 40453965 Free PMC article.
-
Identification and Experimental Validation of Oxidative Stress-Related Biomarkers in Ulcerative Colitis Using Machine Learning.J Inflamm Res. 2025 Aug 20;18:11415-11435. doi: 10.2147/JIR.S520874. eCollection 2025. J Inflamm Res. 2025. PMID: 40860945 Free PMC article.
References
-
- Ng SC, Shi HY, Hamidi N, Underwood FE, Tang W, Benchimol EI, Panaccione R, Ghosh S, Wu JCY, Chan FKL, Sung JJY, Kaplan GG. Worldwide incidence and prevalence of inflammatory bowel disease in the 21st century: a systematic review of population-based studies. Lancet. 2017; 390:2769–78. 10.1016/S0140-6736(17)32448-0 - DOI - PubMed
Publication types
MeSH terms
Substances
LinkOut - more resources
Full Text Sources
Medical

