. 2024 Apr 1;223(4):e202307026.
doi: 10.1083/jcb.202307026. Epub 2024 Feb 20.

Tunable DNMT1 degradation reveals DNMT1/DNMT3B synergy in DNA methylation and genome organization

Affiliations

Tunable DNMT1 degradation reveals DNMT1/DNMT3B synergy in DNA methylation and genome organization

Andrea Scelfo et al. J Cell Biol. .

Abstract

DNA methylation (DNAme) is a key epigenetic mark that regulates critical biological processes maintaining overall genome stability. Given its pleiotropic function, studies of DNAme dynamics are crucial, but currently available tools to interfere with DNAme have limitations and major cytotoxic side effects. Here, we present cell models that allow inducible and reversible DNAme modulation through DNMT1 depletion. By dynamically assessing whole genome and locus-specific effects of induced passive demethylation through cell divisions, we reveal a cooperative activity between DNMT1 and DNMT3B, but not of DNMT3A, to maintain and control DNAme. We show that gradual loss of DNAme is accompanied by progressive and reversible changes in heterochromatin, compartmentalization, and peripheral localization. DNA methylation loss coincides with a gradual reduction of cell fitness due to G1 arrest, with minor levels of mitotic failure. Altogether, this system allows DNMTs and DNA methylation studies with fine temporal resolution, which may help to reveal the etiologic link between DNAme dysfunction and human disease.


Conflict of interest statement

Disclosures: J. Tost reported grants from the European Union, Agence National de Recherche, Fondation pour la Recherche Medicale, DBV Technologies, Anses, and UCB Pharma outside the submitted work. No other disclosures were reported.

Figures

Figure 1.
Figure 1.
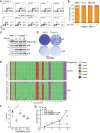
Inducible, rapid, and complete DNMT1 degradation. (A) Schematics of the endogenous DNMT1 gene tagging strategy to achieve protein degradation. OsTIR1: Oryza Sativa TIR1; Cul1: Ubiquitin ligase; Ub: ubiquitin. (B) Representative immunofluorescence analysis of NADNMT1 DLD-1 cells showing mNeonGreen-tagged DNMT1 signal (NT) and its degradation upon IAA treatment (24 h). Scale bar: 10 µm. (C) Quantification of nuclear mNeonGreen signal (DNMT1) in the indicated DLD-1 cell clones in untreated and IAA-treated conditions (24 h). +/+: WT; +/NA: heterozygous DNMT1-tagged clone; NA/NA: homozygous clone. Error bar represents the SEM; each dot represents one analyzed nucleus (n > 100 per condition). Unpaired t test: ****P < 0.0001. (D) Immunoblot analysis of DNMT protein levels in the indicated DLD-1 cell lines treated with IAA for 2 and 4 days (d) compared with untreated control. VINCULIN served as loading control. DNMT3B quantification normalized to VINCULIN and untreated control is also shown. N = 3. Unpaired t test: *P = 0.0265. (E) Immunoblot analysis and relative quantification showing DNMT1 reaccumulation after IAA W/O (4 days) in the indicated DLD-1 cell lines. VINCULIN served as loading control. DNMT1 levels were normalized to VINCULIN and untreated control. N = 3. Unpaired t test: **P = 0.0039. (F and G) Representative live-cell imaging (F) and relative quantification analysis (G) showing rapid DNMT1 depletion at the indicated times from IAA treatment in DLD-1 NADNMT1 cells. Each dot represents the mean value of analyzed cells per time point (n = 16 per condition). Error bar represents the SEM. Scale bar: 10 µm. m, min. Source data are available for this figure: SourceData F1.
Figure S1.
Figure S1.
Generation of an inducible DNMT1 degradation system. (A) Schematics of the endogenous DNMT1 gene tagging strategy by CRISPR/Cas9 approach. (B) Genotyping PCR on selected WT, NADNMT1, and NADNMT1/DNMT3B−/− clones showing homozygous tagging of DNMT1 gene with the mNeonGreen-AID module. (C) Cell doubling measurement obtained from real-time cell index of the indicated DLD-1 cells. Values are normalized to time 0. (D) Immunoblot analysis showing Myc-tag OsTIR1 expression in the indicated cell lines. VINCULIN served as loading control. (E) Immunoblot analysis with the DNMT1 antibody of the indicated cell lines and treatment conditions. VINCULIN served as loading control. (F) Representative immunofluorescence images (left) and relative quantification (right) of mNeonGreen fluorescence signal in the indicated cell lines. IAA treatment: 24 h. NA/WT: heterozygous clone; NA/NA: homozygous clone. Each dot represents one analyzed nucleus (n > 60 for condition). Error bars represent the SEM. Unpaired t test: ****P < 0.0001. d, day. Source data are available for this figure: SourceData FS1.
Figure 2.
Figure 2.
Induced DNMT1 degradation leads to progressive DNA demethylation. (A) Schematics of the experiments shown in panels B–I. (B) Representative agarose gel of COBRA at selected loci in the indicated cell lines and treatment conditions. BstUI and BstBI enzymes were used for TDRD6, Alu and Satellite II, respectively. (C) Quantification of methylated DNA (as percentage of total DNA) at the indicated regions by COBRA assay normalized to relative untreated control. Each dot represents one biological replicate (N = 3); error bars represent the SEM. Unpaired t test: Alu: *P = 0.049, **P = 0.017, ***P = 0.006, ****P < 0.0001; Satellite II: *P = 0.0456, **P = 0.013, ****P < 0.0001, n.s. = not significative; TDRD6: *P = 0.0255, **P = 0.001 and 0.003; ****P < 0.0001. (D) Combined violin-box plot showing the distribution of methylation β-values of probes identified by the EPIC array in the indicated cell line and conditions. Dark line indicates the medians; boxes indicate Q1 and Q3; whiskers extend to include 99% of the data. Wilcoxon sum rank test: ****P < 2.2*10−16. DAC: 4 days (d), 2.5 μM. (E) Genome annotation analysis of the DMPs identified in the indicated pair comparisons. The distribution of the EPIC array probes is shown as a reference. IGR: intergenic regions. A chi-square test was used to calculate P values and define significant changes in the distribution of DMPs of the indicated categories relative to EPIC array composition. Stars (*) indicate the genomic loci with major changes (i.e., contributing the most to the P value based on the standardized residuals, stdres > 2, calculated by R software). (F–I) Heatmap showing methylation intensity of DMPs (P < 0.05, Δβ-value ≥ 30%) among the indicated cell lines and conditions. The first two columns represent the DMPs identified in the indicated pairwise comparison. The methylation status of the same DMPs in the other cell lines and treatment conditions is also shown. Due to the limited capacity of graphical visualization of high number of DMPs, in F are shown 40,697 DMPs (Δβ-value ≥ 40%) out of 106,647 (Δβ-value ≥ 30%) as indicated in the text; in G are shown 18,874 DMPs (Δβ-value ≥ 40%) out of 46,739 (Δβ-value ≥ 30%) as indicated in the text; similarly, in H are shown 12,381 DMPs (Δβ-value ≥ 60%) out of 455,309 as stated in the text (Δβ-value ≥ 30%). DAC: 4 days, 2.5 μM. Number of identified DMPs between conditions are reported in Table S2. Source data are available for this figure: SourceData F2.
Figure S2.
Figure S2.
Induced DNMT1 degradation leads to progressive DNA demethylation. (A) Percentage of 5mC over total C quantified by LC-MS on DNA from the indicated DLD-1 cell lines and conditions. W/O: 4 days (d). Dots indicate independent experiments. N = 3. Error bars represent SEM. Unpaired t test: *P = 0.038; **P = 0.015; ****P < 0.0001. (B) Percentage of 5mC over total C quantified by LC-MS on DNA from the indicated RPE-1 cell lines and conditions. Dots indicate independent experiments. N = 3. Error bars represent SEM. Unpaired t test: **P = 0.014. (C) Representative immunofluorescence images of the indicated cell lines and treatment conditions with a 5mC antibody. mNeonGreen was used to detect DNMT1. Scale bar: 10 µm. (D) Quantification of 5mC nuclear signal at different times of IAA treatment of NADNMT1 cells. Each dot corresponds to one analyzed nucleus (n > 74 for condition). Error bars represent SEM. Unpaired t test: *P = 0.0348, ***P = 0.002 ****P < 0.0001. (E) MeDIP analysis at selected promoter regions in the indicated cell lines and conditions. IgG served as isotype control. Each dot corresponds to the mean value of one replicate (N = 3), done in technical duplicate (n = 2). Error bars represent SEM. Unpaired t test. *P = 0.0495, 0.00257; **P = 0.0025. (F) PCA plot of DNAme variations among the indicated cell lines and treatment conditions. Biological replicates are represented by individual dots, same conditions are enclosed by a dashed ellipse. (G) Genomic snapshot of a region on chromosome 2 with different features (epilogos) showing: DMPs between the indicated conditions; H3K9me3 and H3K27me3 ChIP-seq profiles in the indicated cell lines. (H) Venn diagram indicating the numbers of common and unique DMPs (Δβ-value ≥ 30%) identified in the indicated comparisons.
Figure S3.
Figure S3.
DNMT3A-independent locus-specific hypermethylation in DNMT3B KO cells. (A) Representative genomic snapshots showing hypermethylation of two regions on chromosome 16 with relative features (epilogos). The following profiles on the indicated cells are shown: DMPs between the indicated conditions; H3K9me3 and H3K27me3 ChIP-seq. (B) Immunoblot analysis of DNMT3A and DNMT3B levels on indicated cell lines and treatment conditions. VINCULIN served as loading control. DNMT3A KD was performed for 4 days (d). (C) Percentage of 5mC over total C quantified by LC-MS on DNA from the indicated DLD-1 cell lines and conditions. Dots indicate independent experiments. N = 3. Error bars represent SEM. Unpaired t test: *P = 0.0263, **P = 0.0031 and 0.0049, ***P = 0.0007 and 0.0005, ****P < 0.0001, ns = not significant. (D) Quantification of methylated DNA (as percentage of the total) at the indicated regions by COBRA assay normalized to relative untreated control. Each dot represents one biological replicate (N = 3); error bars represent the SEM. Unpaired t test: ****P < 0.0001. (E and F) Distribution of the indicated pairwise hypo-DMPs relative to the 15 chromatin states (ChromHMM from ENCODE, Hep2G cell line) compared with the distribution of all the probes present on the EPIC array. Since the originally described 4th and 5th, 6th and 7th, 14th and 15th chromatin states (strong enhancers, weak enhancers, and repetitive/CNV, respectively) are identical, they have been merged in our analysis for a total of 12 chromatin states. A chi-square test was used to calculate the P value and define significant changes in the distribution of DMPs of the indicated categories relative to EPIC array composition. Stars (*) indicate the chromatin states with a major change (i.e., contributing the most to the P value based on the standardized residuals, stdres > 2, calculated by R software). (G and H) Distribution of the indicated pairwise hypo-DMPs relative to the annotated DNA repeats (Repeat Masker) compared to the distribution of all the probes present on the EPIC array. A chi-square test was used to calculate P value and define significant changes in the distribution of DMPs of the indicated categories relative to EPIC array composition. Stars (*) indicate the categories with major change (i.e., contributing the most to the P value based on the standardized residuals, stdres > 2). Source data are available for this figure: SourceData FS3.
Figure 3.
Figure 3.
DNMTs degradation impairs cell proliferation. (A) Cell cycle profiling by EdU/DAPI incorporation upon induced DNMT1 degradation at the indicated days from IAA treatment in DLD-1 NADNMT1 (left) and NADNMT1/DNMT3B−/− cells. N = 2, Error bars represent SEM. (B) Quantification of S phase (% over the total) from A in the indicated cell lines and treatment conditions. Dots represent biological replicates (N = 2); bars represent the mean with SEM. (C) Real-time cell index measurement of the indicated DLD-1 cell lines upon IAA treatment. Measurements were normalized to the 16 h time point, time of IAA addition after seeding. Curves represent the mean cell index value from triplicates ± SD (N = 3). Unpaired t test: **P = 0.0044; *P = 0.0268. (D and E) Representative images of colony formation assay and relative schematics and quantifications performed in the indicated DLD-1 cell lines and treatment conditions. Number of colonies obtained in selected conditions are plotted in E. N = 3. Error bars represent SEM. Unpaired t test: ****P < 0.0001; ***P = 0.002; *P = 0.025, 0.021. d, day.
Figure S4.
Figure S4.
DNMTs degradation impairs cell proliferation. (A) Representative plot of cell cycle analysis of NADNMT1 and NADNMT1/DNMT3B−/− DLD-1 cells upon IAA treatment for the indicated times. Shown gates were set with the auto-gating tool (FlowJo). (B) Quantification of cell cycle phases of the NADNMT1 RPE-1 cells treated with IAA for the indicated times. (C) Immunoblot analysis with the indicated antibodies of cell extract from NADNMT1 RPE-1 cells. VINCULIN served as loading control. d, day. (D) Representative images of colony formation assay of the NADNMT1 RPE-1 cells treated with IAA for 12 days. (E) Single-cell whole-genome sequencing of NADNMT1/DNMT3B−/− treated cells as indicated (8 days IAA treatment). Each row represents an individual cell, and chromosomes are plotted as columns. Colors correspond to a defined copy-number state (legend on the right). The percentage of cells showing whole-chromosome aneuploidy (loss or gain, besides chromosomes 8 and 13) is also indicated. (F) Quantification of methylated DNA (as percentage of the total DNA) of NADNMT1 DLD-1 cells treated for 6 days as indicated. DAC: 2.5 μM. Dots indicate independent experiments. N > 3. Error bars represent SEM. Unpaired t test: *P = 0.0225, 0.0172. (G) Cell proliferation measurement (WST-1 method) of NADNMT1 DLD-1 cells treated as indicated. DAC: 2.5 μM. Dots indicate the mean of three independent replicates (N = 3), performed in technical triplicates (n = 3). Error bars represent SEM. # denotes OD(450–690) > 4 indicating cell over confluency. Unpaired t test: ****P < 0.0001. Source data are available for this figure: SourceData FS4.
Figure 4.
Figure 4.
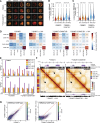
DNMTs sustain subnuclear compartmentalization of inactive chromatin. (A) Representative immunofluorescence images of hybrid microscopy-cytometry analysis of H3K9me3 and H3K27me3 on the indicated DLD-1 cell lines and conditions (IAA: 10 days). Scale bar: 7 μm. (B and C) Ratio of the nuclear H3K9me3 (B) and H3K27me3 (C) signal intensities over the signal measured at the nuclear periphery by hybrid microscopy-FACS analysis in the indicated cell lines and conditions. IAA: 10 days. W/O experiments were analyzed 4 days after IAA removal (IAA: 6 days). Each point represents the ratio value for one single nucleus. n = 1,375–15,005 cells per condition. Wilcoxon Signed Rank Test: ****P < 0.0001. (D) Heatmaps of pairwise aggregate observed/expected contact frequency between IPGs, derived from 50-kb resolution contact maps for untreated and 10-days IAA-treated NADNMT1 cells and untreated and 10 days IAA-treated NADNMT1/DNMT3B−/− cells, respectively. (E) Time courses of observed/expected contact frequency in trans (top) and in cis (bottom) within the same five defined IPGs in the indicated cell lines and conditions. The W/O experiment was analyzed 4 days (d) after IAA withdrawal (IAA: 4 days). (F) Example of DLD1-B4 disruption on a region of chromosome 19 in NADNMT1 (left) and NADNMT1/DNMT3B−/− (right) after 10 days of IAA treatment. Top to bottom: tracks of H3K9me3 (fold change over input) and CpG methylation (SWAN-normalized β-values from EPIC array analyses) signal in untreated cells, Hi-C from untreated (top right) and treated cells (bottom left), tracks of H3K9me3 and CpG methylation from treated cells. Left: Colored track of IPG classification derived from untreated NADNMT1 cells. Arrows point to a zone of distal DLD1-B4 interaction that is visibly depleted upon treatment. (G) Scatter plot showing loss of H3K9me3 ChIP-seq signal density (mean fold change over input) upon DNMT3B deletion (left) and DNMT1 depletion (10 days, right) in NADNMT1/DNMT3B−/− cells. Each point represents a 10-kb genomic bin.
Figure S5.
Figure S5.
Assignments of subnuclear compartmentalization of NADNMT1 and NADNMT1/DNMT3B−/− DLD-1 cells. (A) Representative ImageStream images and schematics showing mask building strategy for detection of nuclear and nuclear periphery areas. Masks are based on DNA area signal (PI). Dilated and eroded masks refer to pixels added (+1) and subtracted (−4) to the whole nuclear area, respectively. Pxl: pixel. Scale bar: 7 μm. (B) Plots showing interaction frequency as a function of genomic distance (P[s] curves) for Hi-C maps performed in the indicated cell lines and treatment conditions. Bottom panel shows the P(s) derivative indicating average size of extruded loops. W/O experiment was analyzed 4 days (d) after IAA withdrawal (IAA treatment: 4 days). (C) Integrated heatmaps of various features (rows) for each 50-kb genomic bin (column). Bins are sorted into groups derived from clustering of eigenvectors from untreated NADNMT1 Hi-C data. Within each cluster, bins are sorted by distance from the centromere. Top section: consolidated IPG labels (color-coded) and eigenvector clusters labels I–IX below them, followed by the first 10 trans eigenvectors from untreated NADNMT1 Hi-C. Middle section: Mean signal intensity of functional genomics features: GC content, distance from centromere, bulk RNA-seq signal and H3K27me3 ChIP-seq from WT DLD1 cells (Rokavec et al., 2017), H3K9me3 ChIP-seq, and CpG methylation data from this study. Bottom section: first 10 trans eigenvectors from 10-day IAA-treated NADNMT1 Hi-C data, showing cluster IV (i.e., IPG DLD1-B4) as the most impacted by treatment. Bottom right inset: Donut plot of IPG composition across autosomes, showing 19% of regions excluded from analysis due to poor mapability or translocations. Bottom left inset: Distribution of DLD1-B4 coverage by chromosome shows it is predominantly found on chromosome 19. (D) Scatter plot showing H3K27me3 ChIP-seq signal density (mean fold change over input) upon DNMT3B deletion (left) and DNMT1 depletion (10 days, right) in NADNMT1/DNMT3B−/− cells. Each point represents a 10-kb genomic bin. (E) ChIP-qPCR analyses of H3K9me3 (left) and H3K27me3 (right) at selected genomic loci using the indicated primer sets (Table S1) as validation of relative ChIP-seq experiment in the shown cell lines and conditions. Error bars represent SEM. (F) Time courses of Hi-C in the chromosome 19 region from Fig. 4 E, in the indicated cell lines and conditions. W/O experiment was analyzed 4 days after IAA removal (IAA treatment: 4 days). (G) Distribution of SNIPER subcompartment label predictions of 50-kb loci from untreated NADNMT1 cells, grouped by the de novo IPG classification in this study. (H) Example of DLD1-B2/3 interaction profile disruption of DLD1-B2/3 in the NADNMT1/DNMT3B−/− background compared with the NADNMT1 one in a large region on chromosome 18. Relative H3K9me3 and CpG methylation (SWAN normalized β-value from the EPIC array) signals are also shown (as in Fig. 4 F). (I) Distribution of hypo and hypermethylated (log2 fold change < 2 and > 2, respectively) DMPs identified in NADNMT1/DNMT3B−/− cells compared to NADNMT1 cells in the defined DLD-1 IPG clusters.

References

    1. Arand, J., Spieler D., Karius T., Branco M.R., Meilinger D., Meissner A., Jenuwein T., Xu G., Leonhardt H., Wolf V., and Walter J.. 2012. In vivo control of CpG and non-CpG DNA methylation by DNA methyltransferases. PLoS Genet. 8:e1002750. 10.1371/journal.pgen.1002750 - DOI - PMC - PubMed
    1. Bakker, B., Taudt A., Belderbos M.E., Porubsky D., Spierings D.C., de Jong T.V., Halsema N., Kazemier H.G., Hoekstra-Wakker K., Bradley A., et al. . 2016. Single-cell sequencing reveals karyotype heterogeneity in murine and human malignancies. Genome Biol. 17:115. 10.1186/s13059-016-0971-7 - DOI - PMC - PubMed
    1. Besselink, N., Keijer J., Vermeulen C., Boymans S., de Ridder J., van Hoeck A., Cuppen E., and Kuijk E.. 2023. The genome-wide mutational consequences of DNA hypomethylation. Sci. Rep. 13:6874. 10.1038/s41598-023-33932-3 - DOI - PMC - PubMed
    1. Bestor, T.H., Edwards J.R., and Boulard M.. 2015. Notes on the role of dynamic DNA methylation in mammalian development. Proc. Natl. Acad. Sci. USA. 112:6796–6799. 10.1073/pnas.1415301111 - DOI - PMC - PubMed
    1. Bird, A.P. 1986. CpG-rich islands and the function of DNA methylation. Nature. 321:209–213. 10.1038/321209a0 - DOI - PubMed

Publication types

LinkOut - more resources