. 2024 Mar;50(3):371-384.
doi: 10.1007/s00134-024-07324-8. Epub 2024 Feb 20.

Early systemic insults following traumatic brain injury: association with biomarker profiles, therapy for intracranial hypertension, and neurological outcomes-an analysis of CENTER-TBI data

Collaborators, Affiliations

Early systemic insults following traumatic brain injury: association with biomarker profiles, therapy for intracranial hypertension, and neurological outcomes-an analysis of CENTER-TBI data

Chiara Robba et al. Intensive Care Med. 2024 Mar.

Abstract

Purpose: We analysed the impact of early systemic insults (hypoxemia and hypotension, SIs) on brain injury biomarker profiles, acute care requirements during intensive care unit (ICU) stay, and 6-month outcomes in patients with traumatic brain injury (TBI).

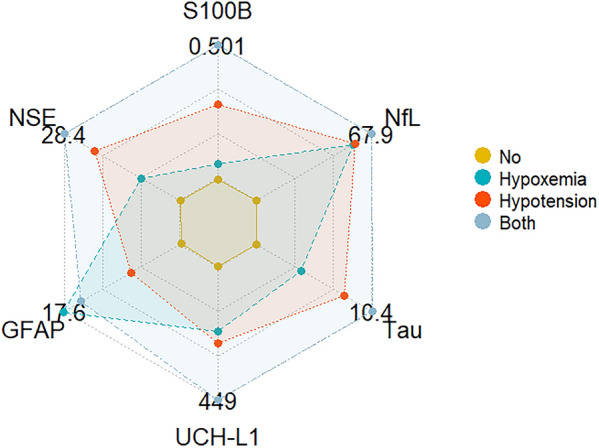
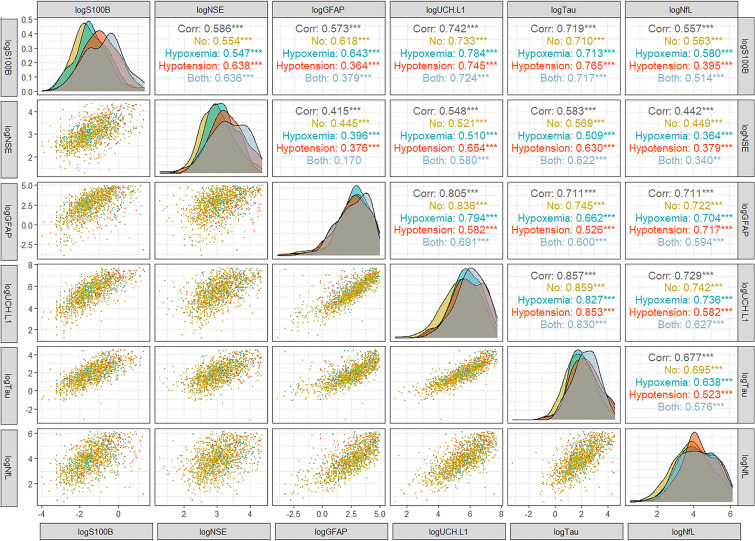
Methods: From patients recruited to the Collaborative European neurotrauma effectiveness research in TBI (CENTER-TBI) study, we documented the prevalence and risk factors for SIs and analysed their effect on the levels of brain injury biomarkers [S100 calcium-binding protein B (S100B), neuron-specific enolase (NSE), neurofilament light (NfL), glial fibrillary acidic protein (GFAP), ubiquitin carboxy-terminal hydrolase L1 (UCH-L1), and protein Tau], critical care needs, and 6-month outcomes [Glasgow Outcome Scale Extended (GOSE)].

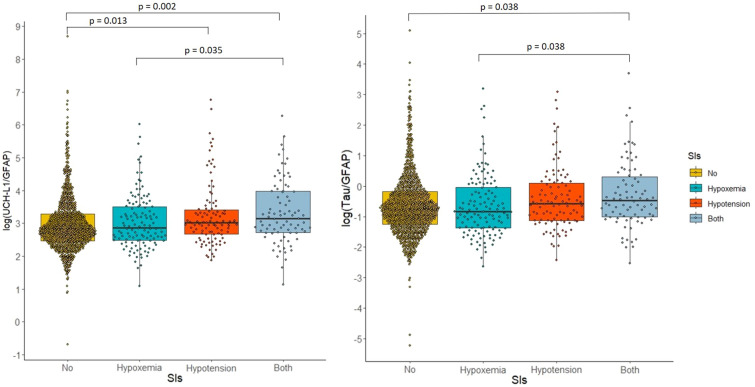
Results: Among 1695 TBI patients, 24.5% had SIs: 16.1% had hypoxemia, 15.2% had hypotension, and 6.8% had both. Biomarkers differed by SI category, with higher S100B, Tau, UCH-L1, NSE and NfL values in patients with hypotension or both SIs. The ratio of neural to glial injury (quantified as UCH-L1/GFAP and Tau/GFAP ratios) was higher in patients with hypotension than in those with no SIs or hypoxia alone. At 6 months, 380 patients died (22%), and 759 (45%) had GOSE ≤ 4. Patients who experienced at least one SI had higher mortality than those who did not (31.8% vs. 19%, p < 0.001).

Conclusion: Though less frequent than previously described, SIs in TBI patients are associated with higher release of neuronal than glial injury biomarkers and with increased requirements for ICU therapies aimed at reducing intracranial hypertension. Hypotension or combined SIs are significantly associated with adverse 6-month outcomes. Current criteria for hypotension may lead to higher biomarker levels and more negative outcomes than those for hypoxemia suggesting a need to revisit pressure targets in the prehospital settings.

Keywords: Hypotension; Hypoxemia; Outcome; Serum biomarkers; Systemic insults; Traumatic brain injury.


Conflict of interest statement

GC reports grants and personal fees as a speakers' bureau member and advisory board member from Integra Neurosciences, NeurOptics, Biogen, Invex Ltd and Idorsia, all outside the submitted work. DKM reports consultancy fees, speaker fees, or research collaborations with NeuroTrauma Sciences, Lantmannen AB, GlaxoSmithKline Ltd, Pressura Neuro Ltd, Integra Neurosciences, and Invex Ltd. CR reports speaker fees from Edwards Life Sciences and Masimo. The other authors did not declare competing interests.

Figures

Fig. 1
Fig. 1
Radar plot of serum biomarker levels according to the presence of systemic insults. The centre of the radar shows the minimum median value for each serum biomarker. The outer shows the maximum value. S100B S100 calcium-binding protein B, NSE Neuron Specific Enolase, NfL neurofilament light chain protein, UCH-L1 ubiquitin carboxy-terminal hydrolase L1, GFAP glial fibrillary acidic protein
Fig. 2
Fig. 2
Correlation between the logarithm of serum biomarker levels in all patients and according to the presence of SIs. The labelling of the x and y axes is presented on each side of the figure. Following parameters are displayed in logarithm scale: logS100B, logNSE, logGFAP, logUCH-L1, logTau and logNfL. In the diagonal, the distributions of each serum biomarker by SIs are shown with different colours (yellow = No SIs, light blue = Hypoxemia, orange = Hypotension and grey = Both SIs). The lower triangular matrix comprises the bivariate scatter plots of serum biomarkers (on the logarithm scale). Patients in the four classes of SIs are represented with different colours. In the diagonal plots, the distribution of each biomarker is shown by the presence of SIs. The upper triangular matrix of the correlogram shows the Pearson correlation coefficient and its significance level estimated on all patients (Corr) and in each SIs group (No, Hypoxemia, Hypotension, Both). As an explicative example, in the middle panel correspondent to log GPAP and log UCH-L1 (row 4 and column 3), it is shown the scatter plots of the two biomarkers coloured according to the different SIs categories denoting high linear correlation among the two. In the panel at row 3 and column 4 the correlation coefficients between the two biomarkers are provided: 0.805 in the overall population, 0.83 in patients without SI, 0.79 in patients with only hypoxemia, 0.58 in those with only hypotension, and 0.69 in those with both SIs; all being significantly different from 0 (p < 0.001). In the diagonal panels (raw and column 3 and raw and column 4), we present the distribution of log GPAP and UCH-l1 among the different categories of SIs, respectively. P values are as follows: ***< 0.001, **0.001. Corr correlation, GFAP glial fibrillary acidic protein, NfL neurofilament light, NSE neuron-specific enolase, SIs systemic insults, S100B S100 calcium-binding protein B, UCH-L1 ubiquitin carboxy-terminal hydrolase L1
Fig. 3
Fig. 3
Distribution of the ratio UCH-L1/GFAP and Tau/GFAP (log-transformed) among systemic insults. Significant adjusted p values of the pairwise comparisons are reported. GFAP glial fibrillary acidic protein, SIs systemic insults, UCH-L1 ubiquitin carboxy-terminal hydrolase L1

References

    1. Maas AIR, Menon DK, Manley GT, et al. Traumatic brain injury: progress and challenges in prevention, clinical care, and research. Lancet Neurol. 2022;21:1004–1060. doi: 10.1016/s1474-4422(22)00309-x. - DOI - PMC - PubMed
    1. Meyfroidt G, Bouzat P, Casaer MP, et al. Management of moderate to severe traumatic brain injury: an update for the intensivist. Intensive Care Med. 2022;48:649–666. doi: 10.1007/s00134-022-06702-4. - DOI - PubMed
    1. Maas AIR, Marmarou A, Murray GD, et al. Prognosis and clinical trial design in traumatic brain injury: the IMPACT study. J Neurotrauma. 2007;24:232–238. doi: 10.1089/neu.2006.0024. - DOI - PubMed
    1. Lazaridis C, Rusin CG, Robertson CS. Secondary brain injury: predicting and preventing insults. Neuropharmacology. 2019;145:145–152. doi: 10.1016/j.neuropharm.2018.06.005. - DOI - PubMed
    1. Spaite DW, Hu C, Bobrow BJ, et al. The effect of combined out-of-hospital hypotension and hypoxia on mortality in major traumatic brain injury. Ann Emerg Med. 2017;69:62–72. doi: 10.1016/j.annemergmed.2016.08.007. - DOI - PMC - PubMed