. 2024 Feb 20;134(8):e174215.
doi: 10.1172/JCI174215.

The HIV-1 reservoir landscape in persistent elite controllers and transient elite controllers

Affiliations

The HIV-1 reservoir landscape in persistent elite controllers and transient elite controllers

Carmen Gasca-Capote et al. J Clin Invest. .

Abstract

BACKGROUNDPersistent controllers (PCs) maintain antiretroviral-free HIV-1 control indefinitely over time, while transient controllers (TCs) eventually lose virological control. It is essential to characterize the quality of the HIV reservoir in terms of these phenotypes in order to identify the factors that lead to HIV progression and to open new avenues toward an HIV cure.METHODSThe characterization of HIV-1 reservoir from peripheral blood mononuclear cells was performed using next-generation sequencing techniques, such as full-length individual and matched integration site proviral sequencing (FLIP-Seq; MIP-Seq).RESULTSPCs and TCs, before losing virological control, presented significantly lower total, intact, and defective proviruses compared with those of participants on antiretroviral therapy (ART). No differences were found in total and defective proviruses between PCs and TCs. However, intact provirus levels were lower in PCs compared with TCs; indeed the intact/defective HIV-DNA ratio was significantly higher in TCs. Clonally expanded intact proviruses were found only in PCs and located in centromeric satellite DNA or zinc-finger genes, both associated with heterochromatin features. In contrast, sampled intact proviruses were located in permissive genic euchromatic positions in TCs.CONCLUSIONSThese results suggest the need for, and can give guidance to, the design of future research to identify a distinct proviral landscape that may be associated with the persistent control of HIV-1 without ART.FUNDINGInstituto de Salud Carlos III (FI17/00186, FI19/00083, MV20/00057, PI18/01532, PI19/01127 and PI22/01796), Gilead Fellowships (GLD22/00147). NIH grants AI155171, AI116228, AI078799, HL134539, DA047034, MH134823, amfAR ARCHE and the Bill and Melinda Gates Foundation.

Keywords: AIDS vaccine; AIDS/HIV; Virology.


Conflict of interest statement

Conflict of interest: ERM and CGC are authors on the patent “Methods to determine the thymic function by droplet digital PCR system” under patent number EP23383145.

Figures

Figure 1
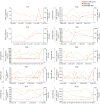
Figure 1. CD4+ T cell counts, viral load levels, and the CD4/CD8 ratio in TCs.
CD4+ T cell counts and the CD4/CD8 ratio were represented in the left axes (CD4+ T cell count in orange and CD4/CD8 ratio in green) and viral load levels in the right axes (red). CD8+ T cell counts were unavailable in TC1 and TC3. The black dot represents the studied time point that preceded the loss of the virological control.
Figure 2
Figure 2. Analysis of HIV-1 proviral sequences in PCs, TCs, and participants on ART.
(A) Total, (B) defective, and (C) intact provirus levels in PCs, TCs, and participants on ART. Grey dots represent values below the limit of detection (expressed as 0.05 copy/total number of analyzed cells without target identification). PCs and TCs are represented by unique identifiers (Supplemental Tables 1 and 2). Each dot represents a participant. Mann-Whitney U test was used to compare PCs, TCs, and participants on ART. P < 0.05 was considered statistically significant. **P ≤ 0.01, ****P ≤ 0.0001.
Figure 3
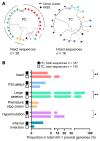
Figure 3. Genome-proviral sequences in PCs and TCs.
(A) Circular maximum-likelihood phylogenetic trees for all genome-intact proviral sequences from PCs and TCs. HXB2 was used as the reference HIV-1 sequence. Dots with the same colors represent genome-intact proviral sequences from the same participant. Clonal sequences are indicated by black arches. PCs and TCs are represented by unique identifiers (Supplemental Tables 1 and 2). (B) Proportions of nonclonal genome-proviral sequences. Intact and defective proviruses as packaging signal defect (PSI), large deletion (LD), premature stop codon (PMSC) hypermutations and internal inversion, were included. FDR-adjusted 2-tailed Fisher’s exact tests were used to compare PCs and TCs. P < 0.05 was considered statistically significant. *P ≤ 0.05, **P ≤ 0.01.
Figure 4
Figure 4. Simultaneous analysis of HIV-1 proviral sequences and integration sites in linear maximum-likelihood phylogenetic trees.
Coordinates and relative positioning of integration sites are indicated. Clonal genome proviral sequences, defined by identical proviral sequences and identical corresponding integration sites, are highlighted in black boxes. The rest of the symbols represent different types of defective proviruses.
Figure 5
Figure 5. Cell-associated HIV-1-RNA in PCs and TCs.
(A) Cell-associated HIV-1-RNA, expressed as copies per 106 TBP RNA. Correlation between cell-associated HIV-1 RNA and (B) total, (C) intact and (D) defective genome proviruses in PCs and TCs. Each dot represents a participant. PCs and TCs are represented by unique identifiers (Supplemental Tables 1 and 2). Correlations were performed also excluding the participant in the red circle (PC1), in this case statistics are indicated in red. Mann-Whitney U test was used to compare PCs and TCs. P < 0.05 was considered statistically significant. *P ≤ 0.05. Spearman test was used for nonparametric correlations.
Figure 6
Figure 6. Longitudinal evolution of genome proviral reservoir landscape in PCs and TCs.
Total, intact, and defective proviruses levels in PC3, 4, 5, 6, and TC10 over time.
Figure 7
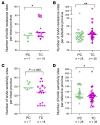
Figure 7. Analysis of bnAb resistance and sensitivity signature sites in intact and defective proviral sequences of PCs and TCs.
Number of bnAb resistance sites per (A) intact and (B) defective provirus in PCs and TCs. Number of bnAb sensitivity sites per (C) intact and (D) defective provirus in PCs and TCs. Each dot represents an intact or defective proviral sequence. PCs and TCs are represented by unique identifiers (Supplemental Table 1 and 2). Mann-Whitney U test was used to compare PCs and TCs. P < 0.05 was considered statistically significant. *P ≤ 0.05, **P ≤ 0.01.
Figure 8
Figure 8. HIV-1-specific T-cell response in PCs and TCs.
(A) HIV-1-specific CM CD4+ T cell polyfunctionality with up to 5 functional responses to Gag stimulation per T cell in PCs and TCs. The 5 functional responses to Gag stimulation represent the simultaneous production of IFNG, TNFA, IL-2, CD107a, and PRF per T cell. IFNG, TNFA, IL-2, CD107a, and PRF are shown in arcs in the polyfunctional distribution. Pestle and Spice were used for analysis. Correlations between Gag-specific CM T cell response with total HIV DNA levels (106 peripheral blood mononuclear cells [PBMCs]) in (B) TCs and (C) PCs. Each dot represents a participant. PCs and TCs are represented by unique identifiers (Supplemental Table 1 and 2). Spearman test was used for nonparametric correlations. *P ≤ 0.05.
Figure 9
Figure 9. HIV-specific CD8+ T cell proliferation assay.
(A) TC2, (B) TC4, (C) PC1 T0, (D) PC7, and (E) PC1 T1 (1 year after T0). C+: stimulated PBMCs with Staphylococcal enterotoxin B (SEB) (left panel). C–: unstimulated PBMCs (middle panel). Experimental: stimulated PBMCs with HIV (Gag)-specific peptide (right panel) after 5 days in culture.
Figure 10
Figure 10. Thymic function in PCs and TCs.
(A) Dot graphs represent sj/β-TREC ratio. (B) Correlations between sj/β-TREC ratio and age in PCs sand TCs. (C) Correlations between sj/β-TREC ratio and the frequency of intact HIV DNA (106 PBMCs) in TC. Each dot represents a participant. PCs and TCs are represented by unique identifiers (Supplemental Table 1 and 2). Mann-Whitney U test was used to compare PCs and TCs. Spearman test was used for nonparametric correlations. P < 0.05 was considered statistically significant. *P ≤ 0.05.

Similar articles

Cited by

References

    1. Lambotte O, et al. HIV controllers: a homogeneous group of HIV-1-infected patients with spontaneous control of viral replication. Clin Infect Dis. 2005;41(7):1053–1056. doi: 10.1086/433188. - DOI - PubMed
    1. Mastrangelo A, et al. Elite and posttreatment controllers, two facets of HIV control. Curr Opin HIV AIDS. 2022;17(5):325–332. doi: 10.1097/COH.0000000000000751. - DOI - PMC - PubMed
    1. Olson AD, et al. An evaluation of HIV elite controller definitions within a large seroconverter cohort collaboration. PLoS One. 2014;9(1):e86719. doi: 10.1371/journal.pone.0086719. - DOI - PMC - PubMed
    1. Navarrete-Muñoz MA, et al. Elite controllers: A heterogeneous group of HIV-infected patients. Virulence. 2020;11(1):889–897. doi: 10.1080/21505594.2020.1788887. - DOI - PMC - PubMed
    1. Pernas M, et al. Factors leading to the loss of natural elite control of HIV-1 infection. J Virol. 2018;92(5):e01805. doi: 10.1128/JVI.01805-17. - DOI - PMC - PubMed

Substances