. 2024 Feb 27;43(2):113810.
doi: 10.1016/j.celrep.2024.113810. Epub 2024 Feb 19.

Proteogenomic characterization of primary colorectal cancer and metastatic progression identifies proteome-based subtypes and signatures

Affiliations

Proteogenomic characterization of primary colorectal cancer and metastatic progression identifies proteome-based subtypes and signatures

Atsushi Tanaka et al. Cell Rep. .

Abstract

Metastatic progression of colorectal adenocarcinoma (CRC) remains poorly understood and poses significant challenges for treatment. To overcome these challenges, we performed multiomics analyses of primary CRC and liver metastases. Genomic alterations, such as structural variants or copy number alterations, were enriched in oncogenes and tumor suppressor genes and increased in metastases. Unsupervised mass spectrometry-based proteomics of 135 primary and 123 metastatic CRCs uncovered distinct proteomic subtypes, three each for primary and metastatic CRCs, respectively. Integrated analyses revealed that hypoxia, stemness, and immune signatures characterize these 6 subtypes. Hypoxic CRC harbors high epithelial-to-mesenchymal transition features and metabolic adaptation. CRC with a stemness signature shows high oncogenic pathway activation and alternative telomere lengthening (ALT) phenotype, especially in metastatic lesions. Tumor microenvironment analysis shows immune evasion via modulation of major histocompatibility complex (MHC) class I/II and antigen processing pathways. This study characterizes both primary and metastatic CRCs and provides a large proteogenomics dataset of metastatic progression.

Keywords: CP: Cancer; biomarkers; colorectal cancer; hypoxia; mass spectrometry; metastasis; molecular signature; proteomics; stemness; subtyping; tumor immune microenvironment.


Conflict of interest statement

Declaration of interests D.S.K. was a consultant for and is now employed by Paige.AI. P.G.B. and J.G. are employees of and hold equity interests in Genuity Science. J.Y.W. is the founder of Curandis. M.H.A.R. is a member of the scientific advisory boards of Azenta Life Sciences and Universal DX. None of these companies had any role in design, execution, data analysis, or any other aspect of this study.

Figures
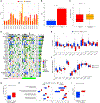
Figure 1.
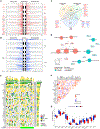
Figure 1.. SV landscape and downstream effect on molecular pathways
(A) SV event number with gene involvement. All samples have more than 100 structural events, ranging from 104 to 666 per sample. There is no significant difference in SV event number between pCRC and mCRC. (B) SV event frequency of CAGs and non-CAGs. Among 723 CAGs, 19.1% (138 CAGs) are affected by SVs. However, only 4.9% (2,846) of non-CAGs (58,290 genes) are affected by SVs (chi-square test, p < 10E–5). CAG, cancer-associated gene. (C) Boxplot of SV-affected CAGs comparing pCRC (n = 16) and mCRC (n = 16). While not statistically significant, mCRC has slightly more SV events than pCRC (Wilcoxon test). (D) Oncoprint of 30 recurrently (>8 times) SV-affected genes in cohort 1 (16 pCRC, 16 mCRC). Among these, 11 genes (*) overlap with commonly SV-affected genes reported in the Pan-Cancer Analysis of Whole Genomes (PCAWG) Consortium. DUP, duplication; DEL, deletion; INV, inversion; INS, insertion; BND, translocation; MULTI, multiple SV events. (E) Copy number boxplot of the top 12 SV-affected genes grouped by SV status. Only 3 genes (FHIT, RBFOX1, and PRKN) show a significant copy number decrease in the SV-affected group (Wilcoxon test). CCSER1 shows a decrease, but it is not statistically significant. The main SV event for these 4 genes is deletion. The remaining 8 genes have different SV event types. (F) mRNA expression levels (log2 transcript per million [TPM] values) of genes in (E). LINGO1 and CAM2B were not available in the RNA-seq data. Note that mRNA expression does not highly correlate with copy number status. MACROD2, TTC28, and CCSER1 show significant or close-to-significant expression decreases in the SV-affected group (Wilcoxon test). (G) Number of genome-wide SV events grouped by FHIT locus SV status (FHIT altered, n = 16; FHIT non-altered, n = 16). The FHIT locus SV-affected group shows significantly higher genome-wide SV events than the non-affected group. This is consistent with a report that loss of FHIT induces genome instability. (H) Normalized enrichment score boxplot of single-sample GSEA obtained from transcriptome (“RNA”) and proteome (“Protein”) data (Wilcoxon test). The FHIT locus SV-affected group shows significantly higher double-strand break signatures in several gene set terms at the mRNA and protein levels. This suggests that FHIT function is strongly connected to DNA double-strand repair mechanisms. This supports previously reported phenotypes in FHIT loss. (I) Boxplot of TMB (per MB) between the FHIT locus SV-affected group and non-affected group. Concordant with FHIT function, TMB is significantly higher in the FHIT locus SV-affected group than in the non-affected group.
Figure 2.
Figure 2.. Recurrent somatic copy number aberration and integrated genomic alterations
(A) Focal peak amplification plot. The left side shows pCRC, and the right side shows mCRC. Peaks with cytoband loci are statistically recurrent events in this cohort 1 (FDR < 0.05). Cytoband loci with a red color are shared between pCRC and mCRC. Cytoband loci with a black color denote specific events not shared between pCRC and mCRC. (B) Focal peak deletion plot. Cytoband loci with a red color are shared between pCRC and mCRC. Cytoband loci with a black color denote specific events not shared between pCRC and mCRC. (C) A Venn diagram of genes that are involved in recurrent focal peaks. Red-colored genes are involved in focal peak amplification, and blue-colored genes are involved in focal peak deletion. Recurrent focal peaks of pCRC involve 831 genes. Recurrent focal peaks of mCRC involve 1,173 genes. Among CAGs, 7 genes are specific to pCRC, and 11 genes are specific to mCRC. (D) A network plot of GOBP enrichment results in pCRC-mCRC shared CAGs (12 genes) and mCRC-specific CAGs (11 genes). GOBP enrichment analysis of mCRC specific genes shows β-catenin-related pathway enrichment and stemness enrichment. See also Figure 3. (E) Oncoprint of integrated genomic alterations with 10 or more events in cohort 1. Among 39 genes in this plot, 24 genes (61%) are mainly affected by SVs. Among genes with a greater than 50% genomic alteration rate, 4 genes (MACROD2, TTC28, FHIT, and LINGO1) of 7 genes are mainly affected by SVs. (F) Co-occurrence and mutual exclusiveness analysis of the top 19 genes that are involved in 12 samples or more. Shown is the co-occurrence exclusiveness score (log10(odds value)). (G) Among the 15 genes that were mainly affected by small SNVs, indels, or other alterations, 12 genes were quantified at the mRNA level. mRNA expression is generally downregulated in the genomically altered group.
Figure 3.
Figure 3.. Transcriptome and proteome analyses
(A) Heatmap of the transcriptome and proteome using significant DEGs genes with 4-fold change (pCRC vs. normal colon or mCRC vs. normal colon). Row order was clustered by the k-NN method with k = 3. Significant pathways are shown on the right side of the heatmap, as obtained from the Metascape web tool. Signature 1 is upregulated only in pCRC and downregulated in both pCRC and mCRC. Signature 2 is upregulated in both pCRC and mCRC and downregulated in normal colon. Signature 3 is specifically upregulated in mCRC. Signatures 1 and 2 are CRC common signatures regardless of tumor site. Signature 3 may have an important role in metastatic progression of CRC. (B) A balloon plot of canonical pathway enrichment (IPA software). The Z score is the predicted pathway activation status. Gray color means no directional information in the IPA knowledge database. Even though the individual input gene/protein list for IPA has significant enrichment of pathway genes/proteins, if a calculated confidence level of the entire pathway directional value remains under statistical significance, then IPA assigns a gray color. At the RNA level, many oncogenic pathways, such as the ERK/MAPK pathway and AKT pathway, are enriched in mCRC. In addition, hypoxic pathways are also enriched in mCRC. At the protein level, the LXR/RXR pathway is strongly enriched in mCRC. (C) Boxplots of immunohistochemistry scores for cohort 1 (Wilcoxon test). IHC assessment of tumor cells confirms enrichment of the hypoxia signature, stemness signature, common oncogenic signature, and RXR signature in mCRC. Normal colon, n = 16; pCRC, n = 16; mCRC, n = 16. Note: only CD44 and L1CAM were quantified in proteomics data. We did not perform direct correlation analyses between IHC score and proteome quantification because the IHC score is derived from tumor cell staining only, whereas proteomics data are derived from bulk tissue analysis (including cancer cells, stroma, inflammatory cells, etc.). (D) A heatmap of upstream regulators that govern RNA signature 2. Boxplots on the right show gene perturbation effect scores for 53 colon cancer cell lines when genes are edited by CRISPR-Cas9. Inhibition of these genes may have antitumor effects. * denotes 10 cell cycle-related genes that are annotated as GOBP_CELL_CYCLE (GO:0007049).
Figure 4.
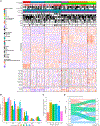
Figure 4.. Unsupervised clustering of cohort 2 reveals 6 subtypes
(A) A summary heatmap of clinical attributes and proteome data (top 250 proteins with largest mean absolute deviation within the cohort). IHC scores, stemness score, hypoxia score, and immune score are also shown. Gray color means a missing value. (B) A bar plot of the mutation frequency for each proteome subtype (Fisher’s exact test). TP53 mutations are significantly enriched in M2/3 compared with M1. KRAS mutations are significantly enriched in M1 compared with M2/3. PIK3CA mutations are significantly enriched in P2 compared with P1/3. (C) A bar plot of right-sided CRC frequency in each proteome subtype. Right-sided CRC of the P1 subtype has a significant lower frequency compared with P2/3 subtypes. (D) A Sankey plot of 68 matched pCRC-mCRC samples from cohort 2. This plot shows that proteomes of CRC have high plasticity during metastatic progression.
Figure 5.
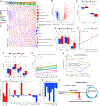
Figure 5.. Hypoxia signature of CRC
(A) A heatmap showing hypoxia signature correlation with EMT signature and metabolic reprogramming. The bar chart on the right side of the heatmap shows correlation values between the hypoxia score and the corresponding score. * denotes statistical significance (Spearman correlation coefficient). mCRC generally has a high hypoxia score (shown as “Tissue site” annotation bar). The Hallmark hypoxia score significantly correlates with known hypoxia-related features, such as angiogenesis or the EMT signature. (B) A volcano plot of DE analysis between hypoxia-high CRC (n = 129, right) and hypoxia-low CRC (n = 129, left). DE analysis identifies 805 significantly dysregulated proteins with an over 2-fold abundance change. (C) Boxplots of EMT markers. Vimentin and E-cadherin were significantly dysregulated in the hypoxia-high group. (D) Boxplots of IHC scores of EMT-inducing transcription factors. Only ZEB1 is significantly upregulated in the hypoxia-high group. 104 hypoxia-high group samples and 110 hypoxia-high group samples were assessed. (E) A correlation plot of TGF-β signaling and the EMT signature, showing significant positive correlation. (F) Boxplots of non-Smad TGF-β signaling pathway member expression. The PTEN/AKT/mTOR and MAPK pathways are significantly enriched in the hypoxia-high group. (G) A correlation plot of non-Smad TGF-β signaling and the EMT signature. pmTOR and pERK have significant positive correlations with the EMT signature. The direction of PTEN/Akt pathway activation also matches the EMT signature but is not statistically significant. (H) A GSE plot of metabolic reprogramming-related pathways in cohort 2 (hypoxia-high/low). Aerobic glycolysis and fatty acid metabolic processes are positively enriched in the hypoxia-high group. Conversely, oxidative phosphorylation and the TCA cycle are negatively enriched in the hypoxia-high group. (I) A bar plot of glucose transporter expression ratios (hypoxia-high/low). All glucose transporters are upregulated in the hypoxia-high group. * denotes statistical significance in the DE analysis shown in (B). (J) A bar plot of glycolysis-related enzyme expression ratios (hypoxia-high/low). Glycolysis-related enzymes show various expressional trends, but as a pathway, glycolysis is upregulated in the hypoxia-high group (H). * denotes statistical significance in the DE analysis shown in (B). (K) A bar plot of TCA cycle-related enzyme expression ratios (hypoxia-high/low). TCA cycle enzymes are downregulated in the hypoxia-high group. * denotes statistical significance in the DE analysis in (B). (L) A chart of metabolic reprogramming in CRC under hypoxia. Cancer cells utilize the aerobic glycolysis process to produce biologic energy.
Figure 6.
Figure 6.. Characteristics of cancer stemness
(A) DE analysis between stemness-low (n = 129) and stemness-high groups (n = 129) in cohort 2, identifying 1,089 significantly dysregulated proteins with over 2-fold abundance changes. (B) A bar plot of GSEA with Hallmark gene sets comparing stemness-low and stemness-high groups in cohort 2. All significant results (q < 0.05) are shown. The MYC target set is the top enriched term in the stemness-high group. In addition, cell cycle and DNA repair processes are significantly enriched in the stemness-high group. (C) A boxplot of the MYC IHC score. IHC scores were available for 111 stemness-high samples and 103 stemness-low samples. MYC expression is significantly higher in the stemness-high group than in the stemness-low group (Wilcoxon test). (D) A GSE plot of cell cycle-related Kyoto Encyclopedia of Genes and Genomes (KEGG) and REACTOME terms, showing cell cycle up-regulation in the stemness-high group with statistical significance. (E) A boxplot of the Ki67 index, showing significantly greater tumor cell proliferation in the stemness-high group than in the stemness-low group (Wilcoxon test). (F) A bar plot of ABC transporter protein expression ratios between stemness-low and stemness-high groups in cohort 2. All quantified ABC transporters except ABCA6 are upregulated in the stemness-high group, suggesting drug resistance. * denotes statistical significance in the DE analysis shown in (A). (G) A bar plot of GSEA results with the MSigDB c2 and c5 gene sets. Telomere-related terms with statistical significance are shown. (H) Bar plot of GSEA results with MSigDB REACTOME gene sets. DNA damage response-related terms with statistical significance are shown. (I) A correlation plot of the TEL score and stemness score shows significant positive correlation (Spearman correlation coefficient). (J) A correlation plot of the ALT score and stemness score shows that the ALT score has stronger correlation with the stemness score compared with the correlation between the TEL score and the stemness score (Spearman correlation coefficient). (K) Boxplot of the TEL score by tissue type, showing that only pCRC has high TEL activity (Wilcoxon test). (L) Boxplot of the ALT score by tissue type, showing that both pCRC and mCRC have higher ALT activity than normal tissue (Wilcoxon test). (M) Boxplot of the ALT/TEL score ratio by tissue type and proteome subtype, showing that M2 has a significantly higher ratio than pCRC subtypes (Wilcoxon test). (N) Boxplot of the stemness score by tissue type and proteome subtype. M2 has a significantly higher stemness score than pCRC, consistent with (M) and (J) (Wilcoxon test). (O) Boxplot of ATRX and DAXX IHC scores by tissue type, showing that both molecules are significantly downregulated in mCRC (Wilcoxon test).
Figure 7.
Figure 7.. Characterization of immune-cold tumors
(A) A heatmap with immune signature and clinical attributes. The immune score significantly correlates with IHC immune infiltrate scores and immune-related pathways, except for CD4 and FOXP3 IHC scores. * denotes statistical significance. (B) A GSE plot with antigen processing and presenting pathways from KEGG and REACTOME terms. Both antigen processing pathways are strongly downregulated in the immune-cold group. (C) A correlation plot (Spearman correlation coefficient) of IHC scores that involve the antigen processing machinery. Protein expression of STAT is derived from mass spectrometry data. The IFNγ response score is derived from ssGSEA analysis with HALLMARK_INTERFERON_GAMMA_RESPONSE. *p < 0.05, **p < 0.01, ***p < 0.001. Clear correlations of CD4-MHC class II and CD8-MHC class II are shown with statistical significance. In addition, the IFNγ pathway and STAT1 positively correlate with their direct targets (IRF1 and CIITA) and with downstream targets (MHC class I and II). (D) A correlation plot (Spearman correlation coefficient) with IRF1 IHC score and antigen processing machinery protein expression. *p < 0.05, **p < 0.01. ***p < 0.001. IRF1 expression positively correlates with immunoproteasome subunits but negatively correlates with catalytic conventional proteasome subunits. (E) Boxplots of IHC analysis results for HLA-ABC, HLA-DP/DQ/DR, CD3, CD4, CD8, IFR1, and CIITA. 22 P1, 42 P2, 51 P3, 16 M1, 53 M2, and 30 M3 samples were assessed. M1 shows the lowest expression of HLA-ABC (MHC class I) among all proteome subtypes. Although the infiltrating lymphocyte profile (CD3, CD4, and CD8) shows no significant differences, M1 has the lowest CD3+ lymphocyte count and lower median counts of CD8+ lymphocytes than other subtypes. This is concordant with the lowest expression of HLA-ABC (MHC class I) in the M1 subtype. In addition, IRF1, a key transcription initiator of MHC class I, shows the lowest expression in M1. (F) Kaplan-Meier survival curve analysis stratified by CD4 expression level of pCRC. (G) Kaplan-Meier survival curve analysis stratified by CD8 expression level of pCRC. (H) Kaplan-Meier survival curve analysis stratified by CD4 expression level of mCRC. (I) Kaplan-Meier survival curve analysis stratified by CD8 expression level of mCRC.

References

    1. Siegel RL, Miller KD, Fuchs HE, and Jemal A (2022). Cancer statistics, 2022. CA. Cancer J. Clin 72, 7–33. 10.3322/caac.21708. - DOI - PubMed
    1. Biller LH, and Schrag D (2021). Diagnosis and Treatment of Metastatic Colorectal Cancer: A Review. JAMA 325, 669–685. 10.1001/jama.2021.0106. - DOI - PubMed
    1. (2012). Comprehensive molecular characterization of human colon and rectal cancer. Nature 487, 330–337. 10.1038/nature11252. - DOI - PMC - PubMed
    1. Zhang B, Wang J, Wang X, Zhu J, Liu Q, Shi Z, Chambers MC, Zimmerman LJ, Shaddox KF, Kim S, et al. (2014). Proteogenomic characterization of human colon and rectal cancer. Nature 513, 382–387. 10.1038/nature13438. - DOI - PMC - PubMed
    1. Mendelaar PAJ, Smid M, van Riet J, Angus L, Labots M, Steeghs N, Hendriks MP, Cirkel GA, van Rooijen JM, Ten Tije AJ, et al. (2021). Whole genome sequencing of metastatic colorectal cancer reveals prior treatment effects and specific metastasis features. Nat. Commun 12, 574. 10.1038/s41467-020-20887-6. - DOI - PMC - PubMed

Publication types

Substances