

IntroUNET: Identifying introgressed alleles via semantic segmentation
- PMID: 38377104
- PMCID: PMC10906877
- DOI: 10.1371/journal.pgen.1010657
IntroUNET: Identifying introgressed alleles via semantic segmentation
Abstract
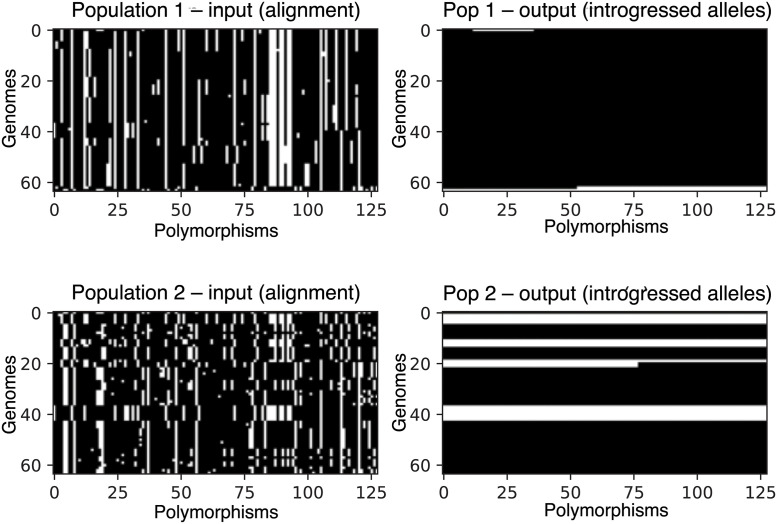
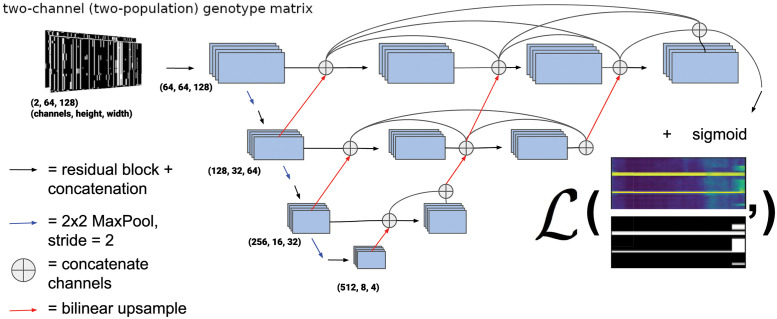
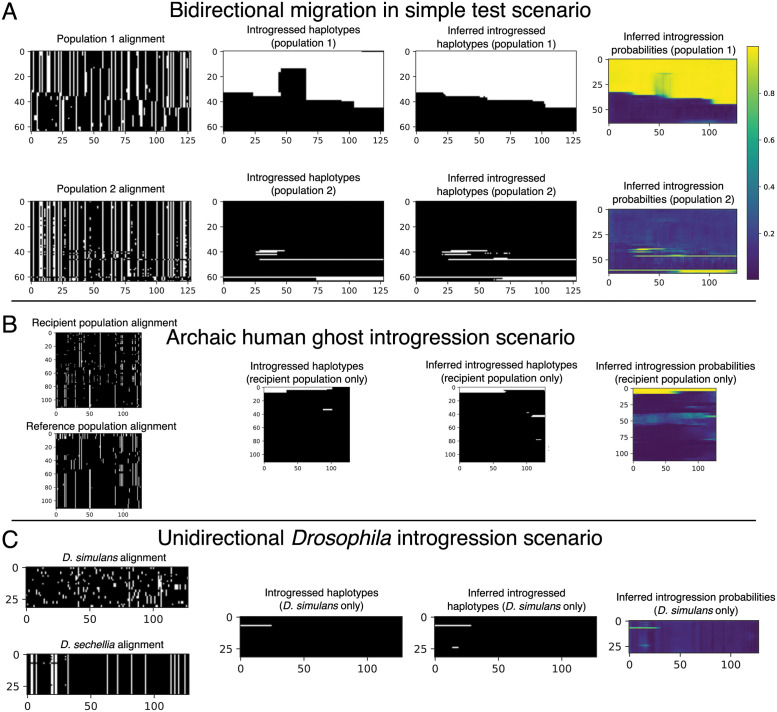
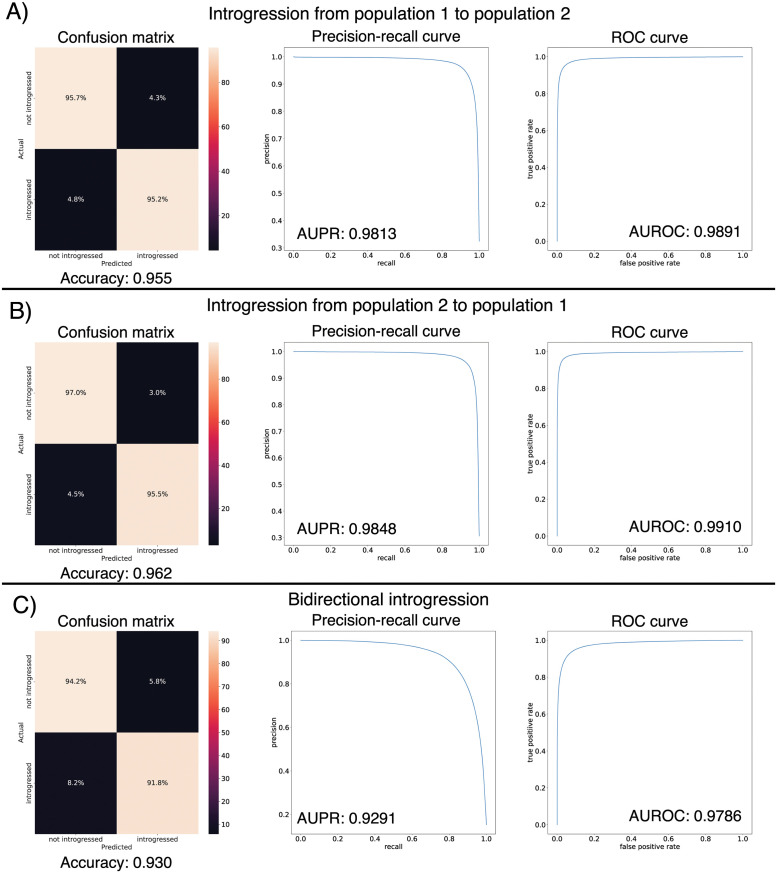
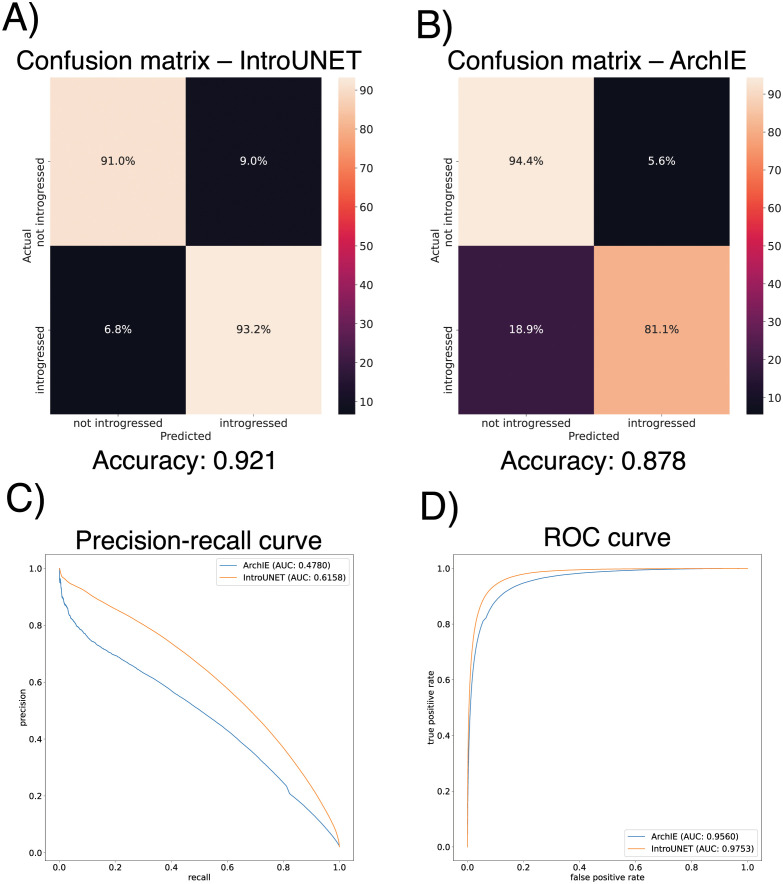
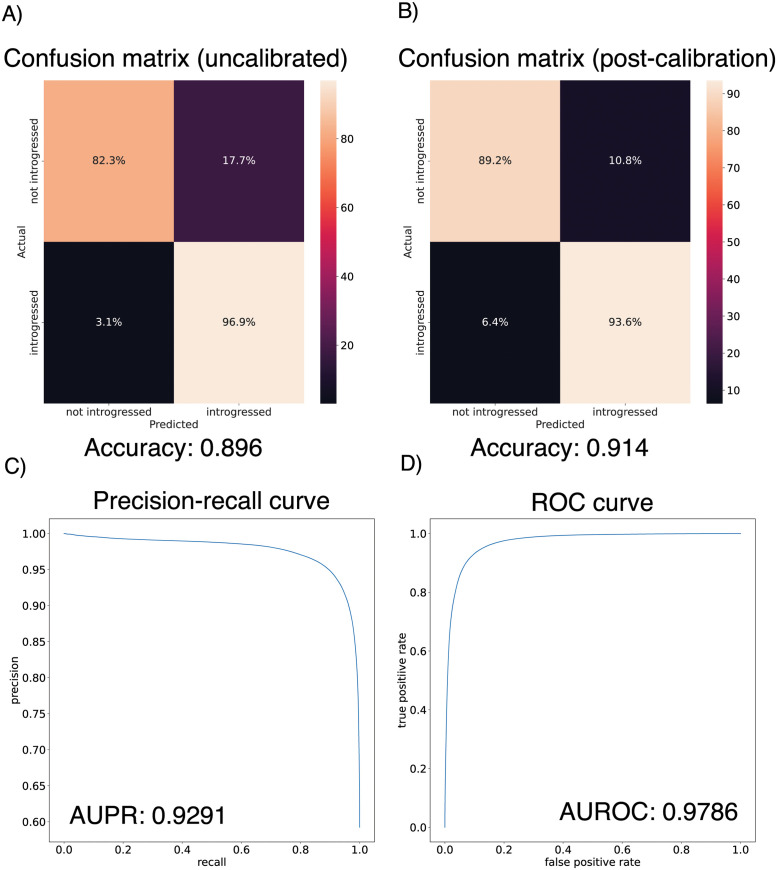
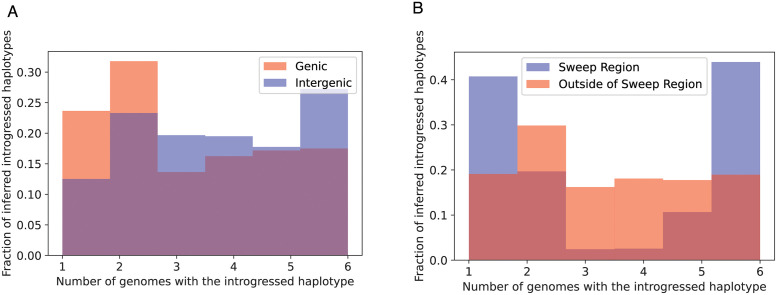
A growing body of evidence suggests that gene flow between closely related species is a widespread phenomenon. Alleles that introgress from one species into a close relative are typically neutral or deleterious, but sometimes confer a significant fitness advantage. Given the potential relevance to speciation and adaptation, numerous methods have therefore been devised to identify regions of the genome that have experienced introgression. Recently, supervised machine learning approaches have been shown to be highly effective for detecting introgression. One especially promising approach is to treat population genetic inference as an image classification problem, and feed an image representation of a population genetic alignment as input to a deep neural network that distinguishes among evolutionary models (i.e. introgression or no introgression). However, if we wish to investigate the full extent and fitness effects of introgression, merely identifying genomic regions in a population genetic alignment that harbor introgressed loci is insufficient-ideally we would be able to infer precisely which individuals have introgressed material and at which positions in the genome. Here we adapt a deep learning algorithm for semantic segmentation, the task of correctly identifying the type of object to which each individual pixel in an image belongs, to the task of identifying introgressed alleles. Our trained neural network is thus able to infer, for each individual in a two-population alignment, which of those individual's alleles were introgressed from the other population. We use simulated data to show that this approach is highly accurate, and that it can be readily extended to identify alleles that are introgressed from an unsampled "ghost" population, performing comparably to a supervised learning method tailored specifically to that task. Finally, we apply this method to data from Drosophila, showing that it is able to accurately recover introgressed haplotypes from real data. This analysis reveals that introgressed alleles are typically confined to lower frequencies within genic regions, suggestive of purifying selection, but are found at much higher frequencies in a region previously shown to be affected by adaptive introgression. Our method's success in recovering introgressed haplotypes in challenging real-world scenarios underscores the utility of deep learning approaches for making richer evolutionary inferences from genomic data.
Copyright: © 2024 Ray et al. This is an open access article distributed under the terms of the Creative Commons Attribution License, which permits unrestricted use, distribution, and reproduction in any medium, provided the original author and source are credited.
Conflict of interest statement
The authors have declared that no competing interests exist.
Figures
Update of
-
IntroUNET: identifying introgressed alleles via semantic segmentation.bioRxiv [Preprint]. 2024 Jan 23:2023.02.07.527435. doi: 10.1101/2023.02.07.527435. bioRxiv. 2024. Update in: PLoS Genet. 2024 Feb 20;20(2):e1010657. doi: 10.1371/journal.pgen.1010657. PMID: 36865105 Free PMC article. Updated. Preprint.
Similar articles
-
IntroUNET: identifying introgressed alleles via semantic segmentation.bioRxiv [Preprint]. 2024 Jan 23:2023.02.07.527435. doi: 10.1101/2023.02.07.527435. bioRxiv. 2024. Update in: PLoS Genet. 2024 Feb 20;20(2):e1010657. doi: 10.1371/journal.pgen.1010657. PMID: 36865105 Free PMC article. Updated. Preprint.
-
Supervised machine learning reveals introgressed loci in the genomes of Drosophila simulans and D. sechellia.PLoS Genet. 2018 Apr 23;14(4):e1007341. doi: 10.1371/journal.pgen.1007341. eCollection 2018 Apr. PLoS Genet. 2018. PMID: 29684059 Free PMC article.
-
Genome patterns of selection and introgression of haplotypes in natural populations of the house mouse (Mus musculus).PLoS Genet. 2012;8(8):e1002891. doi: 10.1371/journal.pgen.1002891. Epub 2012 Aug 30. PLoS Genet. 2012. PMID: 22956910 Free PMC article.
-
Prevalence and Adaptive Impact of Introgression.Annu Rev Genet. 2021 Nov 23;55:265-283. doi: 10.1146/annurev-genet-021821-020805. Epub 2021 Sep 27. Annu Rev Genet. 2021. PMID: 34579539 Review.
-
Interpreting the genomic landscape of introgression.Curr Opin Genet Dev. 2017 Dec;47:69-74. doi: 10.1016/j.gde.2017.08.007. Epub 2017 Sep 17. Curr Opin Genet Dev. 2017. PMID: 28923541 Review.
Cited by
-
Digital Image Processing to Detect Adaptive Evolution.Mol Biol Evol. 2024 Dec 6;41(12):msae242. doi: 10.1093/molbev/msae242. Mol Biol Evol. 2024. PMID: 39565932 Free PMC article.
-
Tree sequences as a general-purpose tool for population genetic inference.bioRxiv [Preprint]. 2024 Oct 5:2024.02.20.581288. doi: 10.1101/2024.02.20.581288. bioRxiv. 2024. Update in: Mol Biol Evol. 2024 Nov 1;41(11):msae223. doi: 10.1093/molbev/msae223. PMID: 39185244 Free PMC article. Updated. Preprint.
-
INTERPRETING GENERATIVE ADVERSARIAL NETWORKS TO INFER NATURAL SELECTION FROM GENETIC DATA.bioRxiv [Preprint]. 2023 Jul 9:2023.03.07.531546. doi: 10.1101/2023.03.07.531546. bioRxiv. 2023. Update in: Genetics. 2024 Apr 3;226(4):iyae024. doi: 10.1093/genetics/iyae024. PMID: 36945387 Free PMC article. Updated. Preprint.
-
Tree Sequences as a General-Purpose Tool for Population Genetic Inference.Mol Biol Evol. 2024 Nov 1;41(11):msae223. doi: 10.1093/molbev/msae223. Mol Biol Evol. 2024. PMID: 39460991 Free PMC article.
-
Estimation of spatial demographic maps from polymorphism data using a neural network.Mol Ecol Resour. 2024 Oct;24(7):e14005. doi: 10.1111/1755-0998.14005. Epub 2024 Aug 16. Mol Ecol Resour. 2024. PMID: 39152666 Free PMC article.
References
-
- Rieseberg LH, Wendel JF, et al.. Introgression and its consequences in plants. Hybrid zones and the evolutionary process. 1993;70:109.
MeSH terms
Grants and funding
LinkOut - more resources
Full Text Sources
Molecular Biology Databases
