. 2024 Feb 20;20(2):e1010706.
doi: 10.1371/journal.pcbi.1010706. eCollection 2024 Feb.

Robust and consistent measures of pattern separation based on information theory and demonstrated in the dentate gyrus

Affiliations

Robust and consistent measures of pattern separation based on information theory and demonstrated in the dentate gyrus

Alexander D Bird et al. PLoS Comput Biol. .

Abstract

Pattern separation is a valuable computational function performed by neuronal circuits, such as the dentate gyrus, where dissimilarity between inputs is increased, reducing noise and increasing the storage capacity of downstream networks. Pattern separation is studied from both in vivo experimental and computational perspectives and, a number of different measures (such as orthogonalisation, decorrelation, or spike train distance) have been applied to quantify the process of pattern separation. However, these are known to give conclusions that can differ qualitatively depending on the choice of measure and the parameters used to calculate it. We here demonstrate that arbitrarily increasing sparsity, a noticeable feature of dentate granule cell firing and one that is believed to be key to pattern separation, typically leads to improved classical measures for pattern separation even, inappropriately, up to the point where almost all information about the inputs is lost. Standard measures therefore both cannot differentiate between pattern separation and pattern destruction, and give results that may depend on arbitrary parameter choices. We propose that techniques from information theory, in particular mutual information, transfer entropy, and redundancy, should be applied to penalise the potential for lost information (often due to increased sparsity) that is neglected by existing measures. We compare five commonly-used measures of pattern separation with three novel techniques based on information theory, showing that the latter can be applied in a principled way and provide a robust and reliable measure for comparing the pattern separation performance of different neurons and networks. We demonstrate our new measures on detailed compartmental models of individual dentate granule cells and a dentate microcircuit, and show how structural changes associated with epilepsy affect pattern separation performance. We also demonstrate how our measures of pattern separation can predict pattern completion accuracy. Overall, our measures solve a widely acknowledged problem in assessing the pattern separation of neural circuits such as the dentate gyrus, as well as the cerebellum and mushroom body. Finally we provide a publicly available toolbox allowing for easy analysis of pattern separation in spike train ensembles.


Conflict of interest statement

The authors have declared that no competing interests exist.

Figures

Fig 1
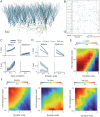
Fig 1. Sparsifying (filtering) spike train ensembles leads to increased classical measures of pattern separation, but reduced information content.
A Demonstration of filtering a phase-locked spike train ensemble (left) by random spike deletion (right). The probabilities of spike deletion are p = 0.5, 0.75, 0.85, 0.95. B Standard measures of pattern separation as a function of discretisation bin size on a randomly filtered spike train with p = 0.5. Solid, dashed, and dotted lines refer respectively to strong, medium, and weak input similarities (phase-locked strengths of 0.75, 0.5, and 0.25, see Methods). From darkest to lightest, colours plot standard measures of pattern separation: orthogonalisation Υθ, scaling Υσ, decorrelation Υρ, and Hamming distance Υη. Wasserstein distance Υδ does not rely on discretisation and is not plotted. All values are normalised for comparisons, raw values are plotted in S1(C)–S1(F) Fig. C Standard measures of pattern separation applied to filtered spike trains. Filtering methods and input similarities are as in B. The x-axis gives the filtering parameter in each case. All values are normalised for comparisons, raw values are plotted in S1(G)–S1(K) Fig. D Mutual information between input spike train ensembles and filtered spike train ensembles. Filtering methods and input similarities are as in B. Colours correspond to different neuronal codes (see Methods): from darkest to lightest instantaneous spatial, temporal, local rate, and ensemble rate. All values are normalised for comparisons, raw values are plotted in S2(A)–S2(D) Fig. E Mutual information as a function of classical pattern separation measures. Mutual information was maximised over all spiking codes and bin sizes for different input rates, correlation structures and strengths, and filter types and strengths. Clockwise from top left: orthogonalisation Υθ, decorrelation Υρ, Wasserstein distance Υδ, and Hamming distance Υη. Shaded areas show one standard deviation. Raw scatter plots and densities are shown in S2(E)–S2(H) Fig.
Fig 2
Fig 2. Information theoretic measures of pattern separation penalise pattern destruction (information loss).
A Normalised sparsity weighted mutual information ΥM applied to randomly filtered spike train ensembles. Solid, dashed, and dotted lines refer respectively to strong, medium, and weak input similarities (see Methods). Colours correspond to different neuronal codes (see Methods): from darkest to lightest instantaneous spatial, temporal, local rate, and ensemble rate. All values are normalised for comparisons, raw values are plotted in S3(A) Fig. B Normalised sparsity weighted transfer entropy ΥT applied to filtered spike train ensembles. Colours as in panel A. All values are normalised for comparisons, raw values are plotted in S3(B) Fig. C Normalised relative redundancy reduction ΥR applied to filtered spike train ensembles. Colours as in panel A. All values are normalised for comparisons, raw values are plotted in S3(C) Fig.
Fig 3
Fig 3. Information theoretic measures applied to a single cell provide consistent and robust assessment of pattern separation.
A Left panels: Example input spiking rasters. Right panel: Dentate gyrus granule cell morphology. Informative synaptic contacts are shown by yellow and background synaptic contacts by brown markers. Example output voltage traces from the granule cell soma are shown in S4(A) Fig. B. Sparsity weighted mutual information ΥM (left) and relative redundancy reduction ΥR (right) for the granule cell model as a function of various physiological parameters. Spiking codes are chosen separately for the inputs and outputs to maximise information. From top to bottom: timescale of synaptic depression, timescale of synaptic facilitation, and spatial heterogeneity in ion channel densities (see Methods). Each input is presented 8 times. Solid lines represent the mean over 10 repetitions with different inputs and the shaded areas show one standard deviation above and below the mean. In general, input and output measures were close to the mean. Blue shows a weak input similarity (phase-locked correlation strength of 0.25), and grey a strong input similarity (phase-locked correlation strength of 0.75). Spike traces are two minutes long and consist of phase-locked inputs with a phase rate of 0.6Hz and a spiking rate of 5Hz. C Components of pattern separation as a function of the timescale of synaptic depression. From top to bottom: sparsity (mXnY)/mX, mutual information IX,Y, and redundancy reduction RXRY (see Eqs 1 to 3).
Fig 4
Fig 4. Mutual information and redundancy can be estimated in situations of limited data.
A Left: Example point Kozachenko-Leonenko (KL) estimates (triangles) of mutual information (MI) for a spike train as a function of the number of segments (see Methods) and the extrapolation to infinite length (solid line and arrow). Dashed lines show the 95% confidence interval of the estimate. Right: Mean and standard deviation (shaded areas) in mutual information estimates for single-trial data as a function of spike train length. Blue shows the exact calculation using a temporal code and purple the Kozachenko-Leonenko estimate. B Left: Example point Kozachenko-Leonenko (KL) estimates (triangles) of redundancy (Red.) for a spike train as a function of the number of segments and the extrapolation to infinite length (solid lines and arrows). Dark blue shows the input ensemble (in) and light blue the output ensemble (out). Right: Mean and standard deviation (shaded areas) in redundancy reduction (RR) estimates for single-trial data as a function of spike train length. Colours as in panel A.
Fig 5
Fig 5. Information theoretic measures can predict pattern completion performance.
A Example binary patterns from the Kuzushiji-49 dataset (top to bottom) with increasing levels of pixel noise (left to right: 0, 200, 400, and 600 pixels). B Top: Completion accuracy of a Hopfield network as a function of noise strength. Middle: Correlations between different classes of pattern as a function of noise strength. Bottom: Relative redundancy reduction (ΥR) between classes of patterns as a function of noise strength. Solid line shows the mean over 1000 repetitions and the shaded area shows the standard error. C Completion accuracy of a Hopfield network against decorrelation Υρ. D Accuracy against ΥR.
Fig 6
Fig 6. Pattern separation in a network and under pathology.
A Example of dentate gyrus microcircuit. Granule cells are in shades of blue, mossy cells are in shades of brown, and the pyramidal basket cell is in red. B Example rasters of input patterns (left) and driven microcircuit activity (right). Vertical rows show spiking activity of a single cell and colours correspond to panel A. Cells are grouped into sets receiving the same inputs and sharing preferential lateral connections (see Methods). C. Sparsity weighted mutual information ΥM (top) and relative redundancy reduction ΥR (bottom) for the mature (left) and adult-born (right) granule cell populations as a function of input phase-locked correlation strength. Solid lines represent the mean over 10 repetitions and the shaded areas show one standard deviation above and below the mean. Blue shows the response to input ensembles with a spiking rate of 5Hz and grey to input ensembles at 10Hz. Spike traces are two minutes long and consist of phase-locked inputs with a phase rate of 0.6Hz. D. Sparsity weighted mutual information ΥM (top) and relative redundancy reduction ΥR (bottom) for the mature (left) and adult-born (right) granule cell populations as a function of a scaling parameter for the informative lateral perforant path synapses. Solid lines represent the mean over 10 repetitions and the shaded areas show one standard deviation above and below the mean. Blue shows a weak input similarity (phase-locked correlation strength of 0.25), and grey a strong input similarity (phase-locked correlation strength of 0.75). Spike traces are two minutes long and consist of phase-locked inputs with a phase rate of 0.6Hz and a spiking rate of 5Hz. E Simulations of epilepsy-related changes in synaptic input weights (horizontal axis) and Kir2 channel density (vertical axis). Sparsity weighted mutual information ΥM as a joint function of synaptic and Kir2 expression scaling parameters. The heatmap shows the average over ten repetitions. Spike traces are two minutes long and consist of phase-locked inputs with a strength of 0.75, a phase rate of 0.6Hz, and a spiking rate of 5Hz. The relative redundancy reduction ΥR is plotted in S5(B) Fig. F Components of pattern separation as a joint function of synaptic and Kir2 expression scaling parameters. From left to right: sparsity (mXnY)/mX, mutual information IX,Y, and redundancy reduction RXRY (see Eqs 1 to 3).
Fig 7
Fig 7. New pattern separation measures can be applied to larger network models.
A Example of inputs to the large network model. Top. Example path in space that generates grid cell-like firing. Colour gradient indicates time over 20s. Bottom: Input firing rasters of 50 neurons over the shown path for 20s. Colours match the time above. B Pattern separation as measured by Hamming distance Υη (top) and sparsity-weighted MI ΥM (bottom) as a function of the maximum firing rate of input cells. Dark lines correspond to 5, 000 inputs to 50, 000 principal cells, and light lines to 10, 000 inputs to 100, 000 principal cells. Error bars show one standard deviation over 24 repetitions. C Pattern separation as a function of the number of principal cells innervated by each of the 100 (50k network) or 200 (100k network) inhibitory basket cells. D Pattern separation as a function of the synaptic strength of the inhibitory basket neurons. A scale of 1 corresponds to 1nS. E Pattern separation as a function of the proportion of principal neurons that are adult-born. Other parameters are as described in Methods and colours and markers are as described in B.

Similar articles

Cited by

References

    1. Borzello M, Ramirez S, Treves A, Lee I, Scharfman H, Stark C, et al.. Assessments of dentate gyrus function: Discoveries and debates. Nat Rev Neurosci. 2023;24(8):502–517. doi: 10.1038/s41583-023-00710-z - DOI - PMC - PubMed
    1. O’Keefe J, Dostrovsky J. The hippocampus as a spatial map. Preliminary evidence from unit activity in the freely-moving rat. Brain Res. 1971;34(1):171–175. doi: 10.1016/0006-8993(71)90358-1 - DOI - PubMed
    1. Leutgeb S, Leutgeb JK, Barnes CA, Moser EI, McNaughton BL, Moser MB. Independent codes for spatial and episodic memory in hippocampal neuronal ensembles. Science. 2005;309(5734):619–623. doi: 10.1126/science.1114037 - DOI - PubMed
    1. Squire LR. Memory and the hippocampus: A synthesis from findings with rats, monkeys, and humans. Psych Rev. 1992;99(2). doi: 10.1037/0033-295X.99.2.195 - DOI - PubMed
    1. Hainmueller T, Bartos M. Dentate gyrus circuits for encoding, retrieval and discrimination of episodic memories. Nat Rev Neurosci. 2020;21(3):153–168. doi: 10.1038/s41583-019-0260-z - DOI - PMC - PubMed