. 2024 Jun 4;23(6):809-822.
doi: 10.1158/1535-7163.MCT-23-0550.

Mitochondrial and Cytosolic One-Carbon Metabolism Is a Targetable Metabolic Vulnerability in Cisplatin-Resistant Ovarian Cancer

Affiliations

Mitochondrial and Cytosolic One-Carbon Metabolism Is a Targetable Metabolic Vulnerability in Cisplatin-Resistant Ovarian Cancer

Adrianne Wallace-Povirk et al. Mol Cancer Ther. .

Abstract

One-carbon (C1) metabolism is compartmentalized between the cytosol and mitochondria with the mitochondrial C1 pathway as the major source of glycine and C1 units for cellular biosynthesis. Expression of mitochondrial C1 genes including SLC25A32, serine hydroxymethyl transferase (SHMT) 2, 5,10-methylene tetrahydrofolate dehydrogenase 2, and 5,10-methylene tetrahydrofolate dehydrogenase 1-like was significantly elevated in primary epithelial ovarian cancer (EOC) specimens compared with normal ovaries. 5-Substituted pyrrolo[3,2-d]pyrimidine antifolates (AGF347, AGF359, AGF362) inhibited proliferation of cisplatin-sensitive (A2780, CaOV3, IGROV1) and cisplatin-resistant (A2780-E80, SKOV3) EOC cells. In SKOV3 and A2780-E80 cells, colony formation was inhibited. AGF347 induced apoptosis in SKOV3 cells. In IGROV1 cells, AGF347 was transported by folate receptor (FR) α. AGF347 was also transported into IGROV1 and SKOV3 cells by the proton-coupled folate transporter (SLC46A1) and the reduced folate carrier (SLC19A1). AGF347 accumulated to high levels in the cytosol and mitochondria of SKOV3 cells. By targeted metabolomics with [2,3,3-2H]L-serine, AGF347, AGF359, and AGF362 inhibited SHMT2 in the mitochondria. In the cytosol, SHMT1 and de novo purine biosynthesis (i.e., glycinamide ribonucleotide formyltransferase, 5-aminoimidazole-4-carboxamide ribonucleotide formyltransferase) were targeted; AGF359 also inhibited thymidylate synthase. Antifolate treatments of SKOV3 cells depleted cellular glycine, mitochondrial NADH and glutathione, and showed synergistic in vitro inhibition toward SKOV3 and A2780-E80 cells when combined with cisplatin. In vivo studies with subcutaneous SKOV3 EOC xenografts in SCID mice confirmed significant antitumor efficacy of AGF347. Collectively, our studies demonstrate a unique metabolic vulnerability in EOC involving mitochondrial and cytosolic C1 metabolism, which offers a promising new platform for therapy.


Conflict of interest statement

The authors declare no potential conflicts of interest.

Figures
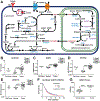
Figure 1.
Figure 1.. Folate transport and C1 metabolism and expression of SLC25A32, SHMT2, MTHFD2 and MTHFD1L in primary EOC patient samples.
Panel A shows a schematic depicting the facilitated transport of folates via RFC or PCFT, or by endocytosis through FRα. Intracellular folates are metabolized to their polyglutamate forms. Cytosolic folates (presumably as monoglutamyl forms) are transported into the mitochondria by SLC25A32. In mitochondria, serine is catabolized by SHMT2, MTHFD2/L and MTHFD1L, generating glycine, NADH, ATP and formate. Formate synthesized in the mitochondria passes to the cytosol where it is metabolized by MTHFD1 to 10-formyl THF and 5,10-methylene THF for cellular biosynthesis. Adapted from Wallace-Povirk et al. (12) Panels B-E: Transcripts for SLC25A32 (B), SHMT2 (C), MTHFD2 (D), and MTHFD1L (E) were measured using cDNAs from primary specimens including normal ovary (n=8) and HGS EOC (n=40) (OriGene) and compared to transcripts in EOC (CaOV3, IGROV1, SKOV3, A2780, A2780-E80; closed circles) and normal ovary (IOSE 7576; open circle) cell lines. Transcripts were normalized to β-actin. Statistical comparisons were performed between normal samples and tumor samples using a nonparametric Wilcoxon rank-sum test. See Supplemental Table S1 for patient characteristics and pathologies. Panel F, Kaplan-Meier plots were generated in Prism 6 (Graphpad) using gene expression data from ovarian cancer patients in TCGA, GEO, and EGA datasets (kmplot.com). Multiple genes were used to compare survival between high (828 patients) and low (828 patients) expression of the genes using a median cutoff. p-values were calculated using the log-rank (Mantel-Cox) test. Panel G, IHC staining of SHMT2 was performed for 22 HGS ovarian cancer patient specimens and 22 normal/normal adjacent tissue patient samples (US Biomax, Inc.). See Supplemental Table S3 for patient characteristics and pathologies. The TMA was incubated with a SHMT2-specific antibody or rabbit IgG; slides were developed, counter-stained and mounted. The slides were scanned using an Aperio Image Scanner (Aperio Technologies, Inc.) for microarray images. The total intensity of antibody positive staining of each tissue core was determined and normalized to cell number. IHC values are reported by the H-score for each specimen. Representative images for IgG Isotype control, normal ovary and low, intermediate and high staining of HGS tumors are shown in Supplemental Figure S1. Abbreviations include: 10-CHO-THF, 10-formyl tetrahydrofolate; 5,10-me-THF, 5,10-methylene tetrahydrofolate; AICAR, 5-aminoimidazole-4-carboxamide ribonucleotide; ALDH1L2, aldehyde dehydrogenase 1 family member L2; AICARFTase, 5-aminoimidazole-4-carboxamide ribonucleotide formyltransferase; DHF, dihydrofolate; DHFR, dihydrofolate reductase; FAICAR, formyl 5-aminoimidazole-4-carboxamide ribonucleotide; fGAR, formyl glycinamide ribonucleotide; FPGS, folylpolyglutamate synthetase; FRα, folate receptor α; GAR, glycinamide ribonucleotide; GARFTase, glycinamide ribonucleotide formyltransferase; GR, glutathione reductase; GS, glutathione synthetase; GSH, glutathione; MAT, methionine adenosyl transferase; MTFMT, methionyl tRNA formyltransferase; MTHFD1, methylene tetrahydrofolate dehydrogenase 1; MTHFD1L, methylene tetrahydrofolate dehydrogenase 1-like; MTHFD2, methylene tetrahydrofolate dehydrogenase 2; MTHFD2L, methylene tetrahydrofolate dehydrogenase 2-like; MTHFR, methylene tetrahydrofolate reductase; MTR, methionine synthase; PCFT, proton-coupled folate transporter; PGs, polyglutamates; PRPP, phosphoribosyl pyrophosphate; RFC, reduced folate carrier; SAM, S-adenosylmethionine; SHMT1/2, serine hydroxymethyltransferase 1/2; THF, tetrahydrofolate; TS, thymidylate synthase.
Figure 2.
Figure 2.. Structures of 5-substituted pyrrolo[3,2-d]pyrimidine antifolates, and colony-forming and proliferation assays with various EOC cell lines.
Panel A, structures are shown for AGF347, AGF359 and AGF362. Panel B, IC50 values for antiproliferative activities toward EOC versus normal ovary cell lines by 5-substituted pyrrolo[3,2-d]pyrimidine inhibitors are plotted. Proliferation assays were performed with immortalized human ovarian surface epithelial cells (IOSE 7576) and cisplatin sensitive (IGROV1, A2780 and CaOV3) and resistant (SKOV3 and A2780-E80) EOC cell lines. Cells were treated with inhibitors over 96 h at 37°C and assayed using the CellTiter-blue cell viability assay (Promega, Madison, WI). Results are presented as IC50 values, corresponding to the concentrations that inhibit growth by 50% relative to cells incubated without drug. The data are mean values from 3-12 experiments (± standard errors). Panels C and D, Results are shown for colony-forming assays with SKOV3 and A2780-E80 cells treated for 48 h with the pyrrolo[3,2-d]pyrimidine inhibitors (10 μM) at pH6.8 (SKOV3) or pH7.2 (A2780-E80), after which drugs were removed and plates incubated for 10 days. To maintain pH 6.8 during the drug treatment, the media was supplemented with 25 mM Pipes [1,4 piperazine bis (2-ethanosulfonic acid)]/25 mM Hepes [4-(2-hydroxyethyl)-1-piperazineethanesulfonic acid]. The colonies were stained and counted using an Oxford Optronix Gel Counter. Representative images of the stained plates are shown in the left panels and data are summarized as the numbers of colonies (mean values ± standard deviations) in the right panels. Statistical comparisons were performed against control (vehicle) samples using unpaired t-tests after log transformation. Adjustments for multiple comparisons were made using Holm’s method; *, p<0.05.
Figure 3.
Figure 3.. Role of folate transporters in uptake and binding of AGF347 in IGROV1 and SKOV3 EOC cells; cytosolic and mitochondrial accumulation of AGF347 in IGROV1 cells.
Panels A and B, NTC and FRα KD IGROV1 cells (32) were incubated with 50 nM [3H]FA or [3H]AGF347 at 0°C (15 min) or 37°C (60 min), as appropriate, to measure surface FRα-bound (“Surface”), total cell (“Total”), or internalized (“Intracellular”) 3H-ligands. Panels C and D, uptake of [3H]AGF347 (0.5 μM) by PCFT and RFC was assayed over 5 min in IGROV1 and SKOV3 cells at pH 5.5 and pH 6.8 at 37°C. AGF94 and PT523 treatments (both at 10 μM) were used as PCFT- and RFC-specific inhibitor controls, respectively. Panels E and F, accumulations of [3H]FA (2.3 μM), [3H]MTX (2 μM) and [3H] AGF347 (2 μM) in the cytosol and mitochondria of IGROV1 EOC cells are shown. Results are presented as pmol 3H substrate per mg protein as mean values ± standard deviations and represent three biological replicates. Statistical comparisons were performed against controls (NTC) using unpaired t-tests after log transformation. Adjustments for multiple comparisons were made using Holm’s method; *, p<0.05.
Figure 4.
Figure 4.. Identification of intracellular targets of pyrrolo[3,2-d]pyrimidine inhibitors by targeted metabolomics in SKOV3 EOC cells.
Panel A, schematic of C1 flux through mitochondrial and cytosol compartments using [2,3,3-2H]L-serine. The 2H atoms in [2,3,3-2H]L-serine (blue circle) in the mitochondria are metabolized via SHMT2 to MTHFD2 and MTHFD1L, generating [2H]formate. [2H]Formate in the cytosol is converted to [2H]10-formyl THF and [2H]5,10-methylene THF, resulting in [2H]dTMP and [2H]dTTP (as M+1). Reversal of SHMT1 in the cytosol results in 2H atoms in [2,3,3-2H]serine (red) being metabolized to [2H]5,10-methylene THF which is utilized by TS to synthesize [2H]dTMP and [2H]dTTP (as M+2). 2H-NADH generated from [2,3,3-2H]L-serine via SHMT2 and MTHFD2 is used by malate dehydrogenase (MDH) to transfer a 2H to oxaloacetic acid (OAA) generating [2H]malate. Panels B and C, Total serine (B) and glycine (C) and the serine-isotopomer distributions in SHMT1 KD and SHMT2 KD SKOV3 cells, along with NTC (vehicle-treated) and NTC cells treated with AGF347, AGF359 or AGF362. The increase in the M+1 and M+2 serine isotopomers in the presence of the pyrrolo[3,2-d]pyrimidine inhibitors is a direct reflection of accumulated [2,3,3-2H]L-serine accompanying the loss of SHMT2 activity, combined with low levels of C1 flux through SHMT2 and MTHFD2 in mitochondria and SHMT1 in the cytosol even in the presence of the pyrrolo[3,2-d]pyrimidine inhibitors (21). Panel D, 2H incorporation from [2,3,3-2H]L-serine into M+1 [2H]malate via [2H]NADH and oxaloacetate (catalyzed by malate dehydrogenase) was measured in NTC SKOV3 cells treated with AGF347 and AGF359, compared to results for NTC and SHMT2 KD SKOV3 cells. Malate labeling was corrected for the extent of serine labeling and is expressed as a fraction. Panel E, total dTTP pools are shown with the isotopomer distributions (M+0, M+1, M+2) for untreated and inhibitor-treated NTC SKOV3 cells compared to SHMT2 KD cells. Panels F-H, NTC SKOV3 cells were treated with AGF347, AGF359, or AGF362 (48 h). GAR (F), AICAR (G) and IMP (H) pools were measured in inhibitor-treated cells and in NTC (vehicle treated) and SHMT2 KD cells. For panels B-H, data are shown as mean values ± standard deviations for at least five technical replicates. Statistical comparisons were performed against control (NTC) samples using unpaired t-tests after log transformation. Adjustments for multiple comparisons were made using Holm’s method; *, p<0.05; **, p<0.01; ***, p<0.001.
Figure 5.
Figure 5.. Effects 5-substituted pyrrolo[3,2-d]pyrimidine antifolates on glutathione and synergistic inhibition of SKOV3 and A2780-E80 EOC cell proliferation by AGF347 and cisplatin.
Panel A, cisplatin resistant SKOV3 cells were treated with mitochondrial C1 inhibitors (10 μM) in the presence of hypoxia (0.5% oxygen). After 24 h, reduced (GSH) and reduced plus oxidized glutathione (GSH + GSSG) levels were measured using the GSH-Glo Glutathione Assay kit (Promega). Total glutathione levels were measured by reduction of GSSG with tris (2-carboxyethyl)phosphine (TCEP) prior to assay. Results are compared for NTC (vehicle-treated) and SHMT2 KD SKOV3 cells. To confirm hypoxia, vehicle-treated SKOV3 cells were assayed in parallel for expression of carbonic anhydrase IX, compared to normoxia vehicle-treated samples. The data are shown as mean values ± standard deviations for at least three technical replicates. Statistical comparisons were performed against control (NTC) samples using unpaired t-tests after log transformation. Adjustments for multiple comparisons were made using Holm’s method. *, p<0.05; **, p<0.01; ***, p<0.001. Panels B and C, SKOV3 cells were exposed to vehicle, cisplatin or AGF347 in 96 well plates (4,000 cells/well) for 96 hours for fluorescence (Cell Titer Blue) assays of cell proliferation. Synergy determinations for combinations of cisplatin and AGF347 with SKOV3 cells were performed with 7 data points for each drug (50-6,000 nM for cisplatin; 10-1,000 nM for AGF347) and their combinations at a constant ratio of 10:1 or 20:1 (cisplatin:AGF347). Panels D and E, A2780-E80 cells were treated as for panels B and C. Synergy determinations for cisplatin (1,000-20,000 nM) and AGF347 (10-1,000 nM) were performed at constant ratios of 25:1 or 50:1 (cisplatin:AGF347). For panels B-E, triplicates were performed for each condition and the experiments were repeated six times. Raw data were exported to Excel for analysis and the results were plotted using Prism 6.0 (Graphpad) to determine IC50 values. CompuSyn was used to calculate combination index (CI) values (55) and Prism 6.0 (Graphpad) was used to generate CI plots for determinations of additive (CI=1), synergistic (CI<1) or antagonistic (CI>1) drug combinations (31). For SKOV3 cells, cisplatin and AGF347 were synergistic with CI values ranging from 0.03 to 0.98 when the effect size was >0.425. The dose reduction index showed that at 50% inhibition in the drug combinations, there is a requirement of 5.3 (± 0.9)-fold less (10:1) or 3.8 (±0.4)-fold less (20:1) cisplatin plus 1.9 (± 1.0)-fold less (10:1) or 3.6 (± 2.5)-fold less (20:1) AGF347 to achieve the same 50% inhibition with the individual drugs. For A2780-E80 cells, cisplatin and AGF347 were synergistic with CI values ranging from 0.38 to 0.96 when the effect size was >0.75. The dose reduction index showed that at 50% inhibition in the drug combinations, there is a requirement of 1.3 (± 0.1)-fold less (25:1) or 1.3 (± 0.1)-fold less (50:1) cisplatin plus 1.9 (± 0.5)-fold less (25:1) or 3.6 (± 0.9)-fold less (50:1) AGF347 to achieve the same 50% inhibition as with the individual drugs.
Figure 6.
Figure 6.. In vivo efficacy with AGF347 against cisplatin resistant SKOV3 EOC xenografts.
Panel A, a schematic of the trial design is shown. Female NCr SCID mice were implanted bilaterally with SKOV3 tumors. The mice were unselectively distributed to the treatment and control arms (7 mice per group). Beginning on day three following SC implantation, the mice were dosed intravenously (IV) as follows: AGF347, Q2dx8 at 14 mg/kg/injection, total dose 112 mg/kg; and cisplatin, Q4dx4 at 3 mg/kg/injection, total dose 12 mg/kg. Panel B, results are shown for individual mice. The median growth delay for cisplatin was 2 days compared with 10 days for AGF347, the longest delay being 15 days. Panel C, the table summarizes the results of the efficacy trial. Quantitative end-points include: (i) tumor growth delay (T-C, where T is the median time in days required for the treatment group tumors to reach a predetermined size (e.g., 1000 mg), and C is the median time in days for the control group tumors to reach the same size); and (ii) gross log10 cell kill (LCK) (determined by the formula, LCK = (T-C; tumor growth delay in days)/3.32xTd (tumor doubling time in days determined by growth plot)). Further analysis includes determinations of T/C values (in percent) on all days of tumor measurement using the median total tumor burden for treatment (T) and control (C) groups. The reported % T/C value for this study corresponds to the first measurement taken post last treatment (day x) when control tumors were still in exponential growth phase (i.e., 500-1,250 mg). The median value of each group was determined including zeros. The % T/C value is the inverse of tumor growth inhibition (TGI). Mouse body weight, percent body weight loss and host recovery time (time in days for mice to regain starting weight from weight loss nadir) were used, along with daily health monitoring, to gauge drug effects and potential toxicity.

References

    1. Dekhne AS, Hou Z, Gangjee A, Matherly LH. Therapeutic Targeting of Mitochondrial One-Carbon Metabolism in Cancer. Molecular cancer therapeutics 2020;19(11):2245–55 doi 10.1158/1535-7163.MCT-20-0423. - DOI - PMC - PubMed
    1. Ducker GS, Rabinowitz JD. One-Carbon Metabolism in Health and Disease. Cell Metab 2017;25(1):27–42 doi 10.1016/j.cmet.2016.08.009. - DOI - PMC - PubMed
    1. Stover PJ. Physiology of folate and vitamin B12 in health and disease. Nutrition reviews 2004;62(6 Pt 2):S3–12; discussion S3. - PubMed
    1. Desmoulin SK, Hou Z, Gangjee A, Matherly LH. The human proton-coupled folate transporter: Biology and therapeutic applications to cancer. Cancer Biol Ther 2012;13(14):1355–73 doi 10.4161/cbt.22020. - DOI - PMC - PubMed
    1. Elnakat H, Ratnam M. Distribution, functionality and gene regulation of folate receptor isoforms: implications in targeted therapy. Advanced drug delivery reviews 2004;56(8):1067–84 doi 10.1016/j.addr.2004.01.001. - DOI - PubMed

MeSH terms