

The zonula adherens matura redefines the apical junction of intestinal epithelia
- PMID: 38377188
- PMCID: PMC10907237
- DOI: 10.1073/pnas.2316722121
The zonula adherens matura redefines the apical junction of intestinal epithelia
Abstract
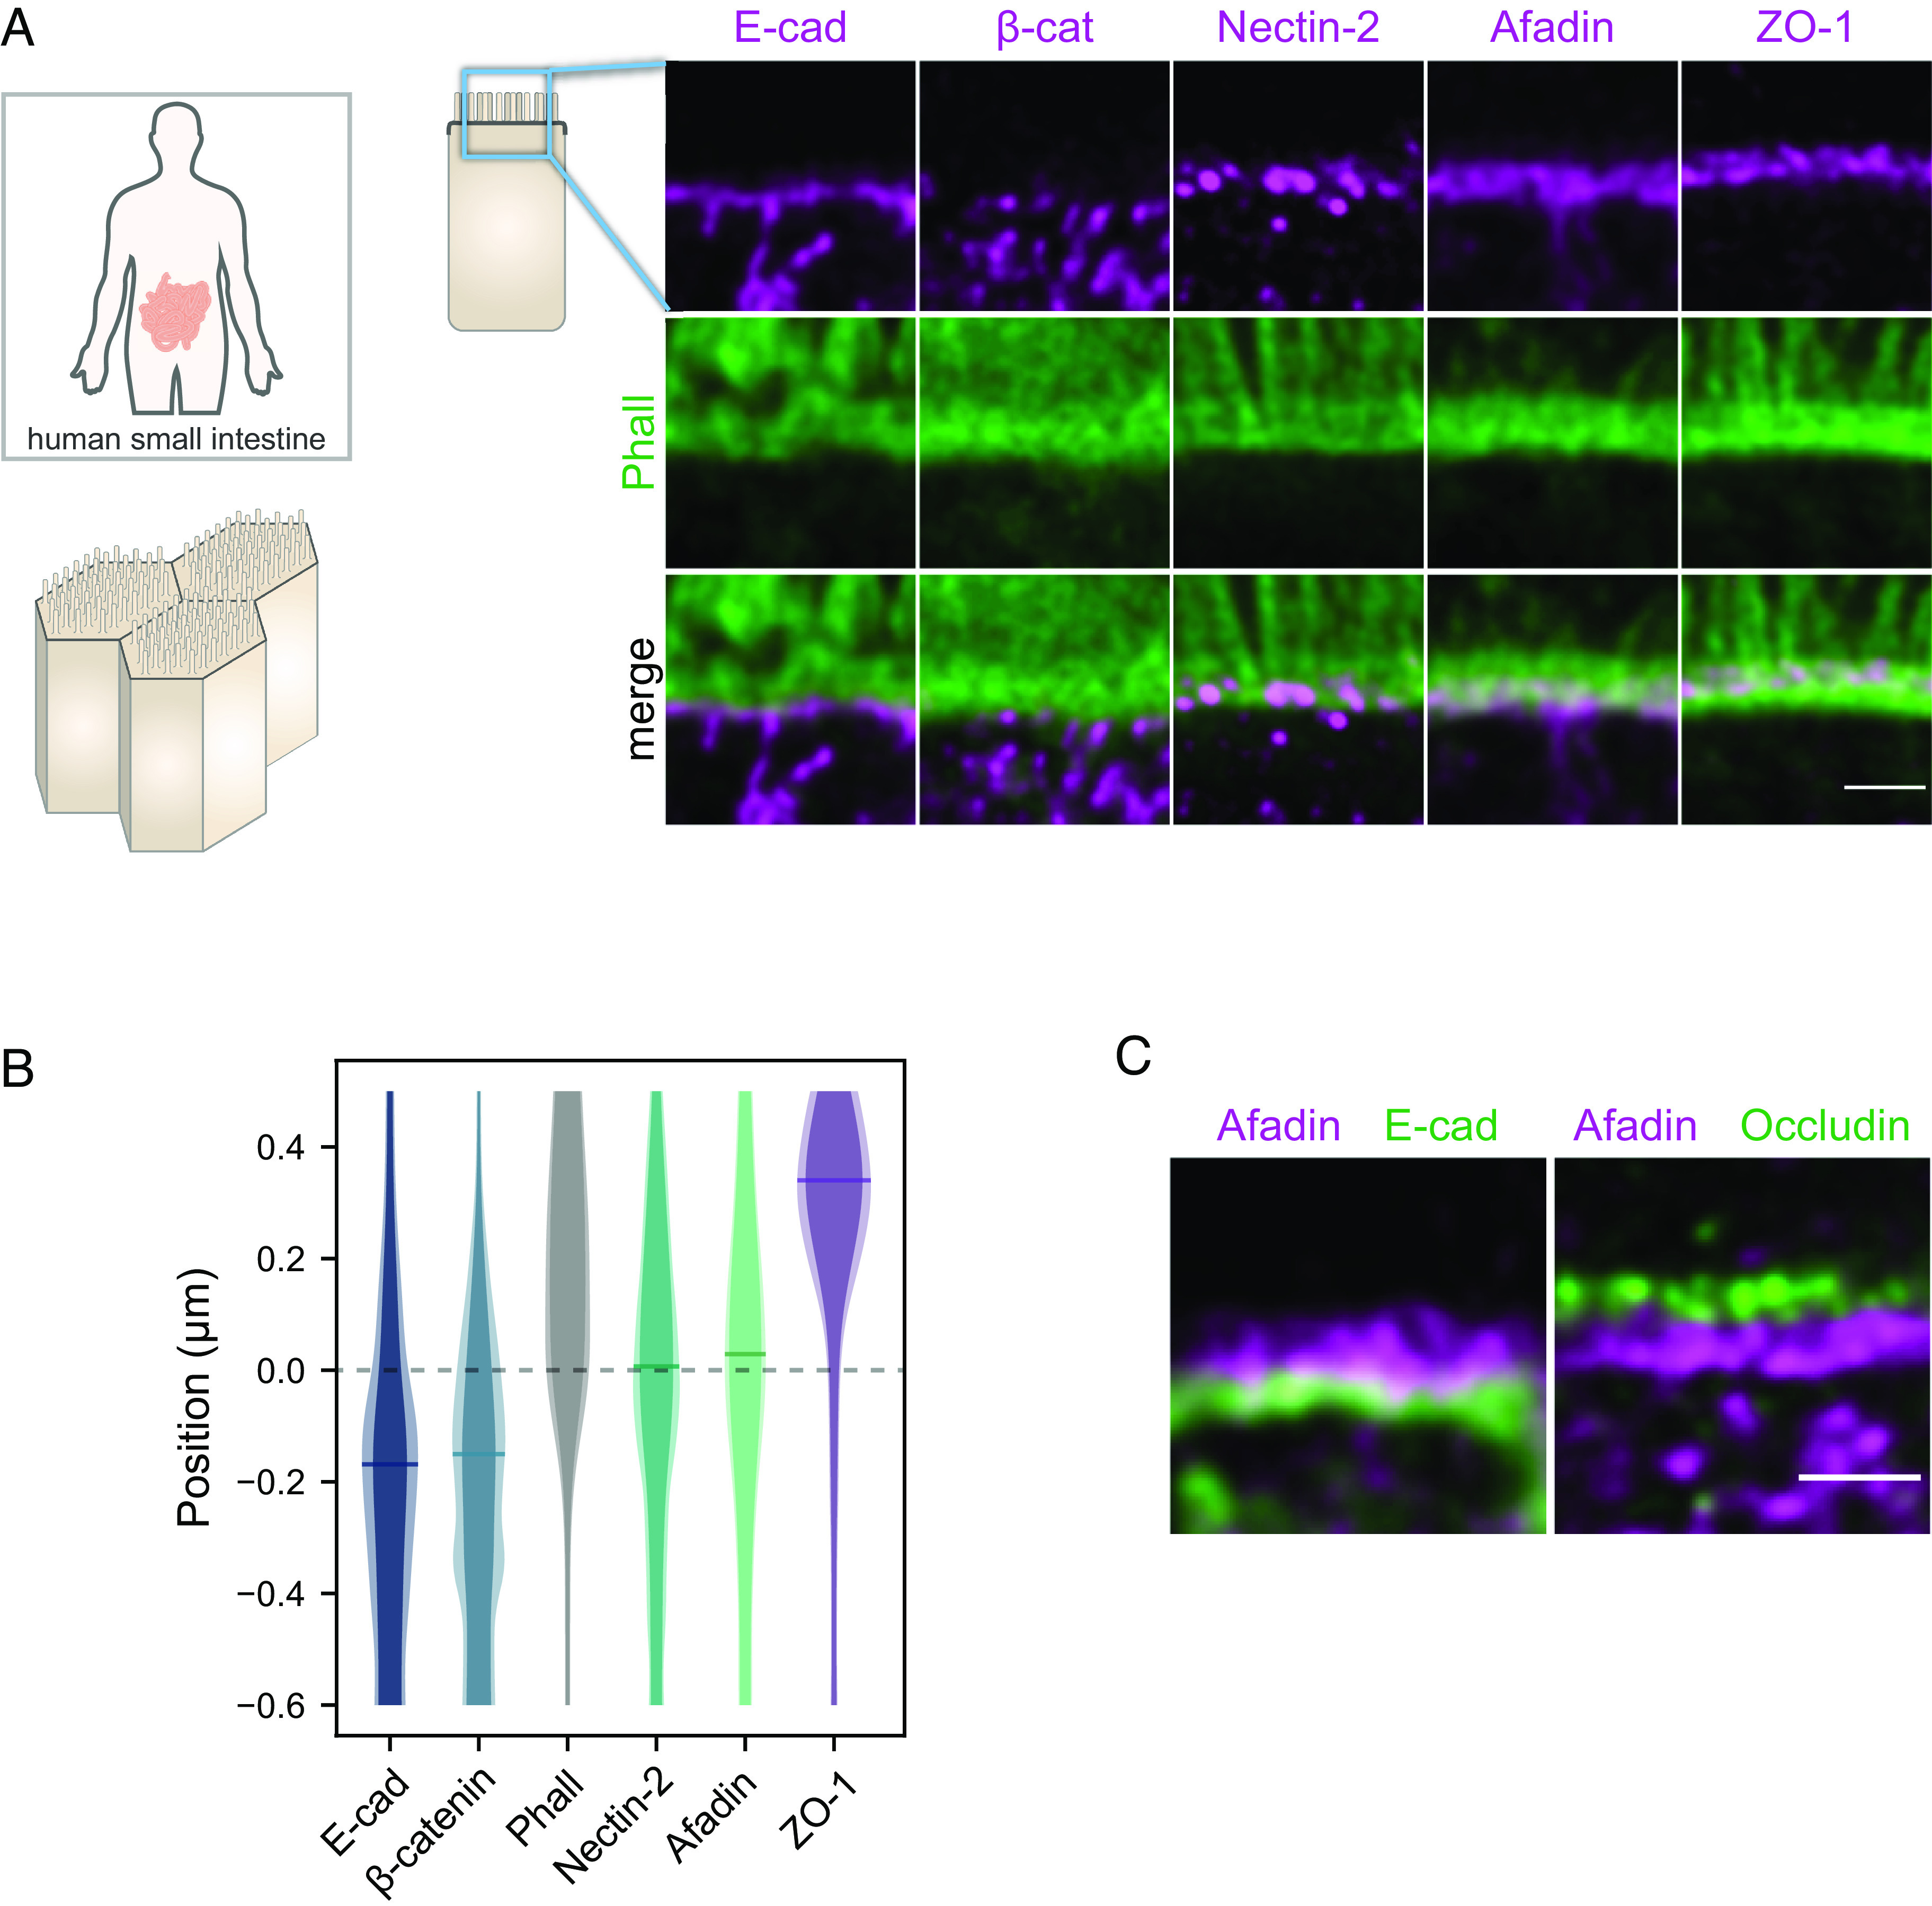
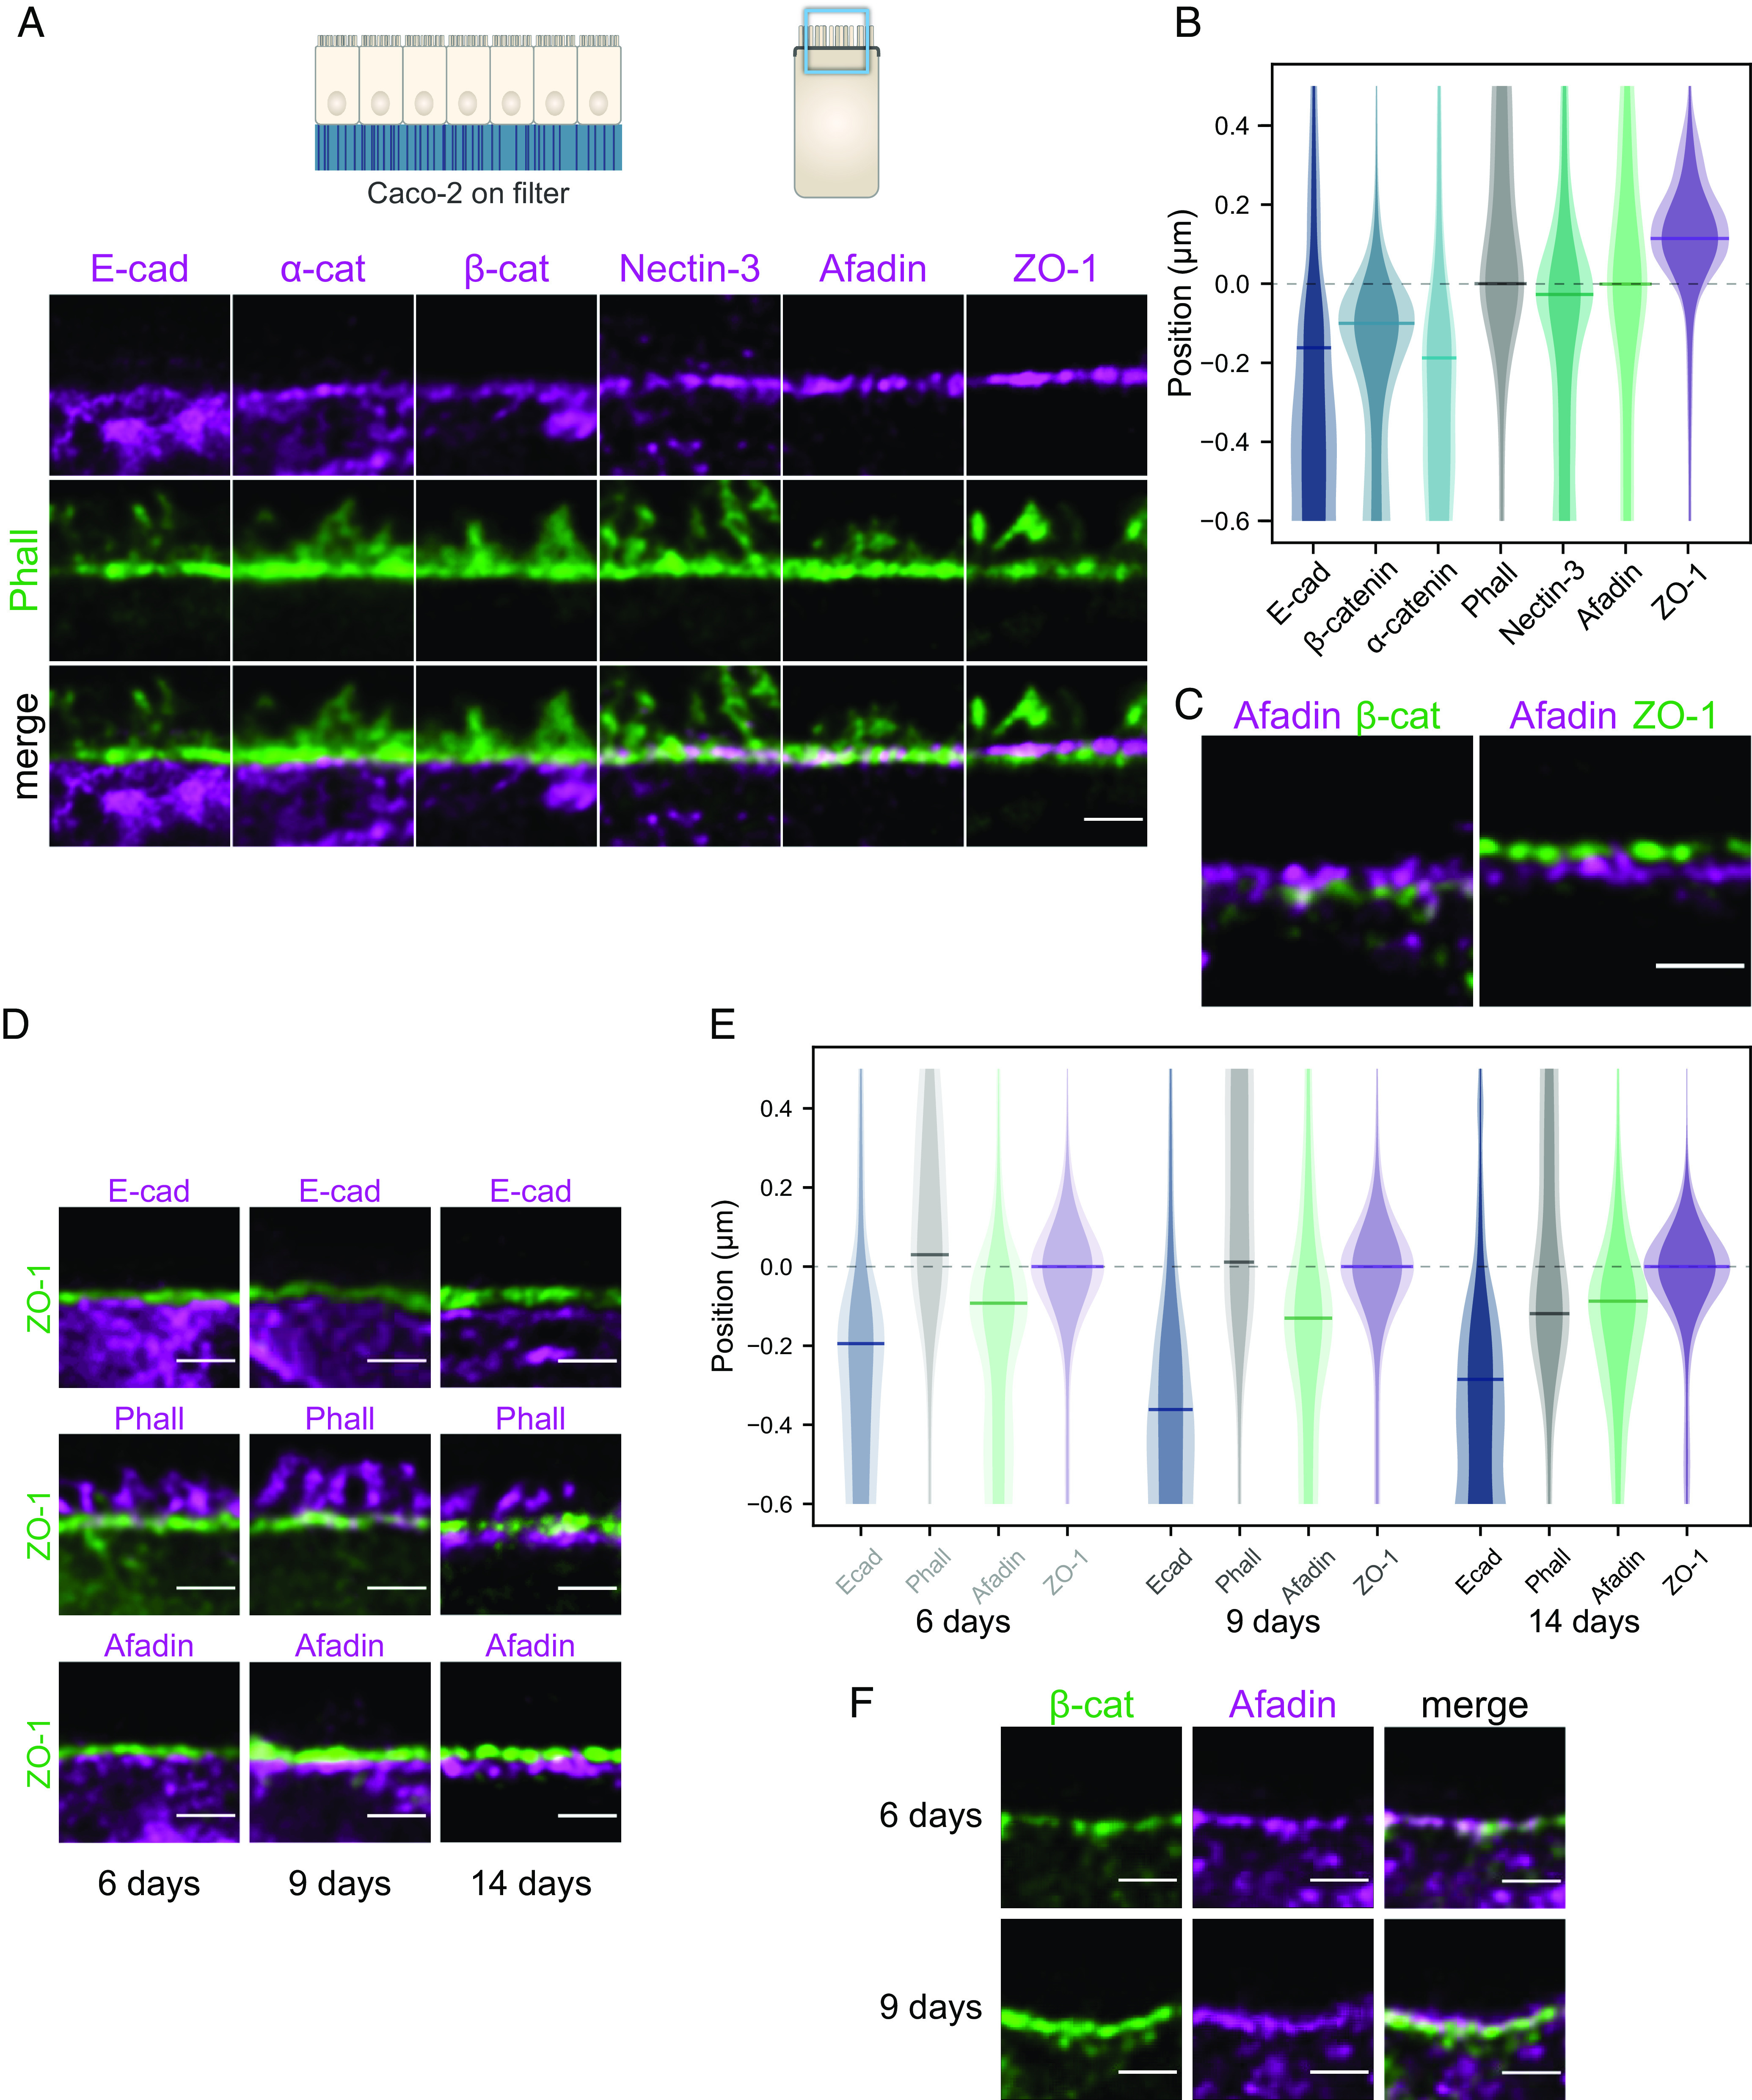
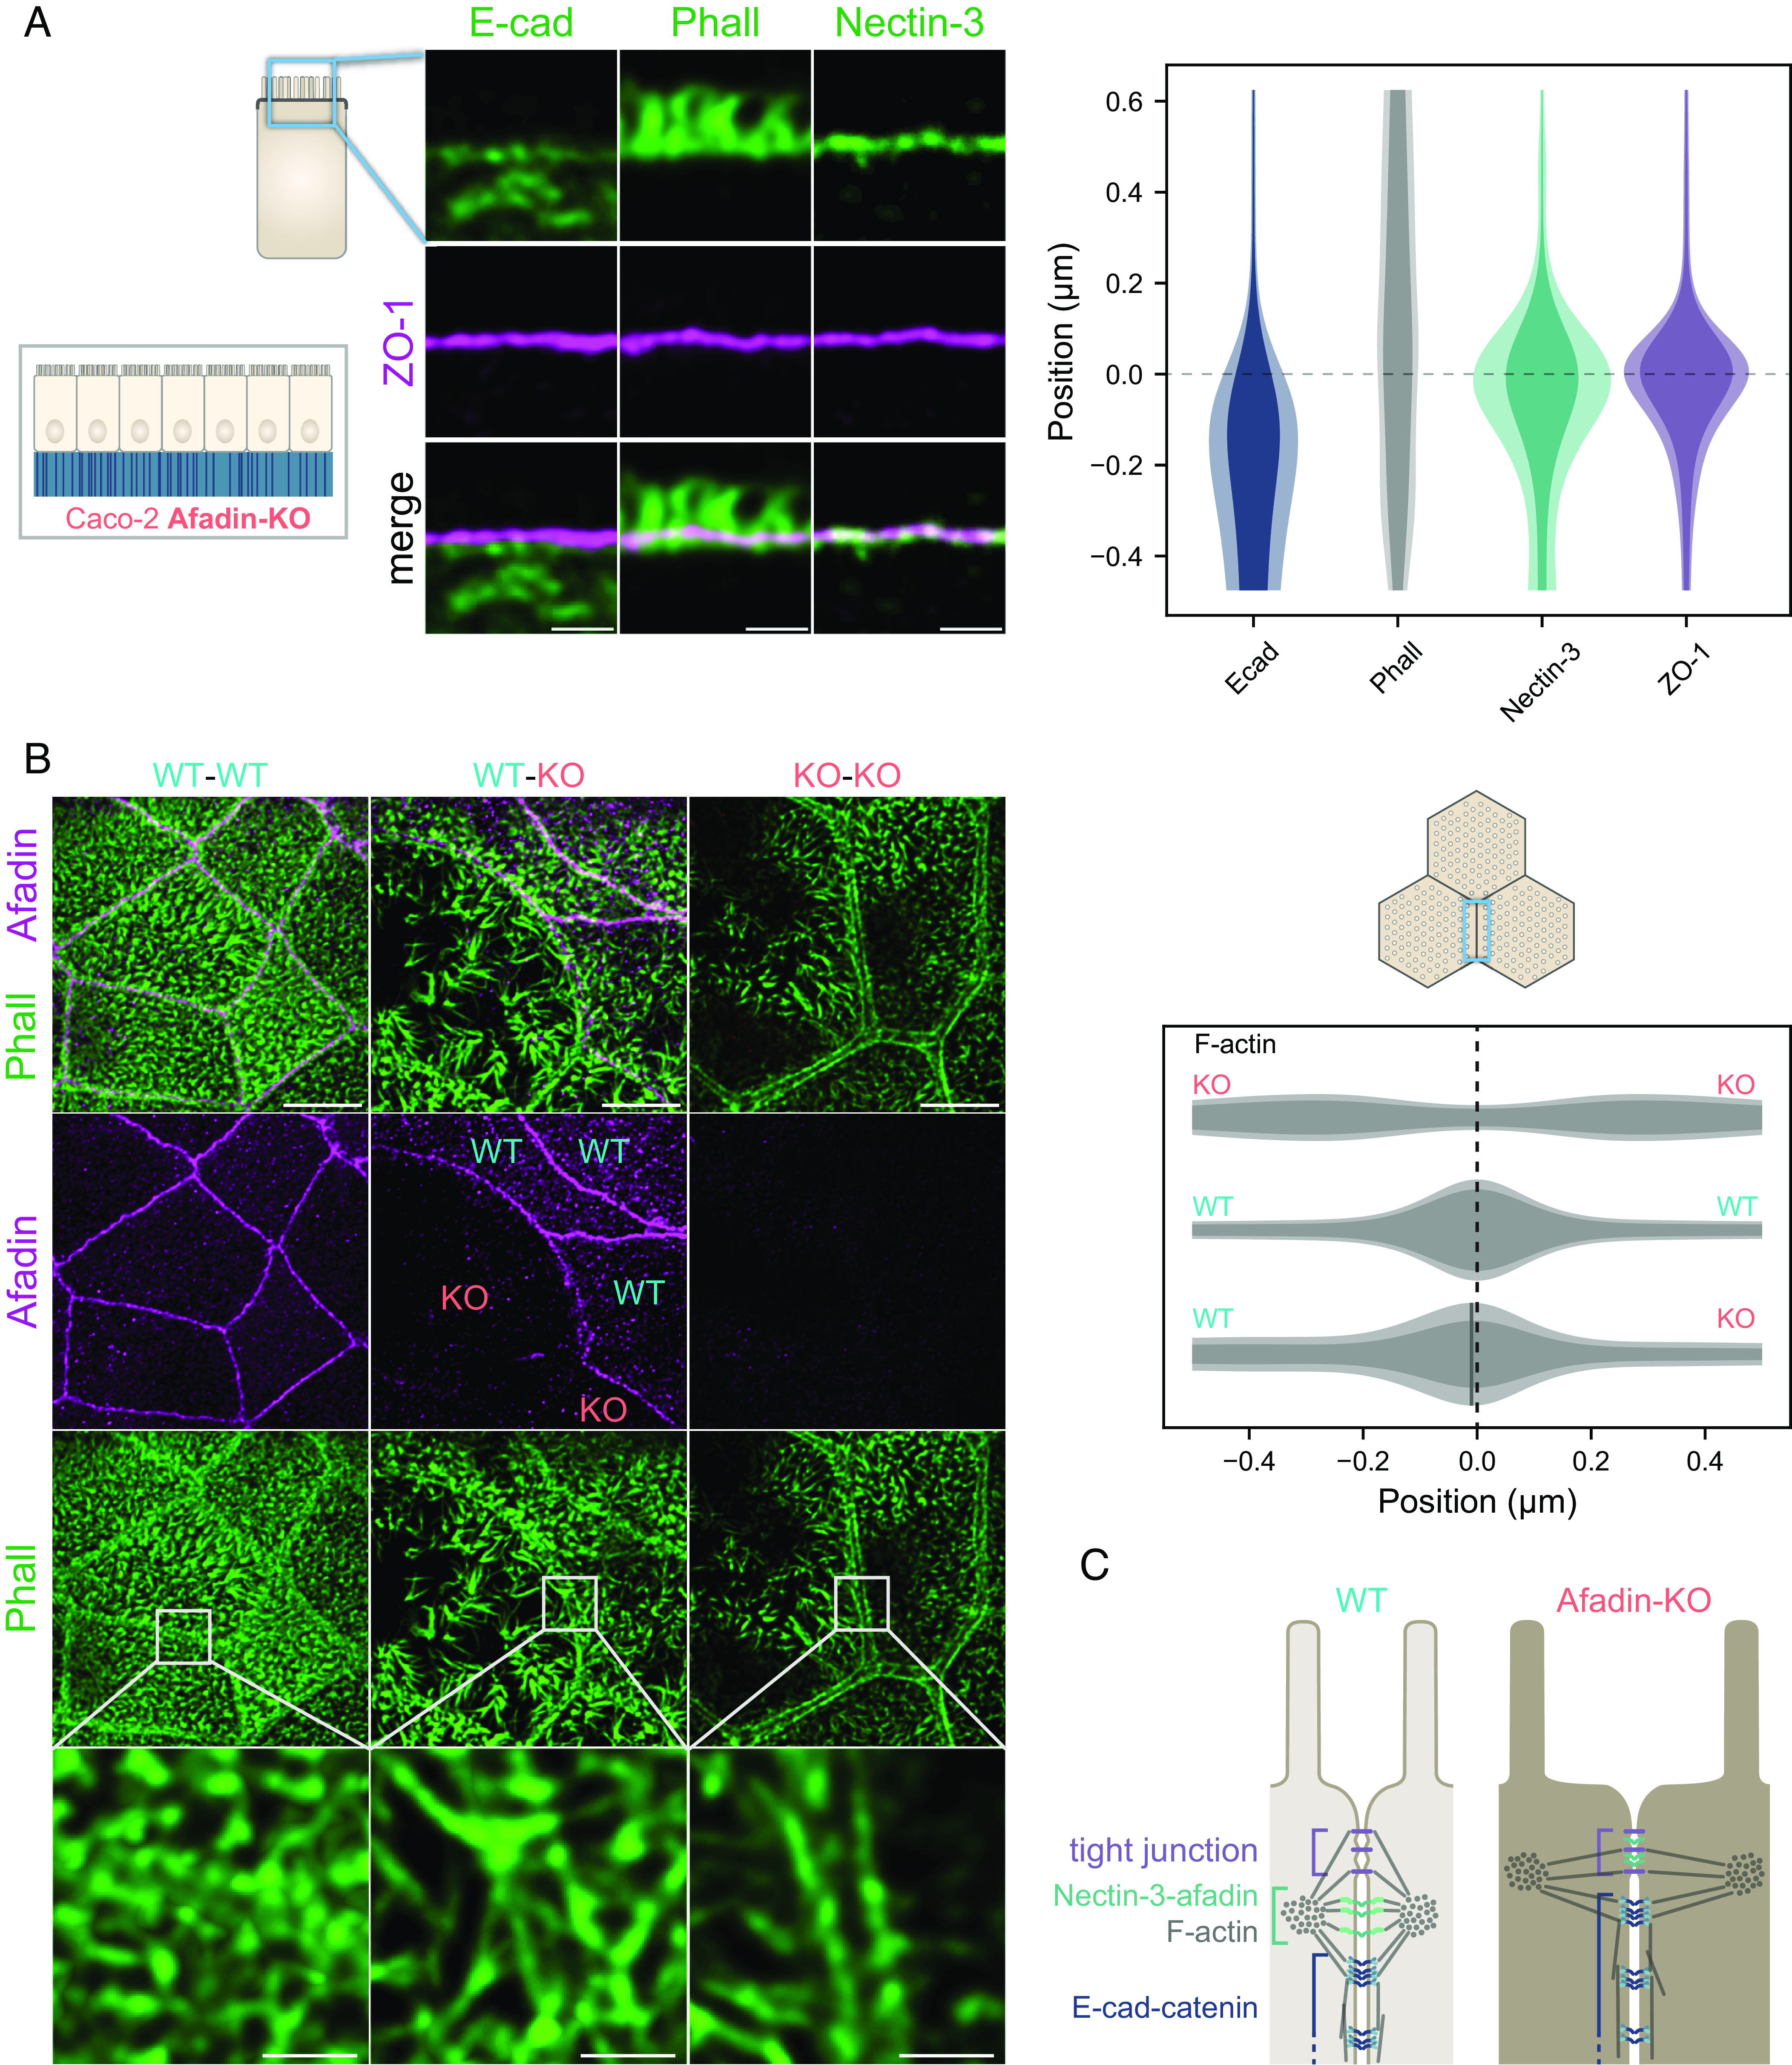
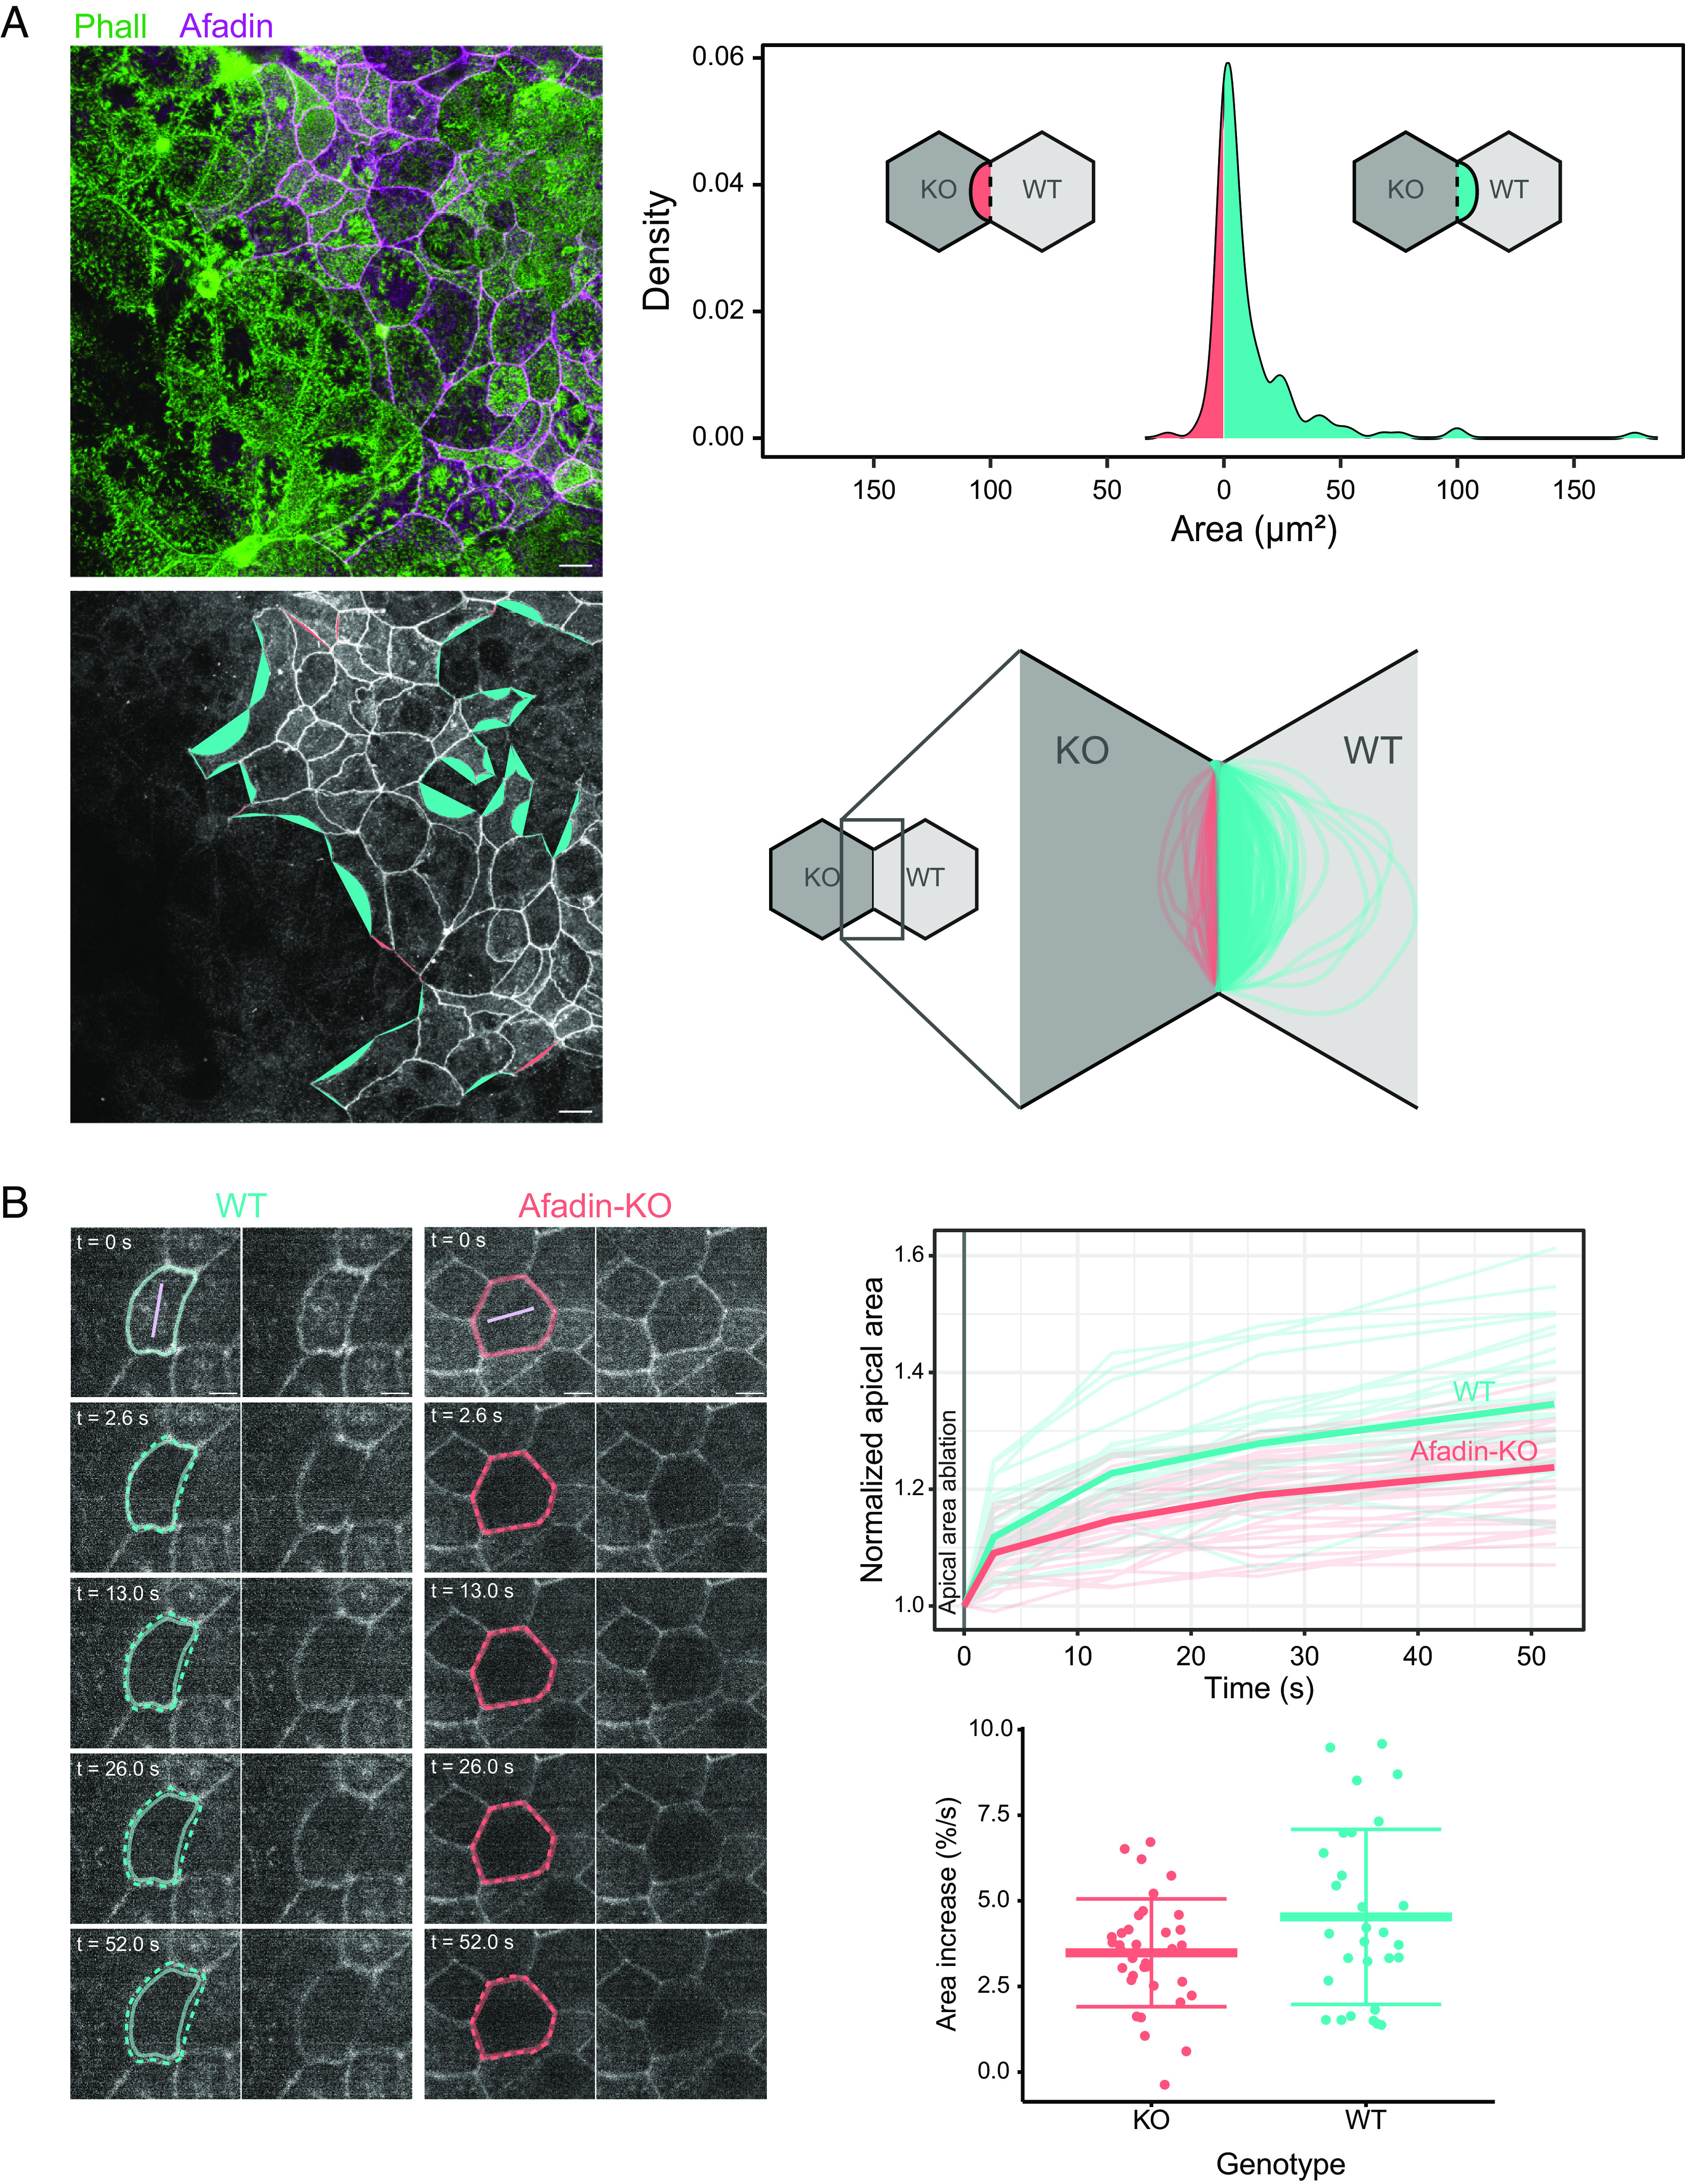
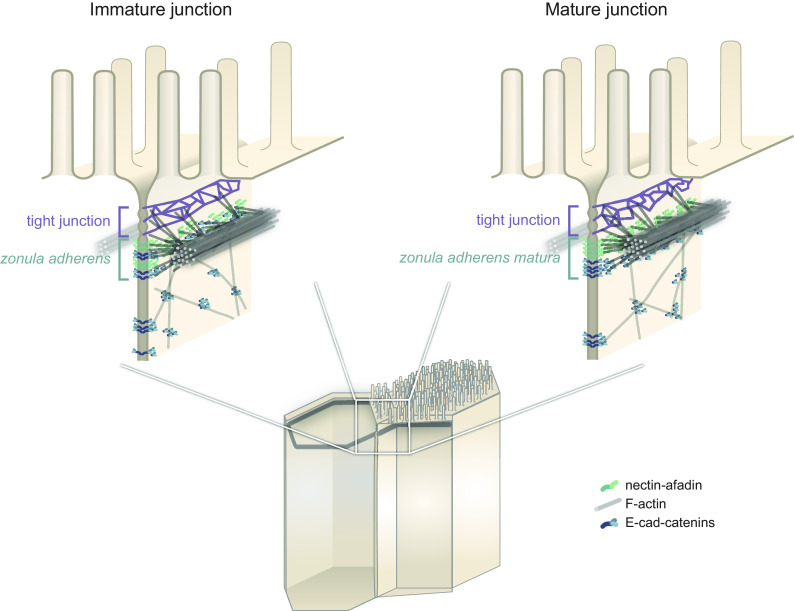
Cell-cell apical junctions of epithelia consist of multiprotein complexes that organize as belts regulating cell-cell adhesion, permeability, and mechanical tension: the tight junction (zonula occludens), the zonula adherens (ZA), and the macula adherens. The prevailing dogma is that at the ZA, E-cadherin and catenins are lined with F-actin bundles that support and transmit mechanical tension between cells. Using super-resolution microscopy on human intestinal biopsies and Caco-2 cells, we show that two distinct multiprotein belts are basal of the tight junctions as the intestinal epithelia mature. The most apical is populated with nectins/afadin and lined with F-actin; the second is populated with E-cad/catenins. We name this dual-belt architecture the zonula adherens matura. We find that the apical contraction apparatus and the dual-belt organization rely on afadin expression. Our study provides a revised description of epithelial cell-cell junctions and identifies a module regulating the mechanics of epithelia.
Keywords: actin cytoskeleton; adhesive complexes; epithelial cells; small intestine; zonula adherens.
Conflict of interest statement
Competing interests statement:The authors declare no competing interest.
Figures
Comment in
-
Too old for hide-and-seek; cell maturation reveals hidden apical junctional organization.Proc Natl Acad Sci U S A. 2024 Mar 19;121(12):e2401735121. doi: 10.1073/pnas.2401735121. Epub 2024 Mar 11. Proc Natl Acad Sci U S A. 2024. PMID: 38466856 Free PMC article. No abstract available.
Similar articles
-
Rho kinase regulates tight junction function and is necessary for tight junction assembly in polarized intestinal epithelia.Gastroenterology. 2001 Sep;121(3):566-79. doi: 10.1053/gast.2001.27060. Gastroenterology. 2001. PMID: 11522741
-
Constitutive activation of Rho proteins by CNF-1 influences tight junction structure and epithelial barrier function.J Cell Sci. 2003 Feb 15;116(Pt 4):725-42. doi: 10.1242/jcs.00300. J Cell Sci. 2003. PMID: 12538773
-
Binding between the junctional proteins afadin and PLEKHA7 and implication in the formation of adherens junction in epithelial cells.J Biol Chem. 2013 Oct 11;288(41):29356-68. doi: 10.1074/jbc.M113.453464. Epub 2013 Aug 29. J Biol Chem. 2013. PMID: 23990464 Free PMC article.
-
Interplay between tight junctions & adherens junctions.Exp Cell Res. 2017 Sep 1;358(1):39-44. doi: 10.1016/j.yexcr.2017.03.061. Epub 2017 Mar 31. Exp Cell Res. 2017. PMID: 28372972 Free PMC article. Review.
-
Integration of Cadherin Adhesion and Cytoskeleton at Adherens Junctions.Cold Spring Harb Perspect Biol. 2017 May 1;9(5):a028738. doi: 10.1101/cshperspect.a028738. Cold Spring Harb Perspect Biol. 2017. PMID: 28096263 Free PMC article. Review.
Cited by
-
Epithelial-specific loss of Smad4 alleviates the fibrotic response in an acute colitis mouse model.Life Sci Alliance. 2024 Oct 4;7(12):e202402935. doi: 10.26508/lsa.202402935. Print 2024 Dec. Life Sci Alliance. 2024. PMID: 39366762 Free PMC article.
-
Proximity proteomics provides a new resource for exploring the function of Afadin and the complexity of cell-cell adherens junctions.bioRxiv [Preprint]. 2024 Nov 8:2024.11.07.622507. doi: 10.1101/2024.11.07.622507. bioRxiv. 2024. Update in: Biol Open. 2025 Feb 15;14(2):bio061811. doi: 10.1242/bio.061811. PMID: 39574742 Free PMC article. Updated. Preprint.
-
Proximity proteomics provides a new resource for exploring the function of Afadin and the complexity of cell-cell adherens junctions.Biol Open. 2025 Feb 15;14(2):bio061811. doi: 10.1242/bio.061811. Epub 2025 Jan 30. Biol Open. 2025. PMID: 39882731 Free PMC article.
-
-catenin phosphorylation is elevated during mitosis to resist apical rounding and epithelial barrier leak.bioRxiv [Preprint]. 2024 Sep 6:2024.09.06.611639. doi: 10.1101/2024.09.06.611639. bioRxiv. 2024. Update in: Biol Open. 2025 Jan 15;14(1):bio061726. doi: 10.1242/bio.061726. PMID: 39282345 Free PMC article. Updated. Preprint.
-
A short guide to the tight junction.J Cell Sci. 2024 May 1;137(9):jcs261776. doi: 10.1242/jcs.261776. Epub 2024 May 7. J Cell Sci. 2024. PMID: 38712627 Free PMC article. Review.
References
-
- Hyafil F., Morello D., Babinet C., Jacob F., A cell surface glycoprotein involved in the compaction of embryonal carcinoma cells and cleavage stage embryos. Cell 21, 927–934 (1980). - PubMed
-
- Yoshida C., Takeichi M., Teratocarcinoma cell adhesion: Identification of a cell-surface protein involved in calcium-dependent cell aggregation. Cell 28, 217–224 (1982). - PubMed
MeSH terms
Substances
Grants and funding
LinkOut - more resources
Full Text Sources
Miscellaneous
