. 2024 Mar 5;96(9):3886-3897.
doi: 10.1021/acs.analchem.3c05539. Epub 2024 Feb 20.

Comprehensive Impurity Profiling of mRNA: Evaluating Current Technologies and Advanced Analytical Techniques

Affiliations

Comprehensive Impurity Profiling of mRNA: Evaluating Current Technologies and Advanced Analytical Techniques

Julien Camperi et al. Anal Chem. .

Abstract

In vitro transcription (IVT) of mRNA is a versatile platform for a broad range of biotechnological applications. Its rapid, scalable, and cost-effective production makes it a compelling choice for the development of mRNA-based cancer therapies and vaccines against infectious diseases. The impurities generated during mRNA production can potentially impact the safety and efficacy of mRNA therapeutics, but their structural complexity has not been investigated in detail yet. This study pioneers a comprehensive profiling of IVT mRNA impurities, integrating current technologies with innovative analytical tools. We have developed highly reproducible, efficient, and stability-indicating ion-pair reversed-phase liquid chromatography and capillary gel electrophoresis methods to determine the purity of mRNA from different suppliers. Furthermore, we introduced the applicability of microcapillary electrophoresis for high-throughput (<1.5 min analysis time per sample) mRNA impurity profiling. Our findings revealed that impurities are mainly attributed to mRNA variants with different poly(A) tail lengths due to aborted additions or partial hydrolysis and the presence of double-stranded mRNA (dsRNA) byproducts, particularly the dsRNA 3'-loop back form. We also implemented mass photometry and native mass spectrometry for the characterization of mRNA and its related product impurities. Mass photometry enabled the determination of the number of nucleotides of different mRNAs with high accuracy as well as the detection of their size variants [i.e., aggregates and partial and/or total absence of the poly(A) tail], thus providing valuable information on mRNA identity and integrity. In addition, native mass spectrometry provided insights into mRNA intact mass, heterogeneity, and important sequence features such as poly(A) tail length and distribution. This study highlights the existing bottlenecks and opportunities for improvement in the analytical characterization of IVT mRNA, thus contributing to the refinement and streamlining of mRNA production, paving the way for continued advancements in biotechnological applications.


Conflict of interest statement

The authors declare no competing financial interest.

Figures

Figure 1
Figure 1
Analysis of three eGFP mRNAs obtained from different suppliers (A, B, and C) by IP-RPLC–UV (a) and CGE–LIF (b) methods for purity assessment. Prepeak, main peak, and postpeak regions are highlighted by blue, black, and red boxes, respectively. The difference in retention and migration time of the main peak between batches of eGFP mRNA is due to the different compositions and lengths of the 5′- and 3′- UTR sequences between suppliers.
Figure 2
Figure 2
Comparison of purity profiles between two short mRNAs that differ only in the absence or presence of a 100 nt poly(A) tail (mRNA+ and mRNA−). (a) IP-RPLC and (b) CGE profiles were obtained for mRNA– (bottom traces) and mRNA+ (top traces). Separation profiles were obtained for samples exposed to an elevated temperature of 37 °C for 5 days (striped traces) versus control (solid traces).
Figure 3
Figure 3
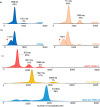
Comparative analysis of mRNA purity using (a) CGE, (c) mCE, and (e) SEC. Three different mRNAs (eGFP, Fluc, and beta gal mRNA) from vendors A and B were analyzed under denaturing (70 °C for 10 min, solid lines) and native (dashed lines) conditions. (b) For comparability of CGE and mCE under denaturing conditions, percentages of prepeak (white bars), main peak (black bars), and postpeak (gray bars) were reported. (d,f) For mCE and SEC comparability, pre- and main peaks were integrated together and compared to the postpeak region corresponding to aggregates. Compared with mCE, SEC profiles are inverted, with aggregates appearing on the left and monomers/short impurities on the right. For each mRNA, the percentages of prepeak/main peak (black striped or solid bars for native and denaturing conditions, respectively) and postpeak (gray striped or solid bars for native and denaturing conditions, respectively) were calculated. Each sample was injected three times and bars represent the mean ± SD.
Figure 4
Figure 4
Impact of T7 polymerase on the dsRNA 3′-loop back byproducts’ formation during IVT reaction. mCE (a) and IP-RPLC (b) methods were used independently to assess the dsRNA levels of in-house eGFP mRNA constructs synthesized using three different T7 polymerases (T7-WT in orange, T7-1 in red, and T7-2 in blue) under denaturing conditions. (c) For each condition, the percentage of prepeak (white), main peak (black), and postpeak (corresponding to dsRNA in gray) was reported (refer to Figure 3 for the definition of pre- and postpeak regions). The gray striped line represents the trend of dsRNA levels under the different conditions. Each sample was injected three times and bars represent the mean ± SD. (d) Dot blot for different conditions (see Experimental Section S3); mRNAs were stained using an anti-dsRNA mIgG2a monoclonal antibody. Each sample was stained three times individually, as represented by the three dots.
Figure 5
Figure 5
MP measurement of different mRNAs. Profiles were obtained for mRNA– and mRNA+, including (a) control and (b) stress (37 °C, 5 days) samples. (c) Overlay of MP measurements of different mRNAs (eGFP A, Fluc A, and beta gal B) from vendors A and B. The number of nucleotides and relative percentages of size variants of each mRNA are indicated. Arrows indicate the increases in the prepeak region for stressed samples.
Figure 6
Figure 6
Characterization of mRNA variants by native MS. (a) Poly(A) tail analysis upon T1 cleavage of intact mRNA. T1 cleavage sites of the applied poly(A) sequence are displayed as well as the deconvoluted mass spectrum. The increment of an adenosine residue (+329 Da) is represented by different colored dots. (b) Superposition of the deconvoluted spectra of mRNA+ and mRNA–, showing a mass difference of 33,580 Da corresponding to >102 adenosine residues. (c) Deconvoluted spectra obtained for prepeak (left) and main peak (right) fractions after fractionation from IP-RPLC separation of an in-house mRNA construct (∼580 nts). All MS raw spectra are displayed in Figure S7. Three different mRNAs (mRNA–, mRNA+, and 580 nt mRNA) were analyzed.

Similar articles

Cited by

References

    1. Pardi N.; Hogan M. J.; Porter F. W.; Weissman D. mRNA Vaccines—a New Era in Vaccinology. Nat. Rev. Drug Discovery 2018, 17 (4), 261–279. 10.1038/nrd.2017.243. - DOI - PMC - PubMed
    1. Rhoads R. E.Synthetic mRNA: Production, Introduction into Cells, and Physiological Consequences. In Synthetic mRNA; Rhoads R. E., Ed.; Methods in Molecular Biology; Springer New York: New York, NY, 2016; Vol. 1428, pp 3–27. - PubMed
    1. Miao L.; Zhang Y.; Huang L. mRNA Vaccine for Cancer Immunotherapy. Mol. Cancer 2021, 20 (1), 41.10.1186/s12943-021-01335-5. - DOI - PMC - PubMed
    1. Beck J. D.; Reidenbach D.; Salomon N.; Sahin U.; Türeci Ö.; Vormehr M.; Kranz L. M. mRNA Therapeutics in Cancer Immunotherapy. Mol. Cancer 2021, 20 (1), 69.10.1186/s12943-021-01348-0. - DOI - PMC - PubMed
    1. Sahin U.; Karikó K.; Türeci Ö. mRNA-Based Therapeutics—Developing a New Class of Drugs. Nat. Rev. Drug Discovery 2014, 13 (10), 759–780. 10.1038/nrd4278. - DOI - PubMed