. 2024 Apr;18(2):41-54.
doi: 10.1049/syb2.12088. Epub 2024 Feb 20.

Anoikis-related genes as potential prognostic biomarkers in gastric cancer: A multilevel integrative analysis and predictive therapeutic value

Affiliations

Anoikis-related genes as potential prognostic biomarkers in gastric cancer: A multilevel integrative analysis and predictive therapeutic value

Yongjian Lin et al. IET Syst Biol. 2024 Apr.

Abstract

Background: Gastric cancer (GC) is a frequent malignancy of the gastrointestinal tract. Exploring the potential anoikis mechanisms and pathways might facilitate GC research.

Purpose: The authors aim to determine the significance of anoikis-related genes (ARGs) in GC prognosis and explore the regulatory mechanisms in epigenetics.

Methods: After describing the genetic and transcriptional alterations of ARGs, we searched differentially expressed genes (DEGs) from the cancer genome atlas and gene expression omnibus databases to identify major cancer marker pathways. The non-negative matrix factorisation algorithm, Lasso, and Cox regression analysis were used to construct a risk model, and we validated and assessed the nomogram. Based on multiple levels and online platforms, this research evaluated the regulatory relationship of ARGs with GC.

Results: Overexpression of ARGs is associated with poor prognosis, which modulates immune signalling and promotes anti-anoikis. The consistency of the DEGs clustering with weighted gene co-expression network analysis results and the nomogram containing 10 variable genes improved the clinical applicability of ARGs. In anti-anoikis mode, cytology, histology, and epigenetics could facilitate the analysis of immunophenotypes, tumour immune microenvironment (TIME), and treatment prognosis.

Conclusion: A novel anoikis-related prognostic model for GC is constructed, and the significance of anoikis-related prognostic genes in the TIME and the metabolic pathways of tumours is initially explored.

Keywords: cancer; genetics; patient treatment.


Conflict of interest statement

All authors have no conflicts of interest to declare.

Figures

FIGURE 1
FIGURE 1
Genetic and transcriptional alterations of anoikis‐related genes (ARGs) in Gastric cancer (GC). (a) Interactions among ARGs. The line connecting the genes represents their interaction, with the line thickness indicating the strength of the association between genes. Green and violet represent favourable and risk correlations, respectively. (b) Mutation frequencies of 27 ARGs in 433 patients from the TCGA cohort. (c) Panorama of genomic mutations in the TCGA cohort. (d) Location of CNVs in ARGs on 23 chromosomes. (e) copy number variation (CNV) gain, loss, and ARG expression were different in normal and tumour tissues. (f) Forest plot of univariable regression analysis results for the 25 selected genes. CNV, copy number variant; TCGA, the cancer genome atlas. The “*” represents the statistically significant p value < 0.05, ** = p < 0.01, and *** = p < 0.001.
FIGURE 2
FIGURE 2
Identification of anoikis‐related gene (ARG) clustering and enrichment analysis. (a) non‐negative matrix factorisation (NMF) clustering based on ARGs divides the samples in the merged Gastric cancer (GC) dataset. The co‐correlation coefficient corresponding to the k value at 2 is given. (b) Differences in clinicopathologic features and expression levels of ARGs between the two clusters. (c) Kaplan–Meier (K‐M) survival curves of overall survival (OS) in C1 and C2 clusters. (d) Barplot of single sample gene set enrichment analysis (ssGSEA) quantifying the tumour‐infiltrating cell proportions. (e) The Gene ontology (GO) analysis for anoikis‐related differentially expressed genes (DEGs). (f) The Kyoto Encyclopaedia of Genes and Genomes (KEGG) analysis for anoikis‐related DEGs (ARDEGs). (g) Biological pathway between two variant isoforms. The red colour represents the activated pathway, while the blue colour represents the negative pathway. (h) WGCNA identified gene modules with highly synergistic changes. (i) The heatmap of module‐trait relationships. WGCNA, weighted gene co‐expression network analysis.
FIGURE 3
FIGURE 3
Construction and validation of anoikis‐related prognostic model (APM). (a) Expression of anoikis‐related genes (ARGs) in the high and low gene‐clusters. (b) Kaplan–Meier (K‐M) curves of overall survival (OS) in A and B gene‐clusters. (c) Association between APM_score and CSC index. (d) Lasso coefficient profiles. (e) The partial likelihood deviance graph. (f) The APM_score for predicting survival is based on the model coefficients. (g) Alluvial diagram of clusters in groups with different subtypes and survival status in the TCGA and GSE cohorts. (h) The K‐M curves show that the high APM_score group had inferior OS in the test set and training set. (i) ROC curves of 1, 3, and 5‐year OS for the test set and training set. (j) Differences in clinicopathologic features and expression levels of anoikis‐related DEGs (ARDEGs) between clusters and gene‐clusters. ROC, receiver operating characteristic; TCGA, the cancer genome atlas.
FIGURE 4
FIGURE 4
Construction and validation of a nomogram. (a) Nomogram for both clinicopathological factors and APM_score. (b) The ROC curves for 1‐, 3‐, and 5‐year nomograms. (c) Calibration curve of the nomogram for predicting 1‐, 3‐, and 5‐year overall survival (OS). (d) Stratified analysis for risk and clinical factors. (e) Association of risk scores with clinicopathological characteristics of patients, p. values for stratified analyses based on the Wilcoxon test. (f) Representatively expressed proteins of six genes in Gastric cancer (GC) and normal tissues from the Human Protein Atlas (http://www.proteinatlas.org). (g) Altered expression profiles of 10 genes in the RNA‐seq dataset of TCGA GC. ROC, receiver operating characteristic; TCGA, the cancer genome atlas.
FIGURE 5
FIGURE 5
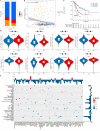
Immunity analysis for risk score correlation. (a) Expression of immune checkpoints in the high and low APM_score groups. (b) Correlation plots between risk score and 10 immune cell types. The colour and depth stand for correlation and degree, respectively. (c) Correlations between APM_score and both immune and stromal scores. (d) tumour microenvironment (TME) scores in the anoikis‐related prognostic model (APM) of stomach adenocarcinoma,STAD. (e) Differential risk scoring analysis of clusters. (f) Evaluation of three immune cell infiltration levels in Gastric cancer (GC) by the CIBERSORT algorithm. STAD, stomach adenocarcinoma.
FIGURE 6
FIGURE 6
Single‐cell sequencing of GSE184198 in Gastric cancer (GC). (a) Correlations between the abundance of immune cells and the 10 genes in this model. (b) UMAP projection showing the landscape of immune cells and the cellular distribution of anoikis‐related target function scores. (c) Overview of CellChat in the GC tumour microenvironment (TME). (d) Main sending sources and receiving targets for visualisation in two dimensions. (e) Heatmap of the canonical and curated marker genes for major cell lineages. (f) Bubble plot showing the selected ligand‐receptor interactions between two cell types. (g) Heatmap to visualise the probability of outgoing or incoming communication between two cell types. UMAP, uniform manifold approximation and projection.
FIGURE 7
FIGURE 7
Comprehensive analysis of immunity and treatment. (a) Relationship between APM_score and microsatellite instability (MSI). (b) Spearman correlation analysis of the APM_score and tumour mutation burden (TMB). (c) Survival probabilities between the anoikis‐related prognostic gene (APG) subgroup and both high and low TMB groups. (d) Relationship between the APM_score and chemotherapy sensitivity. (e) Z scores of the drugs with the signalling pathway enrichment in the summary heatmap.

Similar articles

Cited by

  • Anoikis resistance in gastric cancer: a comprehensive review.
    D'Amore T, Bravoco D, Di Paola G, Albano F, Brancaccio M, Sabato C, Cesta G, Zolfanelli C, Lauciello V, Falco G, Mazzone P. D'Amore T, et al. Cell Death Dis. 2025 Jul 15;16(1):528. doi: 10.1038/s41419-025-07860-1. Cell Death Dis. 2025. PMID: 40664635 Free PMC article. Review.

References

    1. Liu, W. , et al.: Microenvironmental influences on metastasis suppressor expression and function during a metastatic cell's journey. Cancer Microenviron. 7(3), 117–1131 (2014). 10.1007/s12307-014-0148-4 - DOI - PMC - PubMed
    1. Lee, H.Y. , et al.: The role of noncoding RNAs in the regulation of anoikis and anchorage‐independent growth in cancer. Int. J. Mol. Sci. 22(2), 627 (2021). 10.3390/ijms22020627 - DOI - PMC - PubMed
    1. Gonzalez‐Llorente, L. , et al.: Overexpression of mitochondrial IF1 prevents metastatic disease of colorectal cancer by enhancing anoikis and tumor infiltration of NK cells. Cancers 12(1), 22 (2020). 10.3390/cancers12010022 - DOI - PMC - PubMed
    1. Du, S. , et al.: Anoikis resistant gastric cancer cells promote angiogenesis and peritoneal metastasis through C/EBP beta‐mediated PDGFB autocrine and paracrine signaling. Oncogene 40(38), 5764–5779 (2021). 10.1038/s41388-021-01988-y - DOI - PubMed
    1. Zhang, T. , et al.: TCF7L2 promotes anoikis resistance and metastasis of gastric cancer by transcriptionally activating PLAUR. Int. J. Biol. Sci. 18(11), 4560–4577 (2022). 10.7150/ijbs.69933 - DOI - PMC - PubMed