. 2024 Apr 8;59(7):830-840.e4.
doi: 10.1016/j.devcel.2024.02.003. Epub 2024 Feb 19.

Stem cell migration drives lung repair in living mice

Affiliations

Stem cell migration drives lung repair in living mice

Maurizio Chioccioli et al. Dev Cell. .

Abstract

Tissue repair requires a highly coordinated cellular response to injury. In the lung, alveolar type 2 cells (AT2s) act as stem cells to replenish both themselves and alveolar type 1 cells (AT1s); however, the complex orchestration of stem cell activity after injury is poorly understood. Here, we establish longitudinal imaging of AT2s in murine intact tissues ex vivo and in vivo in order to track their dynamic behavior over time. We discover that a large fraction of AT2s become motile following injury and provide direct evidence for their migration between alveolar units. High-resolution morphokinetic mapping of AT2s further uncovers the emergence of distinct motile phenotypes. Inhibition of AT2 migration via genetic depletion of ArpC3 leads to impaired regeneration of AT2s and AT1s in vivo. Together, our results establish a requirement for stem cell migration between alveolar units and identify properties of stem cell motility at high cellular resolution.


Conflict of interest statement

Declaration of interests In the last 3 years, N.K. served as a consultant to Biogen Idec, Boehringer Ingelheim, Third Rock, Pliant, Samumed, LifeMax, Three Lake Partners, Optikira, Astra Zeneca, RohBar, Veracyte, Augmanity, CSL Behring, Galapagos, Sofinnova, and Thyron; reports equity in Pliant and Thyron; reports grants from Veracyte, Boehringer Ingelheim, and BMS; and reports non-financial support from MiRagen and Astra Zeneca. N.K. has IP on novel biomarkers and therapeutics in IPF licensed to Biotech and is a scientific founder of Thyron. P.R.T. serves as acting CEO of Iolux Inc. and serves as a consultant for Surrozen Inc., Cellarity Inc., and Celldom Inc. on work not related to the contents of this manuscript. P.R.T. received research funding support from United Therapeutics Inc, Ono Pharmaceuticals, and Boehringer Ingelheim.

Figures

Figure 1:
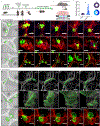
Figure 1:. SftpcGFP+ AT2 cells become motile in response to alveolar injury.
(a) Schematic of the ex-vivo imaging system for PCLS. (b) Schematic experimental workflow for live imaging of ex vivo precision cut lung slices (PCLS) generated from injured SftpcCreERT2; mTmG mice. Induction with 4x doses of tamoxifen (1 every day starting at −14 day before bleomycin injury), activates the GFP tag and treatment with bleomycin at day 0 initiates lung injury. Mice are sacrificed on day 3 and lungs harvested to generate 300 μm thick PCLS, which are cultured ex vivo in a custom-built chamber allowing for continuous imaging for a total of 72 hours. (c) Field of view with SftpcGFP-tagged AT2 cells (GFP+, green) in situ in mouse alveolar tissue (tdTomato+, red) at day 3 post-bleomycin treatment (beginning of imaging). Arrows point to representative cells that exhibit motility over the subsequent imaging period, shown as sequential frames (scale bar 50 μm). (i) AT2 cell (GFP+, green) cells moving across an alveolar space (See also Suppl. Video 1). (ii) AT2 cell (GFP+, green) migrating through the alveolar pore (dashed line) into an adjacent alveolus (See also Suppl. Video 2) (scale bar 10 μm). (d) 3D rendering of the same image at the beginning of the imaging experiment shown in (c). Middle panel identifies motile AT2 (GFP+) cells at the end of the same imaging experiment and shows cell displacement tracks. Right panel shows separate frames of representative motile cell overlayed and colored as a function of displacement length (i, ii). (e) Distribution of displacement length of motile AT2 (GFP+, green) cells (violin plots) and total proportion of AT2 (GFP+, green) motile cells versus non-motile (donut plots) in control (CTRL dark purple dots) and injured mice at 3- and 10-days post-bleomycin injury (3d BLEO light blue dots). Donut plots were estimated using max displacement length value in control (2.17 μm) as threshold (e). (g) Motile AT2s show a range of dynamic and heterogeneous behaviors (See additional Suppl. Fig. 1). Motility tracks of individual cells shown by spider plots of displacement length over time in two dimensions (x, y): saline (CTRL dark purple), 3 days post bleomycin injury (3d BLEO blue tracks); (h) example of displacement over time of a single AT2 cell 3 days post-bleo in 3D (x, y, z axis; color map by time). (i) average acceleration of AT2s 3 days post-bleomycin (blue) vs AT2s 3 days post saline (orange) over time. (mean +/− Confidence interval). Statistical significance between conditions was calculated by Kruskal-Wallis one-way ANOVA followed by Dunn’s multiple comparison test; ***p <0.001. Each data point represents a cell. Data are presented as mean ± SEM (e). 3D surface reconstructions (d) were performed by Imaris (Oxford Instruments). Cartoons in (a, b) were created with BioRender.com (agreement number GY26CMCEIJ).
Figure 2:
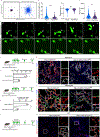
Figure 2:. In vivo imaging captures stem cell migration within and between alveoli
(a, b) Experimental approach for intravital imaging of alveolar region in SftpcCreERT2; mTmG. The approach is the same as for the ex-vivo imaging, except that instead of harvesting for PCLS, a lung imaging window is surgically implanted in the mouse for serial imaging rounds across the 72-hour window. (c) Displacement length of in-vivo tracked AT2 (GFP+ cells in injured mice. (d) In vivo imaging through the lung window shows motile AT2 (GFP+, green) cells, cell membranes (tdT+) and second harmonic generation (SHG, blue), post-bleomycin treated mice (i, ii) (See additional Suppl. Fig.3a). Motile AT2 (GFP+, green) cells were detected and tracked. (iii) in-vivo AT2 cells (GFP+, green) moving through alveolar pore to the neighbor alveolus (Suppl. Video 5). (e) (i) ex-vivo AT2 cell (GFP+, green) migrating along the alveolar septum (Suppl. Videos 7) (Scale bar 10 μm). (ii) ex-vivo AT2 cells (GFP+, green) moving through alveolar pore to the neighbor alveolus (Suppl. Video 2). (iii) ex-vivo AT2 cell (GFP+, green) migratory cells move across alveolar boundaries (scale bar 10 μm) (Suppl. Videos 6). Statistical significance between conditions was calculated by Kruskal-Wallis one-way ANOVA followed by Dunn’s multiple comparison test; ***p <0.001. Each data point represents a cell. Data are presented as mean ± SEM (c). 3D surface reconstructions (e ii, iii) were performed by Imaris (Oxford Instruments). Cartoons in (a, b; d i, ii, iii; e i, ii, iii) were created with BioRender.com (agreement number KI26CMCQ5K).
Figure 3:
Figure 3:. Behavioral mapping identifies morphological parameters associated with motility
(a) Multiscale PHATE analyses map of Area, Displacement, Ellipticity Oblate, Ellipticity Prolate, and Sphericity of AT2 cell (GFP+, green) 3 days post-bleomycin injury: each feature is mapped onto the ground truth label to visualize the distribution of values from high to low within individual clusters of cells. In the resulting visualizations, each point represents a cluster of cells with shared parametric characteristics ascribed by the Multiscale PHATE algorithm (Suppl. Fig 2). (b) Zoom in of the AT2 cell (GFP+, green) showing high displacement and high cell surface area (double arrow heads), and high displacement and low cell surface area (single arrowheads). (c) Zoom in of the AT2 cell (GFP+, green) showing high displacement but low sphericity (top and middle panels single arrowheads). (d) Zoom in of the AT2 cell (GFP+, green) showing high displacement and ellipticity prolate (top and middle panels single arrowheads). (e) Zoom in of the AT2 cell (GFP+) showing high displacement but low ellipticity oblate (double arrowheads), and cells with low displacement length but high ellipticity oblate (single arrowheads). Dynamic behavioral landscape of motile alveolar stem cells. (f) Average cell surface area of AT2 cells (GFP+) 3 days post-bleomycin injury (3d BLEO light blue dots) and saline treatment (CTRL dark purple dots). (g) Mean AT2 cell (GFP+, green) ellipticity oblate 3 days post-bleomycin injury and saline (CTRL). (h) Mean AT2 cell (GFP+, green) ellipticity prolate 3 days post-bleomycin injury and saline (CTRL). (i) Mean AT2 cell (GFP+, green) sphericity 3 days post-bleomycin injury and saline (CTRL). (k) Mean AT2 cell (GFP+, green) sphericity vs. displacement length (r2 = 0.05385; p<0.001). (l) Average AT2 cells (GFP+, green) area vs displacement length (r2 = 0.04944; p<0.001). (m) AT2 cell (GFP+, green) moving and adopting an elongated shape within same alveolus during the movement (Suppl. Video 8), (n) AT2 cell (GFP+, green) adopting a large, flattened, and curved morphology during the movement (Suppl. Video 9). (o,p) 3D renders and displacement tracks of the elongating (o), and enlarging (p) cells from (m) and (n) above. (q) Unprocessed and rendered images showing three distinct AT2 cell morphologies. (r) overlapping frames of three distinct AT2 cells (GFP+, green) phenotypes following injury showing displacement length as a function of color: (i) cuboidal (behavior 1), (ii) elongating (behavior 2), and (iii) enlarging (behavior 3). (s) Evolution for each behavioral phenotype spherical (i), elongated (ii), enlarging (iii) according to area, displacement, ellipticity and sphericity as a function of color (max values at the final frame showed). All 3D surface reconstructions were performed by Imaris, Oxford Instruments).
Figure 4:
Figure 4:. Spatial-temporal alteration of Arpc3 in AT2 stem cell impairs regeneration.
(a) Motility tracks of individual AT2 cells 3 days post bleomycin injury shown by spider plots of displacement length over time in two dimensions (x, y): Arpc3fl/fl dark purple, Arpc3 blue tracks. Reduced AT2 stem cell motility in SftpcCreERT2-R25tdT-Arpc3fl/fl compared to SftpcCreERT2-R26tdT (Suppl. Video 12), as measured by displacement (b). Changes in morphology in SftpcCreERT2-Arpc3fl/fl as measured by increased sphericity (c) and reduced cell surface area compared to SftpcCreERT2-tdT. (d) Field of view with Sftpc-tdT(+) tagged AT2 cells (showed in green) in situ in mouse alveolar tissue at day 3 post-bleomycin treatment (beginning of imaging). (e) Arrows point to representative AT2 cells in SftpcCreERT2-R26tdT (i) that exhibit motility over the subsequent imaging period, (Suppl. Video 12), and no-motile, AT2 cells form SftpcCreERT2-R26tdT-Arpc3fl/fl, shown as sequential frames) (scale bar 50 μm). (f, i, l) Schematic experimental workflow. (g) Immunostaining analysis on 12-days post bleomycin administered control lungs identified numerous lineage-labeled AT2s in damaged regions, with an elongated morphology compared to damaged regions in ArpC3fl/fl lungs which showed a less elongated morphology and fewer AT2 cells per area. (g) quantification off Sfpc-tdT(+) cells in damaged areas of Arpc3fl/fl and Arpc3 mice lung 12 day post bleomycin. n=3 (h) Immunostaining analysis and quantification for tdT(+) (AT2), HOPX(+) and AGER(+) (AT1s), identified AT2s impaired regenerative capacity in Arpc3fl/fl mice post bleomycin injury. n=3. (k, m) AT2cells infected with AAV5-DTR, followed by DT administration (See additional Suppl. Fig. 3b). (i) Immunostaining analysis for tdTomato and AGER identified clusters of AT2s in ablated lungs compared to controls (Sftpc-tdT mice). Statistical significance between conditions was calculated by Student’s t-test: HOPX QTY : *** p=0.005, SFTPC+ cells in damage area: ** p = 0.0078. Cartoons in (f, i, l) were created with BioRender.com (agreement number: TE26CMCW72).

References

    1. Barkauskas C, Cronce M, Rackley C, Bowie E, Keene D, Stripp B, Randell S, Noble P, and Hogan B. (2013). Type 2 alveolar cells are stem cells in adult lung. J. Clin. Invest 10.1172/JCI68782DS1. - DOI - PMC - PubMed
    1. Morris RJ, Liu Y, Marles L, Yang Z, Trempus C, Li S, Lin JS, Sawicki JA, and Cotsarelis G. (2004). Capturing and profiling adult hair follicle stem cells. Nat. Biotechnol 22, 411–417. 10.1038/nbt950. - DOI - PubMed
    1. Blanpain C, Lowry WE, Geoghegan A, Polak L, and Fuchs E. (2004). Self-renewal, multipotency, and the existence of two cell populations within an epithelial stem cell niche. Cell 118, 635–648. 10.1016/j.cell.2004.08.012. - DOI - PubMed
    1. Marshman E, Booth C, and Potten CS (2002). The intestinal epithelial stem cell. BioEssays 24, 91–98. 10.1002/bies.10028. - DOI - PubMed
    1. Barker N, Van Es JH, Kuipers J, Kujala P, Van Den Born M, Cozijnsen M, Haegebarth A, Korving J, Begthel H, Peters PJ, et al. (2007). Identification of stem cells in small intestine and colon by marker gene Lgr5. Nature 449, 1003–1007. 10.1038/nature06196. - DOI - PubMed

Publication types

LinkOut - more resources