. 2024 Apr 2;36(4):793-807.e5.
doi: 10.1016/j.cmet.2024.01.015. Epub 2024 Feb 19.

IgG is an aging factor that drives adipose tissue fibrosis and metabolic decline

Affiliations

IgG is an aging factor that drives adipose tissue fibrosis and metabolic decline

Lexiang Yu et al. Cell Metab. .

Abstract

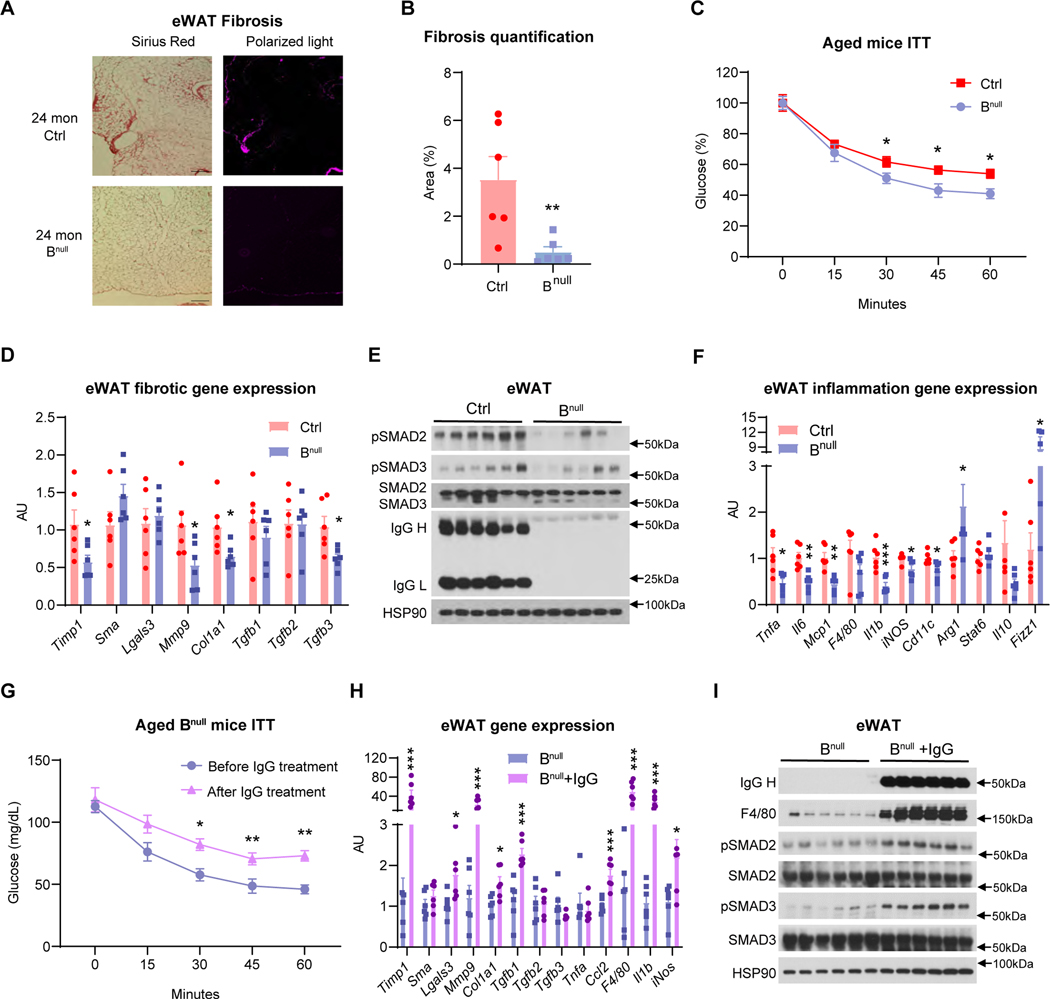
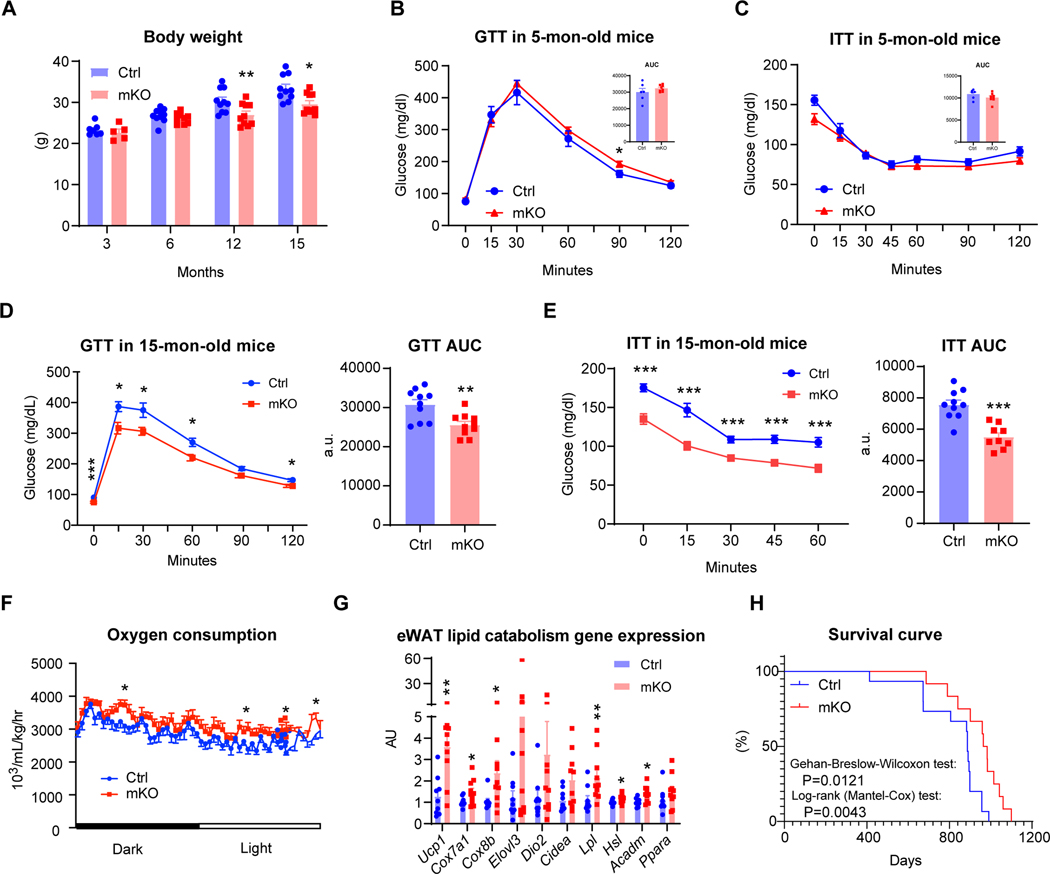
Aging is underpinned by pronounced metabolic decline; however, the drivers remain obscure. Here, we report that IgG accumulates during aging, particularly in white adipose tissue (WAT), to impair adipose tissue function and metabolic health. Caloric restriction (CR) decreases IgG accumulation in WAT, whereas replenishing IgG counteracts CR's metabolic benefits. IgG activates macrophages via Ras signaling and consequently induces fibrosis in WAT through the TGF-β/SMAD pathway. Consistently, B cell null mice are protected from aging-associated WAT fibrosis, inflammation, and insulin resistance, unless exposed to IgG. Conditional ablation of the IgG recycling receptor, neonatal Fc receptor (FcRn), in macrophages prevents IgG accumulation in aging, resulting in prolonged healthspan and lifespan. Further, targeting FcRn by antisense oligonucleotide restores WAT integrity and metabolic health in aged mice. These findings pinpoint IgG as a hidden culprit in aging and enlighten a novel strategy to rejuvenate metabolic health.

Keywords: IgG; adipose tissue; aging; fibrosis; metabolic dysfunction.


Conflict of interest statement

Declaration of interests A patent application is pending by Columbia University.

Figures

Figure 1.
Figure 1.. IgG is preferentially accumulated in adipose tissue during aging.
(A) Coomassie blue staining of SDS-PAGE of total protein extracted from young (3 mon) and aged (33 mon) male mouse eWAT. Red bracket indicates the ~1 cm slice (showing the most significant changes at this region) for mass spectrometry analysis. (B) Flow graph summary of mass spectrometric identification of immunoglobulin (Ig) proteins enriched in aged eWAT. The full list of significant differentially expressed peptides is provided in Table S1. (C) Immunohistochemical (IHC) staining and quantification of IgG in eWAT from young and aged male mice. Scale bar, 100 μm, (n=5, 5). (D) Western blot (WB) analysis of IgG heavy (H) and light (L) chains in eWAT protein extracts and plasma samples from C57BL/6J mice during aging. Ponceau red staining band was used as the loading control for the plasma samples. Mice were perfused to clear blood in the circulation before harvesting tissues. (E) WB of IgG across different tissues from 33-month-old male mice. HSP90 was used as a loading control. Mice were perfused to clear blood in the circulation before harvesting tissues. (F) WB analysis of IgG in human epicardial fat at the indicated ages. (G) The correlations of human IgG (heavy chain) levels to age (quantifications of WB in 1F). (H) Transcriptomic analyses reveal the top progressively increased (top) and decreased (bottom) biological processes (BPs) in eWAT during aging of C57BL/6J male mice. The complete BP list is provided in Figure S2. See also Figures S1, S2, and Table S1.
Figure 2.
Figure 2.. The metabolic improvements by calorie restriction in aging are mediated through reducing IgG.
(A-E) 12-month-old male C57BL/6J mice were subjected to 30% caloric restriction (CR) for 4 weeks. (A-B) WB of plasma IgG, IgA, and IgM levels in ad libitum (ad lib) and CR mice (A) and quantifications (B). ***p<0.001 for CR vs ad lib control by 2-tailed student t-test (n=6, 6). (C-D) WB analysis (C) and quantification (D) of IgG and SirT1 in protein lysates of eWAT and iWAT from ad lib and CR mice. HSP90 was used as the loading control, (n=6, 6). (E) qPCR analysis of gene expression (arbitrary units, AU) in eWAT of a different cohort of 4-week CR and ad lib mice (n=8, 8). (F-H) 5-month-old male C57BL/6J mice were intraperitoneally (i.p.) administered 3 mg mouse total IgG or vehicle (Veh) per week for 4 weeks since the beginning of CR. The regularly fed mice were included as the ad libitum control group. (F) WB analysis of IgG in eWAT from mice treated with ad lib, CR-Veh and CR-IgG. (G) qPCR analysis of eWAT gene expression from all three groups of mice (n=5, 8, 7). (H) Insulin tolerance test (ITT) and the area under curve (AUC) after 3-wk treatment (n=5, 8, 7). Data are presented as mean ± SEM; *p<0.05, **p<0.01 vs CR-Veh group by 2-tailed student t-test or one-way ANOVA. See also Figure S3.
Figure 3.
Figure 3.. IgG activates macrophages to promote adipose tissue fibrosis.
(A) Picrosirius red staining of eWAT fibrosis in young (3-mon) and aged (33-mon) mice imaged by bright field and polarized-light microscopy and fibrosis area quantification (n=10, 10). Scale bar, 50 μm. (B) Immunostaining of IgG, SMA, CD68, and DAPI of eWAT sections from young and aged mice. Scale bar, 50 μm. (C) Schematic diagram of the TGF-β/SMAD signaling pathway to activate fibrotic response. (D) WB analysis of phospho-SMAD2 and phospho-SMAD3 in the eWAT of young and aged mice. HSP90 was used as the loading control. (E-G) Young C57BL/6J mice were i.p. injected with mouse total IgG (3 mg weekly) for 4 weeks. (E) WB analysis of SMADs phosphorylation in the eWAT. (F) qPCR analysis of fibrotic gene expression in the eWAT from Veh- or IgG-treated mice (n=5, 5). (G) Enrichment of biological processes by IgG treatment in eWAT. The biological processes influenced by IgG treatment in eWAT were analyzed by DEG (Differentially Expressed Genes). The significant changed signal pathways were plotted for IgG treat vs. Vehicle. The top 15 significant biological processes (BPs) were ranked according to their FDR, and redundant terms were removed u REVIGO. (H-I) Mouse BMDMs were treated with 200 μg/mL IgG for 24 hours, and RNA was extracted for RNA-seq and qPCR analysis (H) Enriched BPs by IgG treatment in BMDMs. The BPs affected by IgG treatment in BMDM were analyzed by DEG. The significant changed signal pathways were plotted for IgG treat vs. Vehicle. The top 15 significant biological processes were ranked according to their FDR, and redundant terms were removed by REVIGO. (I) qPCR analysis of the expression of inflammatory markers and Tgfb isoforms in BMDMs (n=3, 3). (J) qPCR analysis of fibrotic genes’ expression in 3T3-L1 preadipocytes treated with conditioned media (CM) collected from vehicle- (Veh-CM) or IgG-treated (IgG-CM) BMDMs. 5 μM TGF-βR inhibitor LY2109761 or 10 ng/mL TGF-β was added as control treatments (n=3/group). *p<0.05, **p<0.01, ***P<0.001 vs Veh-CM; $ p<0.05, $ $ p<0.01, $ $ $ p<0.001 for IgG-CM + LY2109761 vs IgG-CM. (K) WB analysis of TGF-β signaling in the CM-treated 3T3-L1 preadipocytes. (L) WB analysis of ERK and MEK phosphorylation in BMDMs treated with 200 μg/mL IgG, 50 ng/mL LPS (proinflammatory activation), or 50 ng/mL IL-4 (alternative activation) for 24 hours. (M) Ras activity was measured in the BMDMs treated with 200 μg/mL IgG or 50 ng/mL LPS for 24 hours. 50 ng/mL EGF was used as the positive control for Ras activation (n=3/group). (N) ELISA determination of TGF-β production in the CM of Vehicle (Veh), IgG-, boiled IgG-, and IgG-ERK inhibitor- (1Um) treated BMDMs (n=6/group). Data are presented as mean ± SEM, *p<0.05, **p<0.01, ***p<0.001 for the treatment group vs Vehicle group by 2-tailed student t-test or one-way ANOVA analysis. See also Figure S4.
Figure 4.
Figure 4.. Bnull mice are protected from aging-associated adipose tissue fibrosis.
(A-F) 24-month-old male control (Ctrl) and Bnull mice on the C57BL/6J background were used in the following studies (n=6, 6). (A) Picrosirius red staining of eWAT sections imaged by brightfield and polarized-light microscopy. Scale bar, 100 μm. (B) Quantification of eWAT fibrosis area of Ctrl and Bnull mice in (A), (n=6, 6). (C) Insulin tolerance test (ITT) in aged Ctrl and Bnull mice. (D) qPCR analysis of eWAT fibrotic gene expression. (E) WB analysis of IgG and SMADs signaling in the eWAT tissue extracts. HSP90 was used as the loading control. (F) qPCR analysis of pro- and anti-inflammatory genes in eWAT. (G-I) 22–24-month-old Bnull mice were i.p. administered 3 mg mouse total IgG or vehicle (Veh) per week for 4 weeks (n=6). (G) Insulin tolerance test (ITT) were compared before and after IgG treatment (n=6, 6). (H) qPCR analysis of eWAT fibrotic and inflammatory gene expression after 4 weeks’ treatment. Aged Bnull mice were used as the control group (n=6, 6). (I) WB analysis of eWAT proteins, with aged Bnull mice as the control group. HSP90 was used as the loading control. Data are presented as mean ± SEM, *p<0.05, **p<0.01, and ***p<0.001 by 2-tailed student t-test.
Figure 5.
Figure 5.. Abolishing IgG recycling in macrophages prevents IgG accumulation and adipose tissue fibrosis in aged mice.
(A) Schematic diagram of FcRn-dependent IgG recycling. (B) Fcgrt mRNA expression in peritoneal macrophages (MØ) isolated from 6-wk-old Fcgrtflox/flox;LysMcre (mKO) and Fcgrtflox/flox control (Ctrl) mice (n=3, 3). (C) The half-life of circulating biotin-labelled mouse IgG in 15-mon-old Ctrl and mKO mice (n=5, 6). (D) WB analysis of FcRn and IgG in eWAT from 15-mon-old Ctrl and mKO mice. (E) Picrosirius red staining of eWAT fibrosis in 15-mon-old Ctrl and mKO mice imaged by brightfield and polarized-light microscopy. Scale bar, 200 μm. (F) Quantification of fibrosis area shown in E (n=10, 10). (G) WB analysis of SMADs phosphorylation in the eWAT of 15-mon-old Ctrl and mKO mice. (H) qPCR analysis of eWAT fibrotic gene expression in 15-mon-old Ctrl and mKO mice (n=9, 10). (I) qPCR analysis of eWAT inflammatory gene expression in 15-mon-old Ctrl and mKO mice (n=9, 10). (J) H&E staining of eWAT and iWAT from 15-mon-old Ctrl and mKO mice. Scale bar, 200 μm. (K) eWAT adipocyte size frequency distribution (n=10, 10). Data are presented as mean ± SEM, *p<0.05, **p<0.01, and ***p<0.001 for mKO vs Ctrl by 2-tailed student t-test. See also Figure S5.
Figure 6.
Figure 6.. Prevention of IgG accumulation extends the healthspan and lifespan of mKO mice.
(A) Body weight of Ctrl and mKO mice at indicated ages; 3 mon (n= 7, 5), 6 mon (n=10, 9), 12 &15 mon (n=10, 10). (B-C) Glucose tolerance test (GTT) and its area under curve (AUC) (B), ITT and its AUC (C) in 5-mon-old male Ctrl and mKO mice (n=6, 8). (D-E) GTT (n=10, 10) (D) and ITT (n=10, 9) (E) with their AUC in 15-mon-old Ctrl and mKO mice. (F) Oxygen consumption over a 24-hr dark/light cycle from indirect calorimetry in 15-mon-old Ctrl and mKO mice (n=10, 10). (G) qPCR analysis of eWAT gene expression involved in lipid metabolism in 15-mon-old Ctrl and mKO mice (n=9, 10). (H) Survival curve of Ctrl and mKO mice with Gehan-Breslow-Wilcoxon test: p=0.0121, and Log-rank (Mantel-Cox) test: p=0.0043. Data are presented as mean ± SEM, *p<0.05, **p<0.01, and ***p<0.001 for mKO vs Ctrl by 2-tailed student t-test except H. See also Figure S6.
Figure 7.
Figure 7.. Targeting IgG recycling improves metabolism and adipose remodeling in aged mice.
(A) Experimental design for treating 70-week-old male mice with control (Ctrl) or FcRn antisense oligonucleotides (ASO) for 8 weeks. The following parameters were measured: (B) WB analysis of FcRn in eWAT. GAPDH was used as the loading control. (C) Plasma IgG levels determined by ELISA after 8 weeks of ASO treatment (n=7, 7). (D) WB analysis of IgGs in eWAT with GAPDH as the loading control. (E) Body weight curve during the treatment (n=8, 8). (F) O2 consumption by indirect calorimetry. (G) ITT after 5 weeks of ASO treatment (n=8, 8). (H) GTT after 6 weeks of ASO treatment (n=8, 8). (I) WAT and liver weights at the end of the 8-wk treatment (n=8, 8). (J) H&E staining of eWAT, Scale bar, 100 μm. (K) qPCR analysis of gene expression in eWAT (n=6, 6). (L) qPCR analysis of fibrotic genes in eWAT (n=8, 8). (M) WB analysis of TGF-β signaling in eWAT. HSP90 was used as the loading control. Data are presented as mean ± SEM; *p<0.05, **p<0.01 for Ctrl vs FcRn ASO group by 2-tailed student t-test. See also Figure S7.

Similar articles

Cited by

References

    1. Barzilai N, Huffman DM, Muzumdar RH, and Bartke A. (2012). The critical role of metabolic pathways in aging. Diabetes 61, 1315–1322. 10.2337/db11-1300. - DOI - PMC - PubMed
    1. Hildrum B, Mykletun A, Hole T, Midthjell K, and Dahl AA. (2007). Age-specific prevalence of the metabolic syndrome defined by the International Diabetes Federation and the National Cholesterol Education Program: the Norwegian HUNT 2 study. BMC public health 7, 220. 10.1186/1471-2458-7-220. - DOI - PMC - PubMed
    1. Grover SA, Kaouache M, Rempel P, Joseph L, Dawes M, Lau DC, and Lowensteyn I. (2015). Years of life lost and healthy life-years lost from diabetes and cardiovascular disease in overweight and obese people: a modelling study. Lancet Diabetes Endocrinol 3, 114–122. 10.1016/S2213-8587(14)70229-3. - DOI - PubMed
    1. Kenyon CJ. (2010). The genetics of ageing. Nature 464, 504–512. 10.1038/nature08980. - DOI - PubMed
    1. Junnila RK, List EO, Berryman DE, Murrey JW, and Kopchick JJ. (2013). The GH/IGF-1 axis in ageing and longevity. Nat Rev Endocrinol 9, 366–376. 10.1038/nrendo.2013.67. - DOI - PMC - PubMed

Substances

LinkOut - more resources