. 2024 May 31;195(2):1694-1711.
doi: 10.1093/plphys/kiae090.

Synthetically derived BiAux modulates auxin co-receptor activity to stimulate lateral root formation

Affiliations

Synthetically derived BiAux modulates auxin co-receptor activity to stimulate lateral root formation

Mary Paz González-García et al. Plant Physiol. .

Abstract

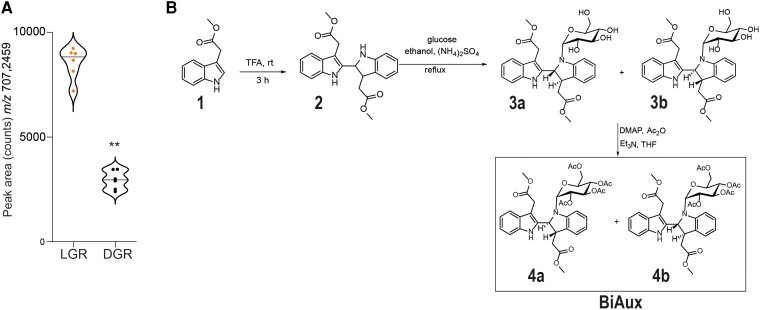
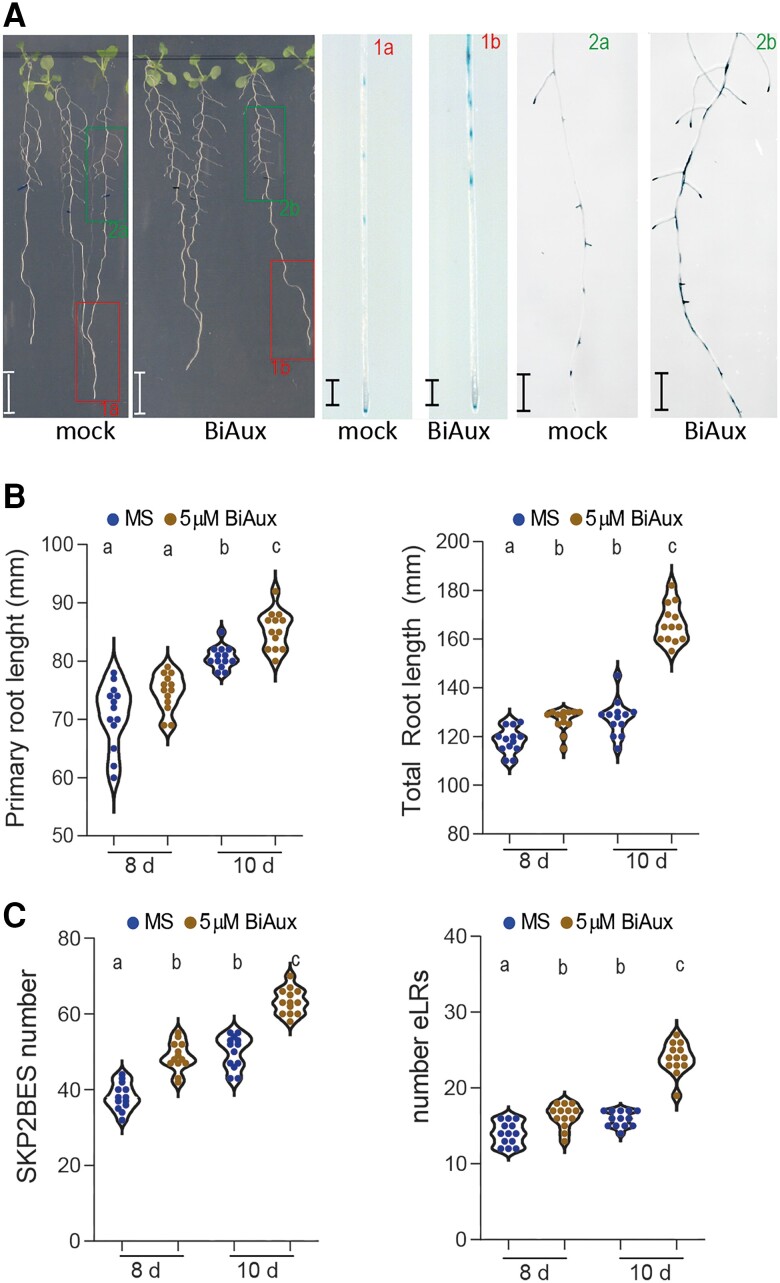
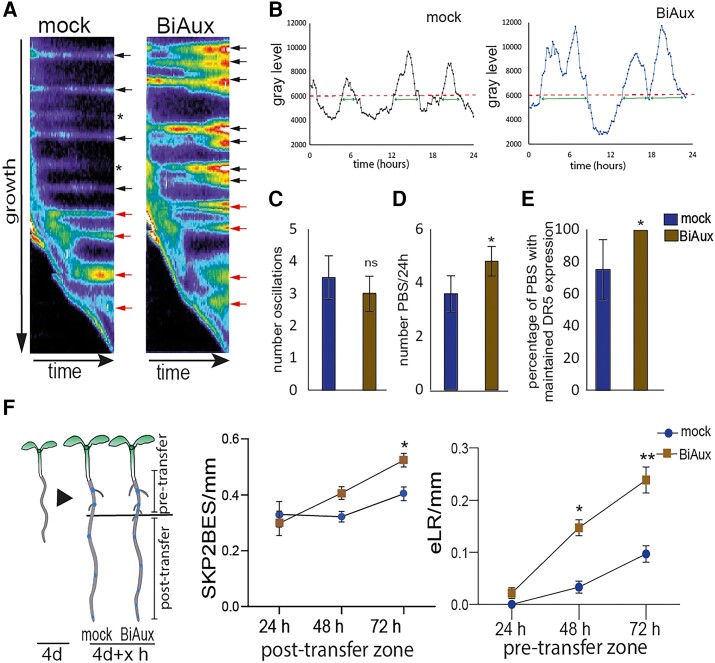
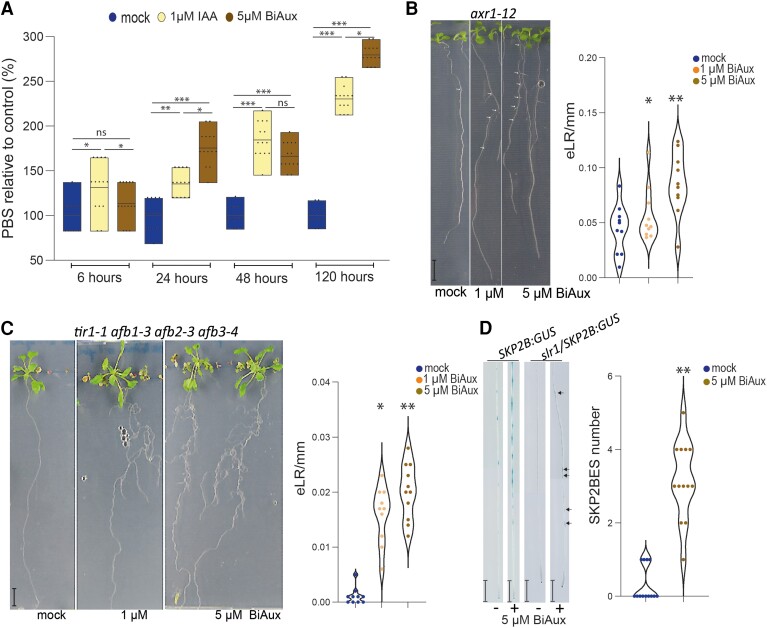
The root system plays an essential role in plant growth and adaptation to the surrounding environment. The root clock periodically specifies lateral root prebranch sites (PBS), where a group of pericycle founder cells (FC) is primed to become lateral root founder cells and eventually give rise to lateral root primordia or lateral roots (LRs). This clock-driven organ formation process is tightly controlled by modulation of auxin content and signaling. Auxin perception entails the physical interaction of TRANSPORT INHIBITOR RESPONSE 1 (TIR1) or AUXIN SIGNALING F-BOX (AFBs) proteins with AUXIN/INDOLE-3-ACETIC ACID (Aux/IAA) repressors to form a co-receptor system. Despite the apparent simplicity, the understanding of how specific auxin co-receptors are assembled remains unclear. We identified the compound bis-methyl auxin conjugated with N-glucoside, or BiAux, in Arabidopsis (Arabidopsis thaliana) that specifically induces the formation of PBS and the emergence of LR, with a slight effect on root elongation. Docking analyses indicated that BiAux binds to F-box proteins, and we showed that BiAux function depends on TIR1 and AFB2 F-box proteins and AUXIN RESPONSE FACTOR 7 activity, which is involved in FC specification and LR formation. Finally, using a yeast (Saccharomyces cerevisiae) heterologous expression system, we showed that BiAux favors the assemblage of specific co-receptors subunits involved in LR formation and enhances AUXIN/INDOLE-3-ACETIC ACID 28 protein degradation. These results indicate that BiAux acts as an allosteric modulator of specific auxin co-receptors. Therefore, BiAux exerts a fine-tune regulation of auxin signaling aimed to the specific formation of LR among the many development processes regulated by auxin.


Conflict of interest statement

Conflict of interest statement: The authors declare that the research was conducted in the absence of any commercial or financial relationships that could be construed as a potential conflict of interest.

Figures

Figure 1.
Figure 1.
Light grown roots accumulate higher level of BiAux. A) Area (counts) of the peak corresponding to the metabolite m/z 707.2451 in light-grown roots (LGR) or dark-grown roots (DGR). Asterisks indicate the statistical significance by a t-test **P-value < 0.01. n = 6. B) Schematic procedure for BiAux synthesis process (for additional details see Supplementary Materials and methods). Notice that two diasteroisomers were obtained: 3a, 3b, which render the final BiAux diasteroisomers 4a and 4b.
Figure 2.
Figure 2.
BiAux induces lateral root formation. A) Arabidopsis SKP2Bp::GUS seedlings grown in ½MS medium for 4 d and then transferred to new plates containing mock or 5 µM of BiAux during 6 d. Right panels show the GUS-stained roots labeled as 1a and 1b (apical region of primary root) or 2a and 2b (shootwards part of the root). Numbers indicate the position of the pictures in the GUS-stained roots. Scale bar corresponds to 0.5 cm. B) Primary root length and total root length (root length of the primary root plus eLRs) of SKP2Bp::GUS seedlings grown or 4 d and then transferred to new plates containing mock or 5 µM of BiAux during 4 or 6 d, n ≥ 20. C) Number of SKP2BES (left) or eLR (right) in SKP2Bp::GUS seedlings grown as in B. n ≥ 20 (two biological replicates). Significance was analyzed by ANOVA and Tukey HSD post-test. Different letters indicate statistical differences.
Figure 3.
Figure 3.
BiAux modifies the root clock. A) Kymographs of DR5::LUC luminescence showing PBS production and DR5:LUC signal intensity in mock- and BiAux-treated seedlings. Red arrows indicate priming events in a 24-h period. Black arrows indicate PBS already generated. Note that the DR5::LUC expression is maintained in all PBS over time in BiAux treated roots, while its expression is not maintained in all PBS (asterisks) over time in mock-treated roots. B) LUC activity measurements at the root tip registering the oscillations during 24 h. Dash lines indicate the threshold of the oscillation. Arrow lines indicate the length of the oscillations. C) Average of DR5::LUC oscillations during 24 h in mock- or BiAux-treated seedlings. ns, statistical significance by a t-test P-value > 0.05. D) Number of PBS specified in mock- or BiAux-treated roots per 24 h. E) Percentage of PBS that maintained the DR5::LUC signal over the time. *, significant differences by t-test P < 0.05. Number of roots analyzed in (C) to (E) = 12 for mock and 5 for BiAux. F) SKP2Bp::GUS seedlings were grown in ½MS for 4 d and then, transferred to fresh medium containing mock or 5 µM BiAux for the indicated hours. Afterwards they were stained for GUS activity in the plate and SKP2BES in the post-transfer root section or number of eLRs in the pre-transfer section were quantified. n > 200 seedlings in each point (one biological replicate). Asterisks indicate the statistical significance by a t-test *, P-value < 0.05, ***, P-value < 0.001. In all cases, error bars correspond to standard deviation (Sd).
Figure 4.
Figure 4.
BiAux affects auxin responses. A) Relative number of DR5ES in seedlings grown 4 d in ½MS and the indicated hours in ½MS with DMSO (mock), 1 µM of IAA or 5 µM BiAux for the indicated time. Values represent the percentage relative to the mock average. Asterisks indicate significant differences by t-test in a genotype comparing mock and BiAux treatment. *, P < 0.05; **, P < 0.01; ***, P < 0.001 by t-test, n ≥ 15 (one biological replicate). Limits in the boxplot correspond to maximum and minimum values. Line inside of boxplot indicates the main. B) Phenotype of axr1-12 mutant seedlings grown in ½MS with mock or with 1 µM or 5 µM of BiAux for 10 d. Scale corresponds to bar: 1 cm. Right graph shows the density (number/mm) of eLR. n = 10 (one biological replicate). Asterisks indicate significant differences in the axr1-12 by BiAux treatment by t-test. *, P < 0.05; **, P < 0.01. C) Phenotype of tir1 afb1 afb2 afb3 quadruple mutant, which developed the main root, grown in ½MS or with mock or 1 or 5 µM BiAux for 21 d. Scale corresponds to bar: 1 cm. Right graph shows the density (number/mm) of eLR. n ≥ 8 (two biological replicates). Asterisks indicate significant differences in the quadruple mutant by BiAux treatment by t-test. *P < 0.05; **P < 0.01. D) GUS staining of SKP2Bp::GUS and slr-1/SKP2Bp::GUS roots grown in ½MS with mock (−) or 5 µM of BiAux (+) during 12 d. Scale bar corresponds to 0.5 cm, n ≥ 12. Arrows indicate SKP2BES in BiAux-treated slr roots. Note that each root is a composite figure. Asterisks indicate significant differences in slr1 by BiAux treatment by t-test. **P < 0.01.
Figure 5.
Figure 5.
BiAux alters gene expression. A) Hierarchical clustering of genes deregulated by BiAux, IAA or the combination of both (IAA + BiAux). Scale bar indicates gene expression level compared with mock (log2). B, C) GO of upregulated (B) or downregulated (C) genes in Arabidopsis roots treated with mock or BiAux during 3 d. Numbers indicate the probability (log10 of the FDR). D) Venn diagrams showing the common genes between upregulated or downregulated genes in BiAux-, IAA- or BiAux + IAA-treated seedlings. Number of common genes between BiAux and IAA (both up- and downregulated) were statistically significant (binomial test, P-value < 0.01).
Figure 6.
Figure 6.
BiAux signaling requires TIR1 and AFB2. A) Representative pictures of luciferase signal from DR5::LUC reporter in control seedlings, tir1, afb2 or double mutant tir1 afb2 grown for 4 d in ½MS and then transferred to fresh medium containing DMSO (mock) or 5 µM of BiAux for 4 d. Scale bar = 1 cm. B) Relative number of DR5ES (BiAux/mock) measured in the whole roots of control and in tir1, afb2, and double tir1/afb2. Values represent the percentage relative to the mock average, n ≥ 15 (three biological replicates). Asterisks indicate significant differences by t-test in a genotype comparing mock and BiAux treatment. ***, P-value < 0.01. ns, no significant. Limits in the boxplot correspond to maximum and minimum values. Line inside of boxplot indicates the main value. C) Superposition of the crystal structure of the TIR1 (dark blue ribbon)–ASK1 (orange ribbon)–IP6 (sticks with carbons in white) complex (PDB id. 2P1M) and the optimized structure of the TIR1 (light blue ribbon)–ASK1 (yellow ribbon)–BiAux (sticks with carbons in green) complex. The location of auxin (sticks with carbons in cyan) and IP6 (orange and red) from the crystal structures of 2P1P (PDB id.) are also shown for reference. D) Binding site defined by a neighborhood of 4 Å around BiAux (sticks with carbons in green) in the superposition of crystal (sticks with carbons in dark blue) and optimized (sticks with carbons in light blue) structures displayed in (C). The location of auxin (IAA) and naphthalene (NLA, naphthalen-1-yl-acetic acid) are also included for reference. E) PB-EP mapped onto the molecular surface of TIR1, AFB1, AFB2, and AFB3 proteins viewed from the protein side of the BiAux-binding site. Left images show the proteins in the absence of BiAux and right images show the BiAux complexes with the PB-EP mapped onto the surface of BiAux, which is marked with yellow circles. The scale bar on the bottom of this panel indicates the range of PB-EP values (in kT/e units) used in these images.
Figure 7.
Figure 7.
BiAux function requires ARF7 activity. A) Representative pictures of luciferase signal in control seedlings, arf7-1, arf19-1 grown for 4 d in ½MS and then transferred to ½MS containing DMSO (mock) or 5 µM of BiAux for 4 d. Scale bar = 1 cm. B) Relative number of DR5ES (BiAux/mock) measured in the whole roots of control and in DR5::LUC, arf7-1 DR5::LUC, or arf19-1 DR5::LUC seedlings. n = 8 (two biological replicates). Values represent the percentage relative to the mock average. Asterisks indicate significant differences by t-test in a genotype comparing mock and BiAux treatment. ***, P-value < 0.01. Limits in the boxplot correspond to maximum and minimum values. Line inside of boxplot indicates the main value.
Figure 8.
Figure 8.
BiAux increases the interaction between TIR1/AFB2 and IAA18 or IAA28. A) Y2H interaction experiments between TIR1 and AFB2 with Aux/IAA18 adding different concentration of auxin (IAA) and BiAux as indicated. B) Quantification of β-galactosidase in arbitrary units. n = 12 (two biological replicates). C) Y2H interaction experiments between TIR1 or AFB2 with Aux/IAA28 adding different concentration of auxin and BiAux as indicated. D) Quantification of β-galactosidase in arbitrary units. n = 12 (two biological replicates). Significance was analyzed by ANOVA and Tukey HSD post-test. P < 0.05. Different letters indicate statistical differences.
Figure 9.
Figure 9.
BiAux increases the degradation of IAA28. A) IAA28-VENUS signal in root meristem of pHS::IAA28-VENUS seedlings treated with mock (DMSO), 10 µM BiAux, 1 µM of IAA, or 10 µM BiAux plus 1 µM of IAA. Pictures were taken every 10 min. Scale bars correspond to 50 µm. Note that each root is a composite figure. B) IAA28-VENUS signal quantification in three different experiments. Asterisks indicate statistical differences between the treatment and mock by t-test. *P < 0.05; **P < 0.01; ***P < 0.001. “a” indicates statistical differences between BiAux + IAA and BiAux treatments (P < 0.001) in at least three time points. “b” indicates statistical differences between IAA treatment and BiAux (P < 0.01) in at least three time points. ns indicates no statistical difference between BiAux + IAA and IAA treatments. Error bars correspond to standard deviation (Sd).

Similar articles

Cited by

References

    1. Abbas M, Hernández-García J, Pollmann S, Samodelov SL, Kolb M, Friml J, Hammes UZ, Zurbriggen MD, Blázquez MA, Alabadí D. Auxin methylation is required for differential growth in Arabidopsis. Proc Natl Acad Sci U S A. 2018:115(26):6864–6869. 10.1073/pnas.1806565115 - DOI - PMC - PubMed
    1. Anders S, Huber W. Differential expression analysis for sequence count data. Genome Biol. 2010:11(10):R106. 10.1186/gb-2010-11-10-r106 - DOI - PMC - PubMed
    1. Andreani A, Burnelli S, Granaiola M, Leoni A, Locatelli A, Morigi R, Rambaldi M, Varoli L, Landi L, Prata C, et al. . Antitumor activity of bis-indole derivatives. J Med Chem. 2008:51(15):4563–4570. 10.1021/jm800194k - DOI - PMC - PubMed
    1. Andrews S. FastQC: a quality control tool for high throughput sequence data. 2010. Available online at: http://www.bioinformatics.babraham.ac.uk/projects/fastqc.
    1. Bajguz A, Piotrowska A. Conjugates of auxin and cytokinin. Phytochemistry. 2009:70(8):957–969. 10.1016/j.phytochem.2009.05.006 - DOI - PubMed

MeSH terms