. 2024 Jun 6;73(7):1110-1123.
doi: 10.1136/gutjnl-2022-328608.

Milk fat globule-epidermal growth factor 8 (MFGE8) prevents intestinal fibrosis

Affiliations

Milk fat globule-epidermal growth factor 8 (MFGE8) prevents intestinal fibrosis

Sinan Lin et al. Gut. .

Abstract

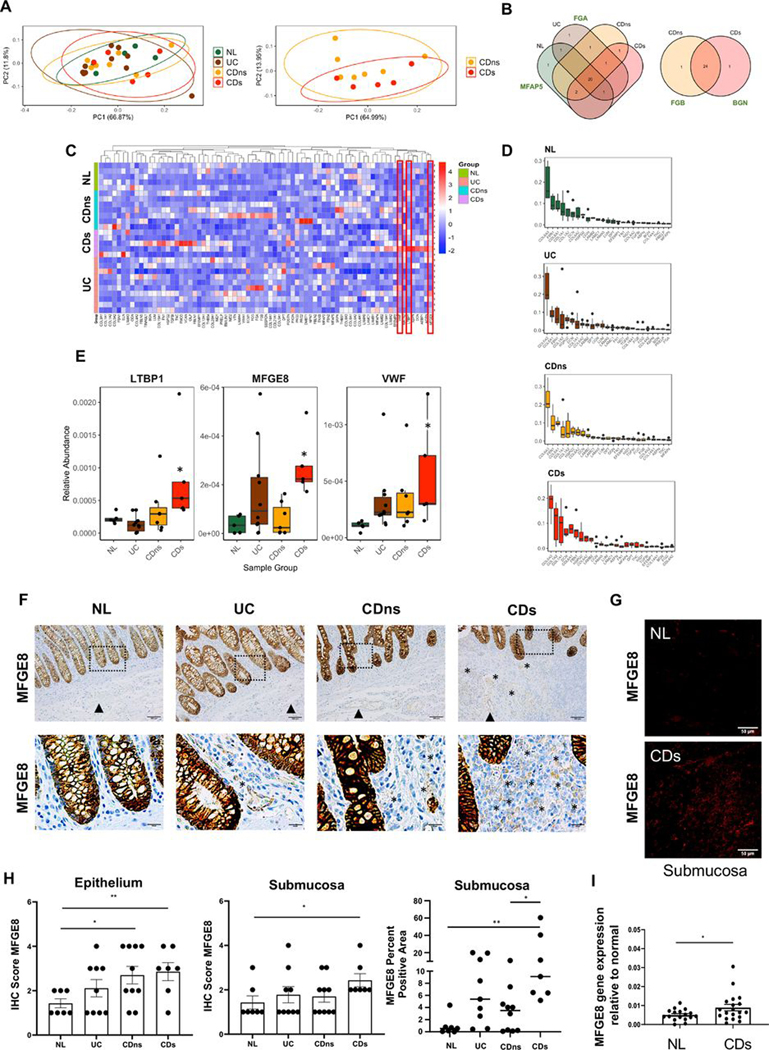
Objective: Intestinal fibrosis is considered an inevitable consequence of chronic IBD, leading to stricture formation and need for surgery. During the process of fibrogenesis, extracellular matrix (ECM) components critically regulate the function of mesenchymal cells. We characterised the composition and function of ECM in fibrostenosing Crohn's disease (CD) and control tissues.

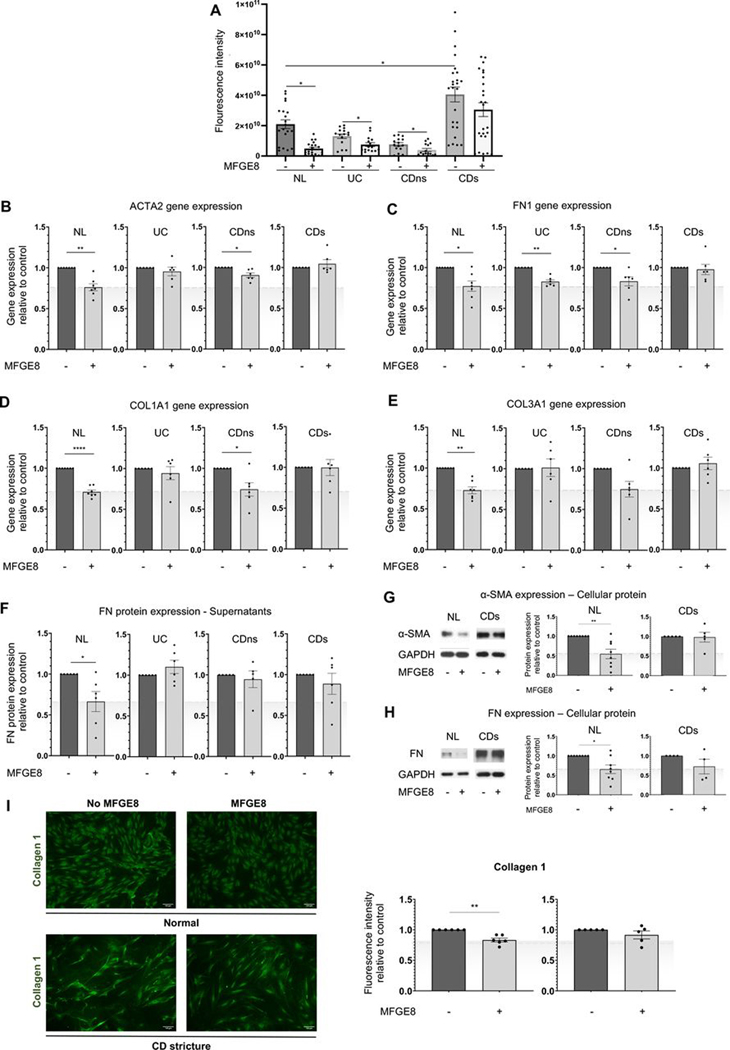
Design: Decellularised full-thickness intestinal tissue platforms were tested using three different protocols, and ECM composition in different tissue phenotypes was explored by proteomics and validated by quantitative PCR (qPCR) and immunohistochemistry. Primary human intestinal myofibroblasts (HIMFs) treated with milk fat globule-epidermal growth factor 8 (MFGE8) were evaluated regarding the mechanism of their antifibrotic response, and the action of MFGE8 was tested in two experimental intestinal fibrosis models.

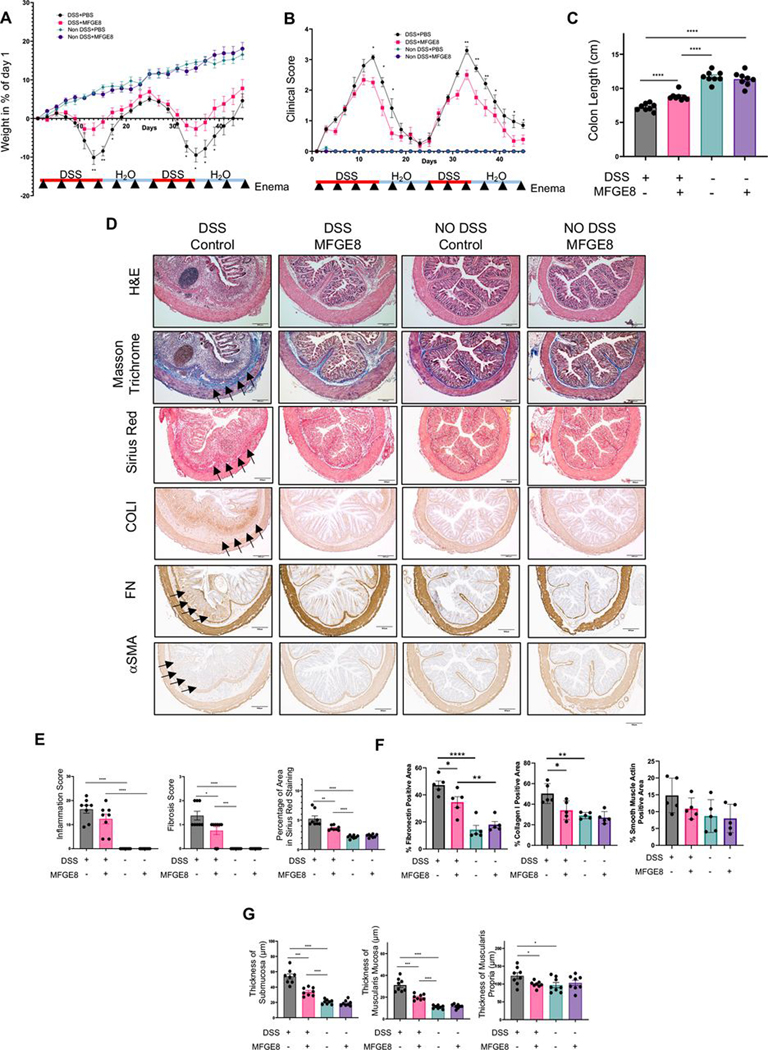
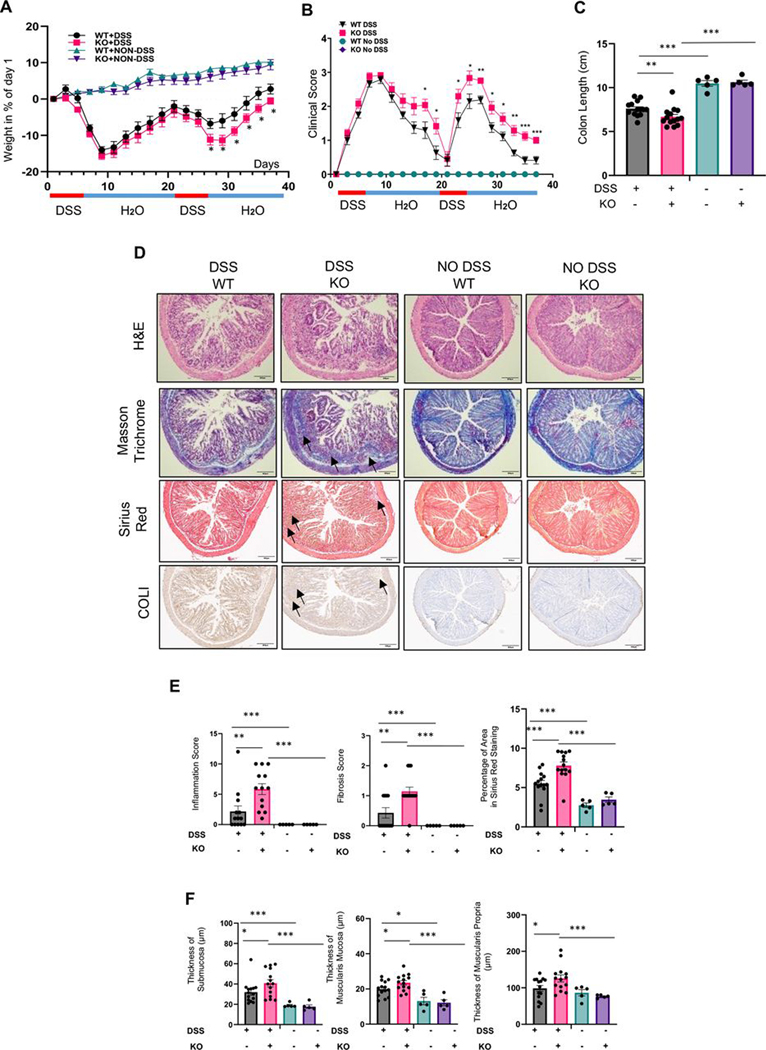
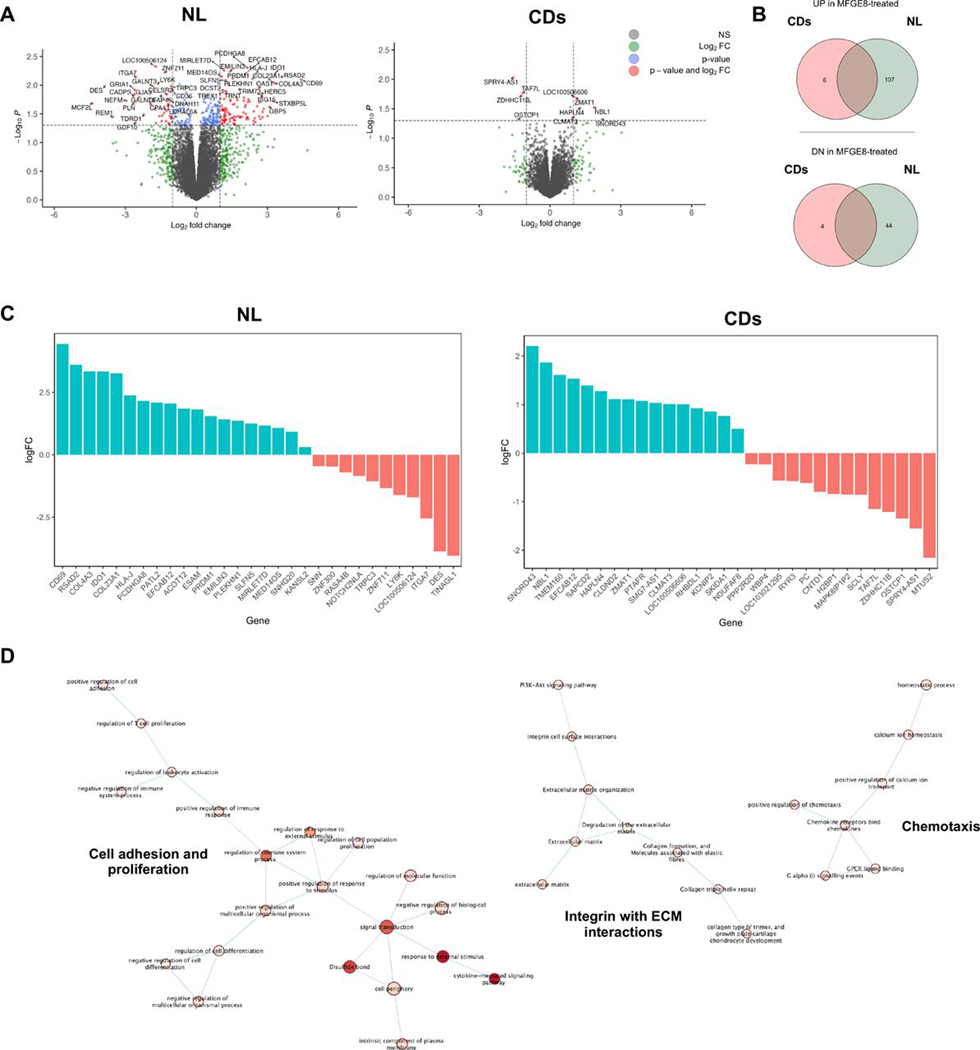
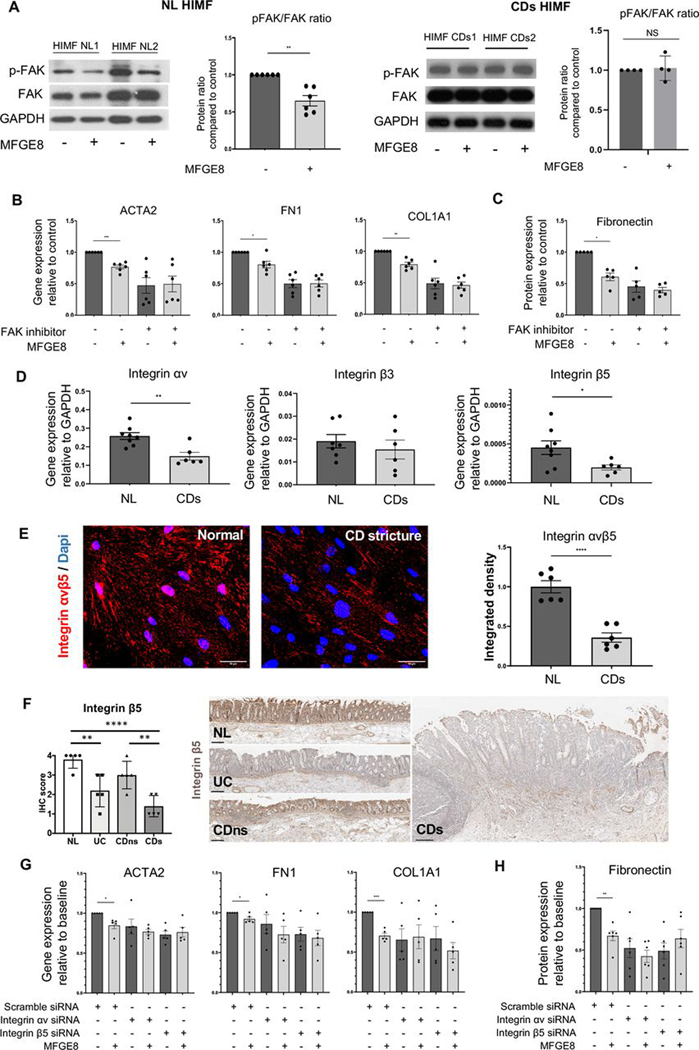
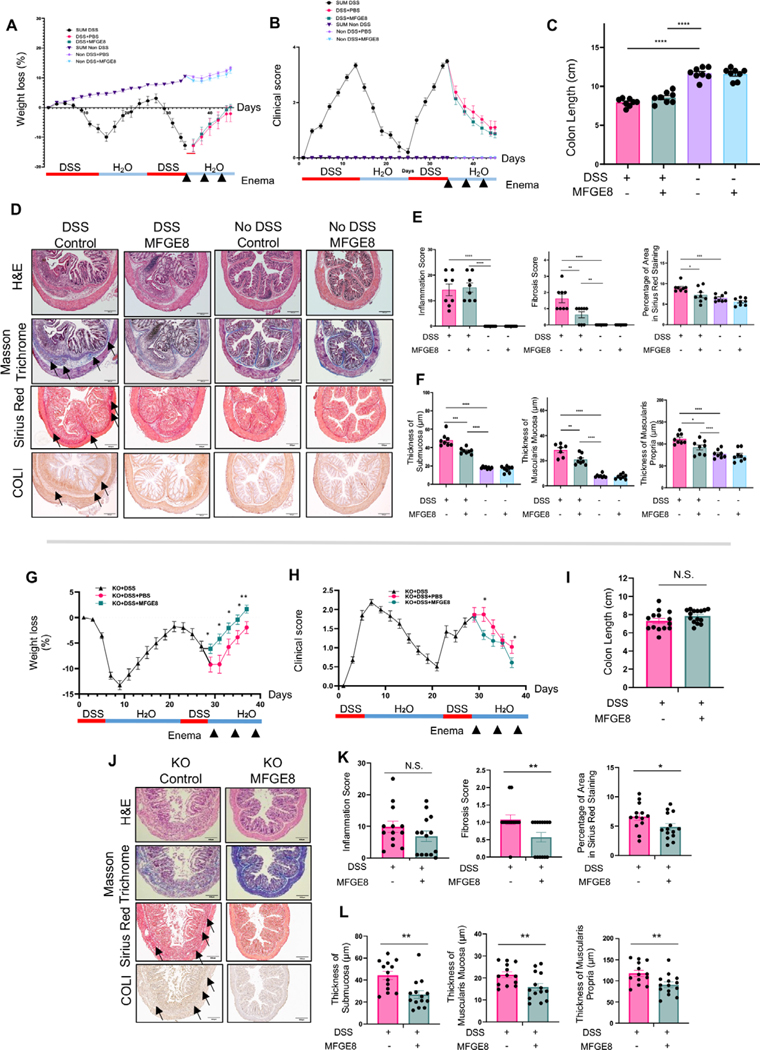
Results: We established and validated an optimal decellularisation protocol for intestinal IBD tissues. Matrisome analysis revealed elevated MFGE8 expression in CD strictured (CDs) tissue, which was confirmed at the mRNA and protein levels. Treatment with MFGE8 inhibited ECM production in normal control HIMF but not CDs HIMF. Next-generation sequencing uncovered functionally relevant integrin-mediated signalling pathways, and blockade of integrin αvβ5 and focal adhesion kinase rendered HIMF non-responsive to MFGE8. MFGE8 prevented and reversed experimental intestinal fibrosis in vitro and in vivo.

Conclusion: MFGE8 displays antifibrotic effects, and its administration may represent a future approach for prevention of IBD-induced intestinal strictures.

Keywords: CROHN'S DISEASE; EXTRACELLULAR MATRIX; FIBROGENESIS; FIBROSIS.


Conflict of interest statement

Competing interests: The Cleveland Clinic receives funds on her behalf from Celgene, Morphic, Pfizer, UCB, GB004 and Helmsley. SDH was consultant to Shionogi, Takeda and Guidepoint and receives research funding from the Crohn’s and Colitis Foundation and the American Society of Colon and Rectal Surgeons. CF receives speaker fees from UCB, Genentech, Sandoz and Janssen, and he is the consultant of Athos Therapeutics, Inc. FR is the consultant of Agomab, Allergan, AbbVie, Boehringer-Ingelheim, Celgene, Cowen, Genentech, Gilead, Gossamer, Guidepoint, Helmsley, Index Pharma, Jansen, Koutif, Metacrine, Morphic, Pfizer, Pliant, Prometheus Biosciences, Receptos, RedX, Roche, Samsung, Takeda, Techlab, Thetis, UCB and 89Bio.

Figures

Figure 1
Figure 1
Matrisome analysis of decellularised intestinal resection tissues from patients with IBD and controls. Mass spectrometry analysis of extracellular matrix (ECM) proteins of different tissue phenotypes was performed, and results were calculated relative to the total amount of ECM. (A) Principal component analysis of the relative abundance of matrisome proteins produced by normal (NL), UC, non-strictured Crohn’s disease (CDns) and strictured Crohn’s disease (CDs). Ellipses indicate 95% CIs. No separation of the matrisome components was noted between NL, UC, CDns and CDs (left graph) as well as between CDns and CDs (right graph; n=27). (B) Proteins detected in each tissue phenotype. Venn diagrams were created using present matrisome components among the four phenotypes. Most matrisome components were expressed by all phenotypes with the only uniquely expressed proteins being delineated next to the Venn diagram (n=27). (C) Unsupervised hierarchical clustering of matrisome proteins (normalised relative abundance) for each phenotype indicating a large qualitative and quantitative overlap of matrisome expression across all phenotypes. The three molecules with differential expression between the phenotypes are marked with red boxes (n=27). (D) Top 25 ECM proteins for each phenotype ranked by level of abundance. The top 5 matrisome proteins across the tissue phenotypes NL, UC, CDns and CDs were collagen VI, fibrillin 1, collagen 1, decorin and perlecan (n=27). (E) Relative abundance of matrisome molecules with significant difference between the phenotypes. The three molecules identified were latent latent transforming growth factor-β binding protein 1, milk fat globule-epidermal growth factor 8 (MFGE8) and von Willebrand Factor (n=27). * indicates a significant difference compared with NL. (F) Immunohistochemistry (IHC) staining for MFGE8 expression in colon tissues identified intestinal epithelial cells as the major source of MFGE8. Slides are representative of n=33. Dotted box inserts represent the magnified areas in the lower row. (G) Immunofluorescence for MFGE8 focusing on the submucosa as the area with the highest ECM expression reveals increased MFGE8 in CDs compared with NL. Slides are representative of n=12. (H) Quantification for MFGE8 expression using a blinded IHC score indicated upregulation of MFGE8 in the epithelium of CDns and CDs compared with NL and in the submucosa of CDs compared with NL (n=33). Right panel depicts automatic quantification of the MFGE8 surface area in the submucosa. (I) Real-time PCR analysis revealed that MFGE8 gene expression was elevated in CDs resection tissues compared with NL (n=36). Data are presented as mean±SEM. *, p<0.05; **, p<0.01. NL, normal; CDs, strictured Crohn’s disease; CDns, non-strictured Crohn’s disease; FGA, fibrinogen-α; FGB, fibrinogen-ß; MFAP5, microfibrillar-associated protein antigen 5; BGN, biglycan; LTBP1, latent transforming growth factor-β binding protein 1; MFGE8, milk fat globule-epidermal growth factor; VWF, von Willebrand Factor; IHC, immunohistochemistry.
Figure 2
Figure 2
Milk fat globule-epidermal growth factor 8 (MFGE8) exerts antifibrotic properties in chronic dextran sodium sulfate (DSS)-induced colitis. (A–G) Chronic DSS colitis was induced in Balb/C mice by two cycles of 3.5% DSS administration and recovery. 3600 ng or recombinant mouse MFGE8 or vehicle control was applied as enema every 4 days starting from the first day of DSS administration. The severity of DSS-induced colitis was evaluated by measuring (A) body weight loss and (B) calculating the clinical score consisting of blood in stool, weight loss and stool consistency. MFGE8 and DSS-treated animals have reduced weight loss and lower clinical score. (C) Colon length was less reduced in MFGE8-treated and DSS-exposed mice compared with DSS alone. (D) Representative images from mouse colon sections stained withH&E, Masson’s trichrome (MT), sirius red (SR), collagen I (COLI), fibronectin (FN) or α-smooth muscle actin (α-SMA). Slides are representative of n=5–8 per group. Arrows point towards the area of fibrosis. (E) Inflammation score was determined by an IBD pathologist in a blinded fashion using H&E sections. There was no difference in DSS-treated animal irrespective of exposure to MFGE8 or not. Fibrosis score as determined by an IBD pathologist in a blinded fashion using MT sections and automatic quantification using SR sections was analysed. MFGE8 reduced the fibrosis score per cent sirius red area in DSS-exposed animals. (F) MFGE8 reduced the per cent positive area for FN and COLI and showed a trend of reduction of α-SMA. (G) MFGE8 reduced the thickness of the submucosa, muscularis mucosa and muscularis propria in DSS-exposed animals. Data are presented as mean±SEM (n=8 per group from two independent experiments). *, p<0.05; **, p<0.01; ***, p<0.001; ****, p<0.0001. DSS, dextran sodium sulfate; MFGE8, milk fat globule-epidermal growth factor 8; PBS, phosphate-buffered saline; α-SMA, α-smooth muscle actin; FN, fibronectin; COLI, collagen I.
Figure 3
Figure 3
Milk fat globule-epidermal growth factor 8 (MFGE8) knockout (KO) mice show increased fibrosis in chronic dextran sodium sulfate (DSS)-induced colitis. (A–F) Chronic DSS colitis was induced in C57/BL6 wild-type (WT) or MFGE8 KO mice by two cycles of 3% DSS administration and recovery (6-day DSS and 13-day recovery). The severity of DSS-induced colitis was evaluated by measuring (A) body weight loss and (B) calculating the clinical score consisting of blood in stool, weight loss and stool consistency. MFGE8 KO mice have higher weight loss and increased clinical score. (C) Colon length was shorter in DSS-exposed KO mice compared with DSS-exposed WT mice. (D) Representative images from mouse colon sections stained with H&E, Masson’s trichrome (MT), sirius red (SR) and collagen I (COLI). Slides are representative of n=14 per DSS groups and n=5 per no DSS groups. Arrows point towards the area of fibrosis. (E) Inflammation score was determined by an IBD pathologist in a blinded fashion using H&E sections. When exposed to DSS, MFGE8 KO mice had a higher inflammation score compared with WT mice. Fibrosis score as determined by an IBD pathologist in a blinded fashion using MT sections and automatic quantification using SR sections was analysed. MFGE8 KO mice had increased fibrosis score and per cent sirius red area in DSS-exposed animals compared with WT mice. (F) MFGE8 KO mouse colons had an increased thickness of the submucosa, muscularis mucosa and muscularis propria in DSS-exposed animals compared with WT mice. Data are presented as mean±SEM (n=15 per DSS group and n=5 per no DSS groups from two independent experiments). *, p<0.05; **, p<0.01; ***, p<0.001. WT, wild type; DSS, dextran sodium sulfate; KO, knockout; COLI, collagen I.
Figure 4
Figure 4
Milk fat globule-epidermal growth factor 8 (MFGE8) shows antifibrotic effects on primary human intestinal myofibroblasts (HIMFs) derived from normal (NL) but not patients with stricturing Crohn’s disease (CD). Primary HIMFs were isolated from freshly resected intestinal tissues from NL, UC, non-strictured CD (CDns) and strictured CD (CDs). (A) Deposition of fibronectin (FN) was measured using an extracellular matrix deposition assay. An increase in FN deposition was noted at baseline between the CDs HIMF and all other phenotypes. On exposure to MFGE8, NL, UC and CDns HIMF reduced FN, but CDs did not (n=3–5 cell lines per group with 5 independent experiments per line). (B–F) NL HIMF exposed to MFGE8 reduced gene expression of α-smooth muscle actin (α-SMA, ACTA2), FN (FN1), collagen I (COLI, COL1A1), COLIII (COL3A1) and FN protein. CD HIMF did not show any response to ACTA2, FN1, COLA1A1 and COL3A1 gene expression by quantitative PCR (qPCR) and FN protein by ELISA. HIMF UC only reduced FN1 gene expression, and CDns reduced ACTA2, FN1 and COL1A1 gene expression in response to MFGE8 (n=5–7 per group). (G–I) HIMF NL reduced cellular protein expression of α-SMA and FN (immunoblot) and COLI (immunocytochemistry), which was not observed in HIMF CDs (n=4–8). *, p<0.05; **, p<0.01; ****, p<0.0001. α-SMA, α-smooth muscle actin; CDs, strictured CD; CDns, non-strictured CDns; COL, collagen; FN, fibronectin; GAPDH, glyceraldehyde-3-phosphate dehydrogenase;MFGE8, milk fat globule-epidermal growth factor 8; NL, normal.
Figure 5
Figure 5
Global gene expression in primary human intestinal myofibroblasts (HIMFs) derived from normal but not patients with stricturing Crohn’s disease (CD) in response to milk fat globule-epidermal growth factor 8 (MFGE8). Primary HIMFs from normal (NL; n=4) or stricture CD (CDs; n=3) were exposed to 500 ng/mL MFGE8 or left untreated for 12 hours prior to undergoing unbiased global gene expression by next-generation sequencing. (A) Annotated volcano plot with upregulated (left) and downregulated (right) genes on exposure to MFGE8. Significant genes are depicted in red. (B) Significantly upregulated (top) and downregulated (bottom) gene exposure of HIMF to MFGE8 for NL and CDs. (C) Top 30 regulated genes—upregulated (blue) and downregulated (red) genes—on exposure of HIMF to MFGE8. (D) Pathway enrichment analysis comparing differential gene expression in HIMF NL and CDs exposed to MFGE8 reveals induction of pathways associated with cell adhesion and proliferation, chemotaxis and extracellular matrix-integrin interactions. NL, normal; CDs, strictured Chron’s disease; MFGE8, milk fat globule-epidermal growth factor 8; ECM, extracellular matrix.
Figure 6
Figure 6
Milk fat globule-epidermal growth factor 8 (MFGE8) exerted antifibrotic effects on primary human intestinal myofibroblasts (HIMFs) through focal adhesion kinase (FAK) pathway and integrin αvβ5. (A) Immunoblot analysis of FAK activation in normal (NL) and Chron’s disease stricture (CDs) primary HIMF exposed to 500 ng/mL MFGE8 for 1 hour. NL HIMF but not CDs HIMF reduced phosphorylation of FAK (n=4–6 per group). The experiments were not designed to quantitatively compare baseline FAK/pFAK between NL and CDs. (B) Gene expression of HIMF NL for α-smooth muscle actin (α-SMA, ACTA2), fibronectin (FN1) and collagen I, (COLI, COL1A1) untreated or after exposure to MFGE8 for 12 hours in the presence or absence of a FAK phosphorylation inhibitor. Inhibition of FAK phosphorylation reduced the baseline expression of ACTA2, FN1 and COL1A1 and rendered HIMF NL non-responsive to MFGE8 (n=6 per group). (C) Protein expression of HIMF NL for FN untreated or after exposure to MFGE8 for 48 hours in the presence or absence of a FAK phosphorylation inhibitor. Inhibition of FAK phosphorylation reduced the baseline expression of FN and rendered HIMF NL non-responsive to MFGE8 (n=5 per group). (D) Gene expression of integrins αv, β3 and β5 in HIMF NL and HIMF CDs. HIMF CDs showed a lower expression of integrins αv and β5 but not β3 (n=6 per group). (E) Immunofluorescence of integrin αvβ5 in HIMF. NL and HIMF CDs. HIMF CDs showed a lower expression of integrin αvβ5 (n=6). (F) Immunohistochemistry of integrin β5 in freshly resected intestinal tissues. Integrin β5 expression was reduced in CDs compared with NL and non-strictured CD (CDns) (n=5 per group) (G) Gene expression of HIMF NL for ACTA2, FN1 and COL1A1 untreated or after exposure to MFGE8 for 12 hours in the presence or absence of a small interfering RNA (siRNA) targeting integrin αv or β5. Inhibition of integrin αv or β5 rendered HIMF NL non-responsive to MFGE8 (n=5 per group). (G) Protein expression of HIMF NL for FN untreated or after exposure to MFGE8 for 48 hours in the presence or absence of siRNA targeting integrin αv or β5. Inhibition of integrin αv or β5 rendered HIMF NL non-responsive to MFGE8 (n=6 per group). *, p<0.05; **, p<0.01; ***, p<0.001; ****, p<0.0001. NS: not significant. HIMF, human intestinal myofibroblast; NL, normal; CDs, strictured Chron’s disease; FAK, focal adhesion kinase; FN, fibronectin; COL, collagen; siRNA, small interfering RNA; MFGE8, milk fat globule-epidermal growth factor 8; siRNA, small interfering RNA.
Figure 7
Figure 7
Milk fat globule-epidermal growth factor 8 (MFGE8) reverses fibrosis but does not affect inflammation in chronic dextran sodium sulfate (DSS)-induced colitis. (A–F) Chronic DSS colitis was induced in Balb/C mice by two cycles of 3.5% DSS administration and recovery. 3600 ng or recombinant mouse MFGE8 or vehicle control was applied as enema every 4 days starting from the end of the second cycle of DSS administration (therapeutic administration in already established fibrosis). The severity of DSS-induced colitis was evaluated by measuring (A) body weight loss and (B) the clinical score consisting of blood in stool, weight loss and stool consistency. The therapeutic administration of MFGE8 did not affect weight loss and clinical score. (C) Colon length was not changed in MFGE8-treated and DSS-exposed mice compared with DSS alone. (D) Representative images from mouse colon sections stained with H&E, Masson’s trichrome (MT), sirius red (SR) and collagen I (COLI). Slides are representative of n=8 per group. Arrows point towards the area of fibrosis. (E) Inflammation score was determined by an IBD pathologist in a blinded fashion using H&E sections. There was no difference in DSS-treated animal irrespective of exposure to MFGE8 or not. Fibrosis score as determined by an IBD pathologist in a blinded fashion using MT sections and automatic quantification using SR sections was analysed. MFGE8 reduced the fibrosis score and per cent Sirius red area in DSS-exposed animals. (F) MFGE8 reduced the thickness of the submucosa, muscularis mucosa and muscularis propria in DSS-exposed animals. Data are presented as mean±SEM (n=8 per group from two independent experiments). *, p<0.05; **, p<0.01; ***, p<0.001; ****, p<0.0001. Next, chronic DSS colitis was induced in MFGE8 knockout (KO) mice by two cycles of 3% DSS administration and recovery. 3600 ng mg of recombinant MFGE8 or vehicle control was applied as enema every 4 days starting from the end of the second cycle of DSS administration (MFGE8 rescue in already established fibrosis). The severity of DSS-induced colitis was evaluated by measuring (G) body weight loss and (H) calculating the clinical score consisting of blood in stool, weight loss and stool consistency. MFGE8 KO mouse receiving MFGE8 has a lower weight loss and improved clinical score. (I) Colon length in MFGE8 KO mice was not different when MFGE8 was administered. (J) Representative images from mouse colon sections stained with H&E, MT, SR and COLI. Slides are representative of n=14 per group. (K) Inflammation score was determined by an IBD pathologist in a blinded fashion using H&E sections. When exposed to MFGE8, MFGE8 KO mice showed no difference in inflammation score compared with untreated mice. Fibrosis score as determined by an IBD pathologist in a blinded fashion using MT sections and automatic quantification using SR sections was analysed. MFGE8 administration to MFGE8 KO mice reduced the fibrosis score and per cent sirius red area compared with untreated MFGE8 KO mice. (L) MFGE8 KO mice receiving MFGE8 had a reduced thickness of the submucosa, muscularis mucosa and muscularis propria compared with untreated MFGE8 KO mice. Data are presented as mean±SEM (n=14 per group from two independent experiments). (M) Integrin β5 on immunohistochemistry is increased in chronic DSS fibrosis compared with no DSS (n=5 per group). *, p<0.05; **, p<0.01; ***, p<0.001; ****, p<0.0001. DSS, dextran sodium sulfate; MFGE8, milk fat globule-epidermal growth factor 8; PBS, phosphate-buffered saline; COLI, collagen I; NS, not significant.

Comment in

References

    1. Rieder F, Fiocchi C, Rogler G. Mechanisms, management, and treatment of fibrosis in patients with inflammatory bowel diseases. Gastroenterology 2017;152:340–50. - PMC - PubMed
    1. Li J, Mao R, Kurada S, et al. Pathogenesis of fibrostenosing Crohn’s disease. Transl Res 2019;209:39–54. - PubMed
    1. Latella G, Rieder F. Intestinal fibrosis: ready to be reversed. Curr Opin Gastroenterol2017;33:239–45. - PMC - PubMed
    1. Lin S-N, Mao R, Qian C, et al. Development of antifibrotic therapy for stricturing Crohn’s disease: lessons from randomized trials in other fibrotic diseases. Physiol Rev 2022;102:605–52. - PMC - PubMed
    1. Karsdal MA, Nielsen SH, Leeming DJ, et al. The good and the bad collagens of fibrosis - their role in signaling and organ function. Adv Drug Deliv Rev 2017;121:43–56. - PubMed

Publication types