. 2024 Feb 21;23(1):39.
doi: 10.1186/s12943-024-01954-8.

Resistance of HNSCC cell models to pan-FGFR inhibition depends on the EMT phenotype associating with clinical outcome

Affiliations

Resistance of HNSCC cell models to pan-FGFR inhibition depends on the EMT phenotype associating with clinical outcome

Felix Broghammer et al. Mol Cancer. .

Abstract

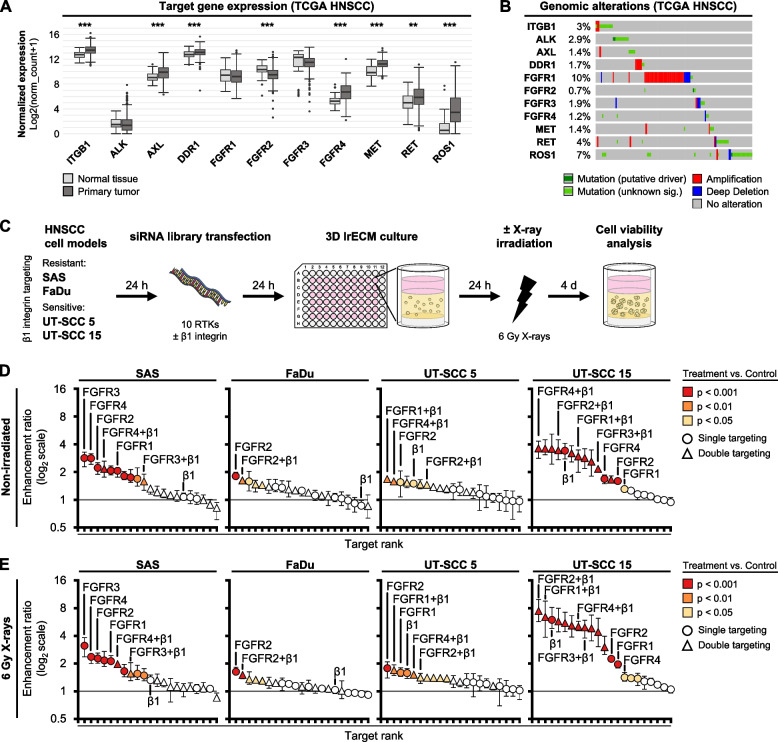
Background: Focal adhesion signaling involving receptor tyrosine kinases (RTK) and integrins co-controls cancer cell survival and therapy resistance. However, co-dependencies between these receptors and therapeutically exploitable vulnerabilities remain largely elusive in HPV-negative head and neck squamous cell carcinoma (HNSCC).

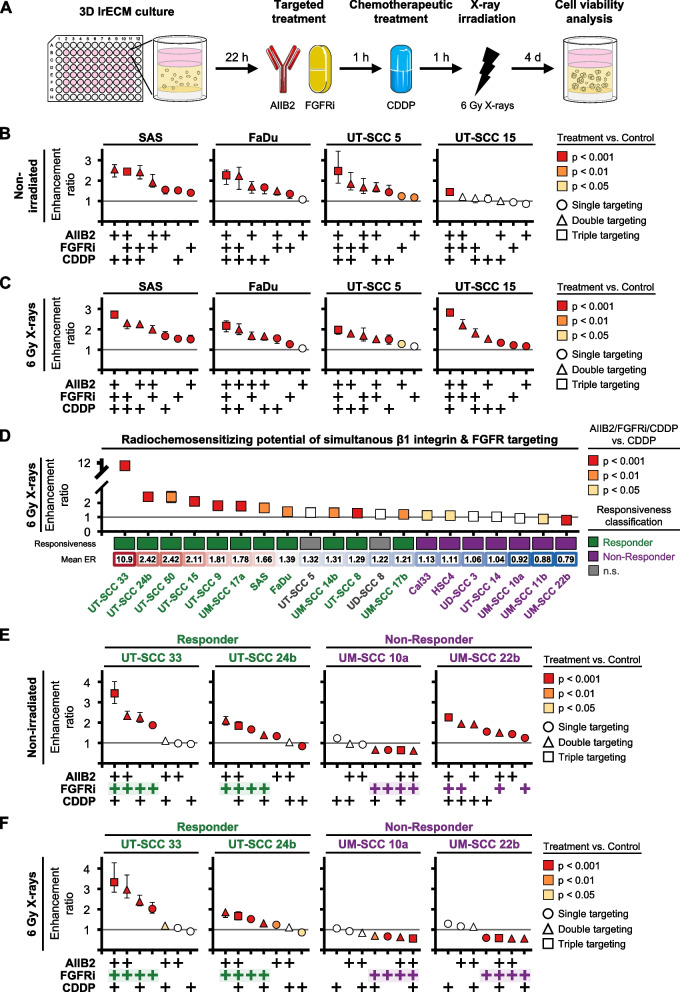
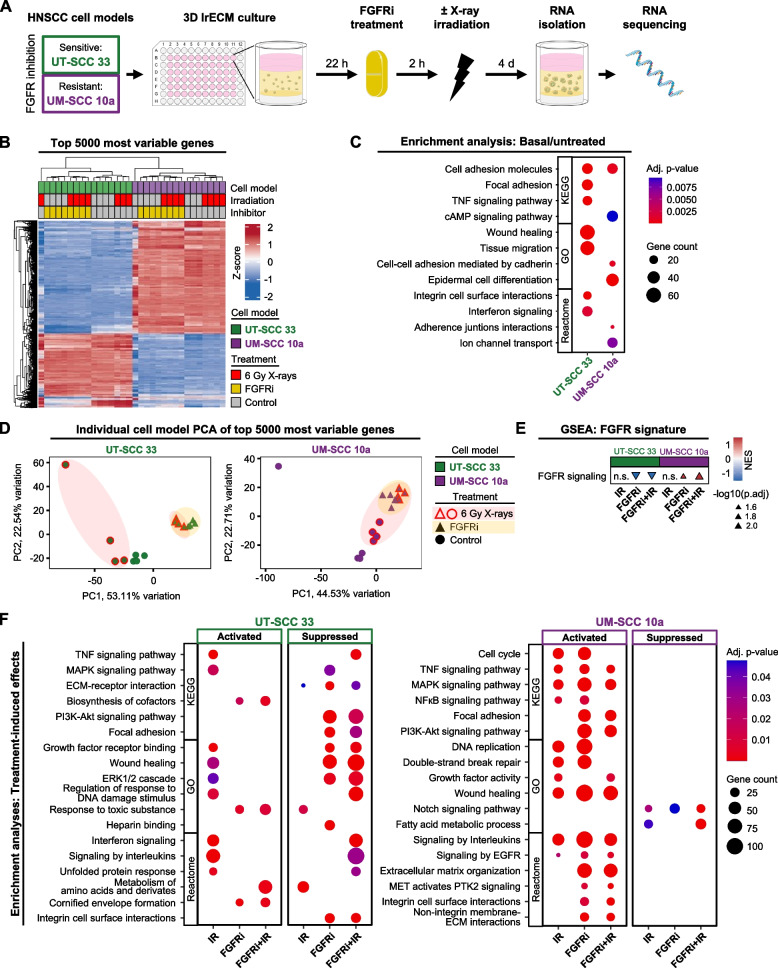
Methods: The cytotoxic and radiochemosensitizing potential of targeting 10 RTK and β1 integrin was determined in up to 20 3D matrix-grown HNSCC cell models followed by drug screening and patient-derived organoid validation. RNA sequencing and protein-based biochemical assays were performed for molecular characterization. Bioinformatically identified transcriptomic signatures were applied to patient cohorts.

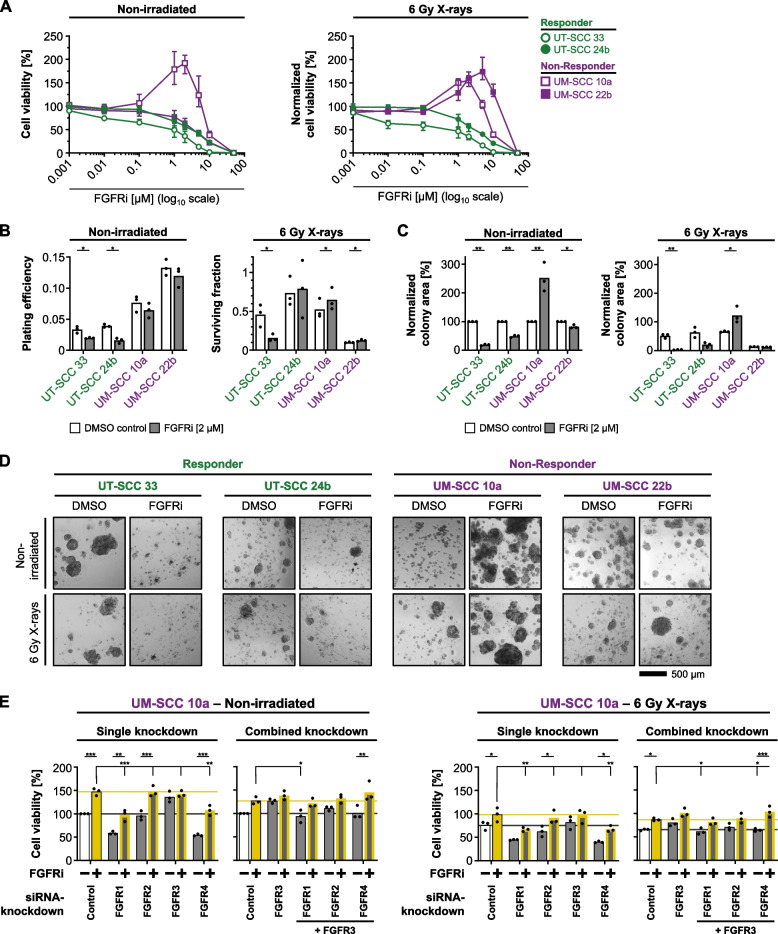
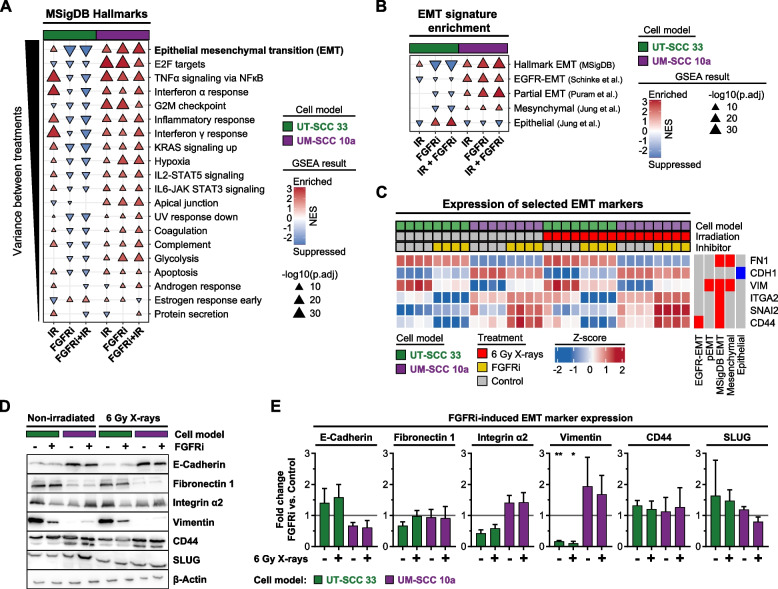
Results: Fibroblast growth factor receptor (FGFR 1-4) targeting exhibited the strongest cytotoxic and radiosensitizing effects as monotherapy and combined with β1 integrin inhibition, exceeding the efficacy of the other RTK studied. Pharmacological pan-FGFR inhibition elicited responses ranging from cytotoxicity/radiochemosensitization to resistance/radiation protection. RNA sequence analysis revealed a mesenchymal-to-epithelial transition (MET) in sensitive cell models, whereas resistant cell models exhibited a partial epithelial-to-mesenchymal transition (EMT). Accordingly, inhibition of EMT-associated kinases such as EGFR caused reduced adaptive resistance and enhanced (radio)sensitization to FGFR inhibition cell model- and organoid-dependently. Transferring the EMT-associated transcriptomic profiles to HNSCC patient cohorts not only demonstrated their prognostic value but also provided a conclusive validation of the presence of EGFR-related vulnerabilities that can be strategically exploited for therapeutic interventions.

Conclusions: This study demonstrates that pan-FGFR inhibition elicits a beneficial radiochemosensitizing and a detrimental radioprotective potential in HNSCC cell models. Adaptive EMT-associated resistance appears to be of clinical importance, and we provide effective molecular approaches to exploit this therapeutically.

Keywords: Adaptive resistance; Epidermal growth factor receptor; Epithelial-to-mesenchymal transition; Fibroblast growth factor receptor; HNSCC; Radioprotection; Radiosensitization; β1 integrin.


Conflict of interest statement

The authors declare no competing interests.

Figures

Fig. 1
Fig. 1
RNAi cell viability screen identifies FGF-receptors as potent cytotoxic and radiosensitizing targets for HNSCC cell models with and without simultaneous β1 integrin targeting. A Gene expression analysis of 10 selected, clinically relevant RTK with available FDA-approved drugs (Table S2) in HPV-negative HNSCC patients of the TCGA cohort. Data of normalized primary tumor (n = 415) and normal tissues (n = 44) were compared using unpaired t test (***p ≤ 0.001, **p ≤ 0.01). B OncoPrint of target gene alterations in HPV-negative HNSCC patients of the TCGA cohort (n = 415). Percentage indicates the proportion of patients with genetic alterations. Only data of patients with alterations are shown. C Workflow of RNAi cell viability screen in 3D lrECM (laminin-rich extracellular matrix) HNSCC cell models. Images were partly adapted from Servier Medical Art by Servier, licensed under a Creative Commons Attribution 3.0 Unported License. D Enhancement ratios (ER) of cell viability of 3D lrECM HNSCC models upon single or double siRNA-mediated knockdowns of 10 RTK and β1 integrin (labeled as β1). ER and statistics are derived from corresponding cell viability data (Fig. S2A) and presented as mean ± range (n = 3; two-way ANOVA; Dunnett’s multiple comparison test to corresponding controls). E ER of cell viability of 6 Gy X-ray irradiated 3D lrECM HNSCC models upon single or double knockdowns of 10 RTK and β1 integrin. ER and statistics are derived from the corresponding cell viability data (Fig. S2B) and presented as mean ± range (n = 3; two-way ANOVA; Dunnett’s multiple comparison test to corresponding irradiated controls)
Fig. 2
Fig. 2
Pharmacological FGFR/β1 integrin inhibition plus Cisplatin induces a broad, sensitizing-to-resistant viability spectrum in irradiated 3D HNSCC cell models. A Workflow of drug cell viability screen in 3D lrECM HNSCC cell models upon treatment using anti-β1-integrin mAb (AIIB2; 20 µg/ml), pan-FGFR inhibitor (Erdafitinib, FGFRi; 2 µM) and Cisplatin (CDDP; 0.5 µM) with or without single 6 Gy X-ray irradiation. Images were partly adapted from Servier Medical Art by Servier, licensed under a Creative Commons Attribution 3.0 Unported License. B Enhancement ratios (ER) of cell viability responses of indicated cell models to single, double and triple applications of AIIB2, FGFRi and CDDP. DMSO/IgG were used as controls. ER and statistics are derived from the corresponding cell viability data (Fig. S3A) and presented as mean ± range (n = 3, two-way ANOVA, Dunnett’s multiple comparison test to corresponding controls). C ER of cell viability responses of indicated 6 Gy X-ray irradiated cell models to single, double and triple applications of AIIB2, FGFRi and CDDP. DMSO/IgG were used as control. ER and statistics are derived from the corresponding cell viability data (Fig. S3B) and presented as mean ± range (n = 3; two-way ANOVA; Dunnett’s multiple comparison test to corresponding irradiated controls). D ER of cell viability responses of 20 indicated cell models comparing the triple combination AIIB2, FGFRi and CDDP to the corresponding single CDDP treatments with a single dose of 6 Gy X-ray irradiation. The adapted ER (AIIB2/FGFRi/CDDP vs. CDDP) and statistics are derived from corresponding cell viability data (Fig. S3D) and presented as mean ± range (Two-way ANOVA; Tukey multiple comparison test; ***p ≤ 0.001, **p ≤ 0.01, *p ≤ 0.05, n.s. p > 0.05). E ER of cell viability responses of indicated cell models to the single, double or triple combination with AIIB2, FGFRi and CDDP. DMSO/IgG were used as control. ER and statistics are derived from the corresponding cell viability data (Fig. S4A) and presented as mean ± range (n = 3; two-way ANOVA; Dunnett’s multiple comparison test to corresponding controls). F ER of cell viability responses of indicated cell models to the single, double or triple combination of AIIB2, FGFRi and CDDP plus 6 Gy X-ray irradiation. DMSO/IgG were used as control. ER and statistics are derived from the corresponding cell viability data (Fig. S4B) and presented as mean ± range (n = 3; two-way ANOVA; Dunnett’s multiple comparison test to corresponding irradiated controls)
Fig. 3
Fig. 3
Pharmacological FGFR inhibition elicits Janus-faced response patterns in non-irradiated and irradiated 3D lrECM HNSCC models. A Mean cell viability (± range) of cell models to indicated FGFRi concentrations (n = 3) at non-irradiated (left panel) or 6 Gy X-ray irradiated (right panel) conditions. Normalization was performed to corresponding non-irradiated/irradiated controls. B Plating efficiencies and surviving fractions of indicated cell models treated with FGFRi with or without a single dose of 6 Gy X-rays based on the colony number counts (n = 3; mean ± range; paired t-test; *p ≤ 0.05). C Normalized colony area of indicated cell models treated with FGFRi. The absolute area was normalized to the mean of the corresponding non-irradiated control (n = 3; mean ± range; paired t-test; **p ≤ 0.01, *p ≤ 0.05). D Representative focus stacked bright-field images of colony formation assays of 3D lrECM HNSCC cell models exposed to FGFRi (DMSO used as control) plus/minus 6 Gy X-ray irradiation. E Cell viability of 3D lrECM grown UM-SCC 10a cells upon single or double siRNA-mediated knockdowns of indicated genes under non-irradiated and 6 Gy X-ray irradiated conditions (n = 3; mean; two-way ANOVA; Tukey multiple comparison test; ***p ≤ 0.001, **p ≤ 0.01, *p ≤ 0.05). Non-targeting siRNAs were used as control
Fig. 4
Fig. 4
The transcriptomic landscape of FGFRi sensitive and resistant HNSCC cell models differs profoundly. A Workflow of RNA-sequencing analysis in 3D lrECM HNSCC cell models upon FGFRi treatment (2 µM; DMSO as control) with or without single 6 Gy X-ray irradiation. Images were partly adapted from Servier Medical Art by Servier, licensed under a Creative Commons Attribution 3.0 Unported License. B Heatmap of 5000 most variable expressed genes between all treated and control samples. Columns represent biological replicates (n = 4), rows represent z-score normalized gene expression data, both hierarchically clustered. C Overrepresentation analyses of strongly differential expressed genes (DEG, log2FC ≥|2|) between UT-SCC 33 and UM-SCC 10a cell models at basal/untreated conditions. Selected functional enrichments of individual database analyses (KEGG, GO, Reactome) are presented by gene counts and adjusted p-values. Complete results are listed in Table S3. D Principal component analysis of the top 5000 most variably expressed genes in each cell model upon indicated treatment conditions. Colored ellipses outline directions of treatment-induced transcriptomic shifts compared to controls. E Normalized enrichment score (NES) summary of six gene set enrichment analyses (GSEA) for the FGFR signaling signature (Table S3) in each DEG comparison group (IR, 6 Gy X-ray irradiated; FGFRi, FGFR inhibitor treatment; FGFRi/IR, combined treatment). Significance levels (p.adj, adjusted p-value ≤ 0.05; n.s., non-significant) are indicated by triangle size. Triangle direction represents enrichment or suppression in the corresponding DEG comparison group. F Functional characterization of treatment-induced effects between the DEG comparison groups (IR; FGFRi; FGFRi/IR) for each cell model. All DEG (adjusted p-value ≤ 0.05) were included. Selected functional enrichments of individual database analyses (KEGG, GO, Reactome) are presented by gene counts and adjusted p-values. Complete results are listed in Table S3
Fig. 5
Fig. 5
The EMT profile is altered most strongly and in opposite directions in sensitive versus resistant HNSCC cell models after FGFR inhibition. A Normalized enrichment score (NES) summary of six gene set enrichment analyses (GSEA) for MSigDB hallmark gene sets. Top 20 hallmarks with the highest variance between DEG comparison groups (n = 4; IR, 6 Gy X-ray irradiated; FGFRi, FGFR inhibitor treatment; FGFRi/IR, combined treatment) are depicted. Significance levels (p.adj, adjusted p-value ≤ 0.05) are indicated by triangle size. Triangle direction represents enrichment or suppression in the corresponding DEG comparison group per cell model. B NES summary graph of multiple GSEA of indicated HNSCC-related EMT gene sets (Table S3) in each DEG comparison group of both cell models. Significance levels (adjusted p-value ≤ 0.05) are indicated by triangle size. Triangle direction represents enrichment or suppression in the corresponding DEG comparison group. C Expression heatmap of selected EMT marker genes in both cell models. Genes are annotated by their corresponding HNSCC gene signatures (Table S3). Columns represent individual biological replicates; rows are clustered hierarchically. D Western blot analysis of selected EMT marker proteins from whole cell lysates of 3D lrECM grown cell models upon indicated treatments. β-actin served as loading control. Representative blots are shown. Where indicated, cells were treated with 2 µM FGFRi (DMSO was used as control). E Densitometric analyses of EMT marker expression shown in ‘D’. Mean fold changes (± standard deviation; n = 3) compared to corresponding non-irradiated/irradiated controls are shown. All samples were normalized to their corresponding β-actin loading control (Two-way ANOVA utilizing normalized densitometry data, Tukey multiple comparison test, **p ≤ 0.01; *p ≤ 0.05)
Fig. 6
Fig. 6
Pharmacological inhibition of specific EMT-associated kinases reduces FGFRi-induced resistance. A Drug cell viability screen in non-irradiated (left panel) and irradiated (right panel) UM-SCC 10a cells upon monotherapy with selected kinase inhibitors alone (y-axis) versus dual therapy with selected kinase inhibitors plus FGFRi (x-axis). Corresponding annotated cell viability data are presented in Fig. S8 (n = 3; two-way ANOVA; Dunnett’s multiple comparison test to corresponding single FGFRi treatment). B Venn diagram of significant kinase inhibitor effectiveness shown in Fig. 6A (right panel). Underlying data and statistics are presented in Fig. S8. C Effects on cell viabilities of irradiated UM-SCC 10a cells upon exposure to concentration-optimized kinase inhibitors listed in Fig. 6B. The inhibitors RSKi and EGFR_2 were added to the panel (inhibitor names, cell viability data of non-irradiated cells and applied concentrations are displayed in Fig. S9A). Bars and bottom annotation table display mean cell viability (n = 3; two-way ANOVA; Tukey multiple comparison test; ***p ≤ 0.001, **p ≤ 0.01, *p ≤ 0.05). D Representative focus-stacked images of colony formation of 3D lrECM UM-SCC 10a cell cultures upon indicated treatments. Quantitative analysis is presented in Fig. S9B-C. E Comparative testing of cell viability in one FGFRi sensitive versus three FGFRi resistant 3D HNSCC cell models upon indicated mono- and combination treatments relative to corresponding controls (inhibitor names, cell viability data of non-irradiated cells and applied concentrations are displayed in Fig. S10A; cell viability data of irradiated cells normalized to non-irradiated controls are shown in Fig. S10B). Bars represent mean cell viability (n = 3; two-way ANOVA; Tukey multiple comparison test; ***p ≤ 0.001, **p ≤ 0.01). ‘S’ indicates synergy calculated by the Bliss independence model. F Comparison of FGFRi responsiveness in 3D lrECM cell models and HNSCC organoids in absence and presence of 6 Gy X-rays. Bars represent mean enhancement ratio of three biological replicates per cell model (2 µM FGFRi) and six technical replicates per organoid (1.5 µM FGFRi). Corresponding cell viability data are listed in Fig. S3A-B and Fig. S4A-B for cell models and Fig. S11B-C for HNSCC organoids. G Combinatory effectiveness plots of three kinase inhibitors (EGFRi, PAK1-3i, PKCi) together with FGFRi in indicated HNSCC organoids. Results are presented according to the highest-single agent (HSA) combination index, where scores > 1 indicate a potential additive to synergistic effect. Corresponding cell viability data are shown in Fig. S11B-C
Fig. 7
Fig. 7
In vitro resistance signatures predict clinical outcome and clinically relevant target genes in HNSCC patient cohorts. A Workflow of defining clinical outcome and clinically relevant targets identified in the FGFRi-induced adaptive resistance response in UM-SCC 10a cells. Images were partly adapted from Servier Medical Art by Servier, licensed under a Creative Commons Attribution 3.0 Unported License. B Stratification of HPV-negative HNSCC patients from the training cohort (TCGA, n = 280 patients with available clinical endpoints and target gene expression) with the indicated signature-based risk scores (median cut-off) for overall (OS) and progression-free survival (PFS). Hazard ratios of high-risk patients (red curves) and log-rank test p-values for the comparison of high- and low-risk groups are indicated together with 95% confidence intervals in Kaplan–Meier curves including patient numbers at risk. Signature genes and coefficients are listed in Table S3. C Radiotherapy-treated (RT) and non-RT subcohorts of the HPV-negative HNSCC training cohort (RT, n = 181 patients; non-RT, n = 99 patients) are stratified with the PFS signature-based risk score (median cut-off) for PFS. Hazard ratios of high-risk patients (red curves) and log-rank test p-values for the comparison of high- and low-risk groups are indicated together with 95% confidence intervals in Kaplan–Meier curves including patient numbers at risk. D Spearman correlations of derived pathway activities with the corresponding expression of OS/PFS signature genes in either HPV-negative HNSCC TCGA patients (left; n = 415) or single HNSCC cells (right; n = 1891 cells from n = 10 patients; GSE103322; scRNA, single cell RNA-sequencing). Correlations are hierarchically clustered and annotated with adjusted p-values for correlation significance (***p ≤ 0.001, **p ≤ 0.01, *p ≤ 0.05). E Interaction network of OS and PFS signature genes and kinase inhibitor targets. STRING database was used to discover interconnections between the targets of identified resistance-overcoming kinase inhibitors (see Fig. 6C) and predicted functional partners. The evidence color key for protein- and gene-level connections is indicated. F Interaction network of OS and PFS signature genes and kinase inhibitor targets. GeneMania database was applied to uncover interconnections between the targets of identified resistance-overcoming kinase inhibitors (see Fig. 6C) in radial layout. Evidence color key for pathway, protein- and gene-level connections is shown
Fig. 8
Fig. 8
EGFR signaling essentially contributes to the protective FGFRi-induced resistance response. A Pathway activity inference derived from the three DEG comparison groups (IR, 6 Gy X-rays; FGFRi, FGFR inhibitor; FGFRi/IR, FGFR inhibitor plus 6 Gy X-rays) per cell model (n = 4) using PROGENy. Rows are clustered hierarchically. B Western blots of phosphorylated EGFR (Y1173) and ERK1/2 (Thr202/Tyr204) in whole cell lysates from 3D lrECM cell models treated as indicated. Vinculin served as loading control. Representative blots are shown. C Densitometric analysis of western blot results shown in ‘B’. Mean fold changes (± standard deviation) compared to corresponding non-irradiated/irradiated control are shown (n = 3). (Two-way ANOVA utilizing normalized densitometry data, Tukey multiple comparison test, ***p ≤ 0.001). D 24-h time kinetic of indicated EGFR phosphoforms in whole cell lysates from treated 3D lrECM UM-SCC 10a cell cultures. Vinculin served as loading control. Representative blots are shown. E Densitometric analysis of western blot data shown in ‘D’. Mean fold changes (± standard deviation) compared to the corresponding control are shown (n = 3). F Cell viability of CRISPR/Cas9-mediated EGFR-knockout cells (ko1, ko2) and corresponding controls after FGFRi treatment under non-irradiated and 6 Gy X-ray irradiated conditions. Bars represent mean cell viability (n = 3; two-way ANOVA; Tukey multiple comparison test; ***p ≤ 0.001, **p ≤ 0.01, *p ≤ 0.05). G Cell viabilities of UM-SCC 10a EGFR-knockout cells (ko1) reconstituted with either EGFR wild-type (wt) or kinase-dead (kd) constructs upon FGFRi treatment under non-irradiated and 6 Gy X-ray irradiated conditions. Parental cells and empty-vector-transduced cells were used as controls. Bars represent mean cell viability (n = 2). H Cell viability of UM-SCC 10a cells upon siRNA-mediated knockdown of indicated target genes alone or in combination with FGFRi treatment. Bars represent mean cell viability (n = 3; two-way ANOVA; Tukey multiple comparison test; ***p ≤ 0.001, **p ≤ 0.01, *p ≤ 0.05). Non-targeting siRNAs and DMSO were used as controls. I Effectiveness plot of adapter protein RNAi screen shown in ‘G’ (y-axis: cell viability; derived from Fig. 8G; x-axis: EGFR (Y1173) phosphorylation; derived from Fig. S15C, grey bars). Respective ratios to corresponding controls were calculated and -log2 transformed

Similar articles

Cited by

References

    1. Johnson DE, Burtness B, Leemans CR, Lui VWY, Bauman JE, Grandis JR. Head and neck squamous cell carcinoma. Nat Rev Dis Prim 2020 61. 2020 [cited 2023 Aug 1];6:1–22. Available from: https://www.nature.com/articles/s41572-020-00224-3 - PMC - PubMed
    1. Cramer JD, Burtness B, Le QT, Ferris RL. The changing therapeutic landscape of head and neck cancer. Nat Rev Clin Oncol 2019 1611. 2019 [cited 2023 Aug 2];16:669–83. Available from: https://www.nature.com/articles/s41571-019-0227-z - PubMed
    1. Vasan N, Baselga J, Hyman DM. A view on drug resistance in cancer. Nat 2019 5757782. 2019 [cited 2022 Dec 8];575:299–309. Available from: https://www.nature.com/articles/s41586-019-1730-1 - PMC - PubMed
    1. Dickreuter E, Cordes N. The cancer cell adhesion resistome: mechanisms, targeting and translational approaches. Biol Chem. 2017;398:721–735. doi: 10.1515/hsz-2016-0326. - DOI - PubMed
    1. Huang C, Chen L, Savage SR, Eguez RV, Dou Y, Li Y, et al. Proteogenomic insights into the biology and treatment of HPV-negative head and neck squamous cell carcinoma. Cancer Cell. 2021 [cited 2023 Aug 2];39:361–379.e16. Available from: http://www.cell.com/article/S1535610820306553/fulltext - PMC - PubMed

Publication types

MeSH terms