. 2024 Feb 20;13(1):19.
doi: 10.1186/s40164-024-00489-4.

Low-dose hypomethylating agents cooperate with ferroptosis inducers to enhance ferroptosis by regulating the DNA methylation-mediated MAGEA6-AMPK-SLC7A11-GPX4 signaling pathway in acute myeloid leukemia

Affiliations

Low-dose hypomethylating agents cooperate with ferroptosis inducers to enhance ferroptosis by regulating the DNA methylation-mediated MAGEA6-AMPK-SLC7A11-GPX4 signaling pathway in acute myeloid leukemia

Shuya Feng et al. Exp Hematol Oncol. .

Abstract

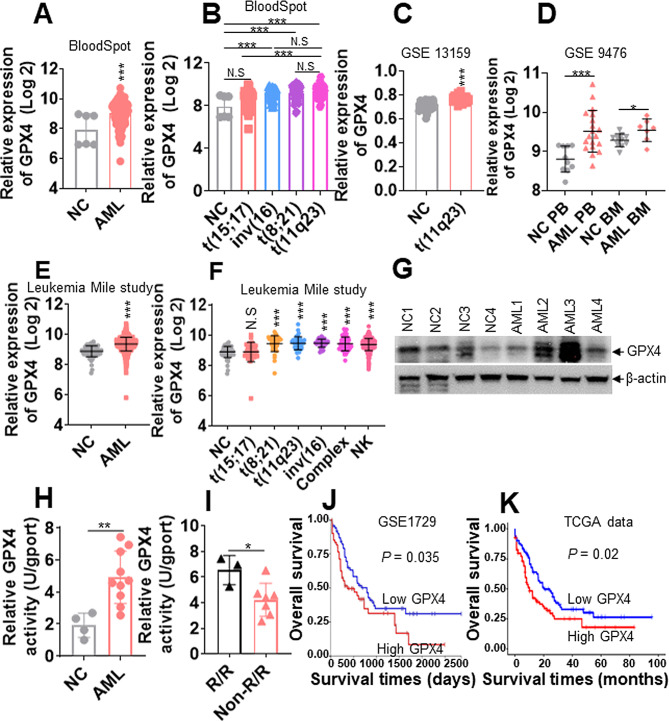
Background: Ferroptosis is a new form of nonapoptotic and iron-dependent type of cell death. Glutathione peroxidase-4 (GPX4) plays an essential role in anti-ferroptosis by reducing lipid peroxidation. Although acute myeloid leukemia (AML) cells, especially relapsed and refractory (R/R)-AML, present high GPX4 levels and enzyme activities, pharmacological inhibition of GPX4 alone has limited application in AML. Thus, whether inhibition of GPX4 combined with other therapeutic reagents has effective application in AML is largely unknown.

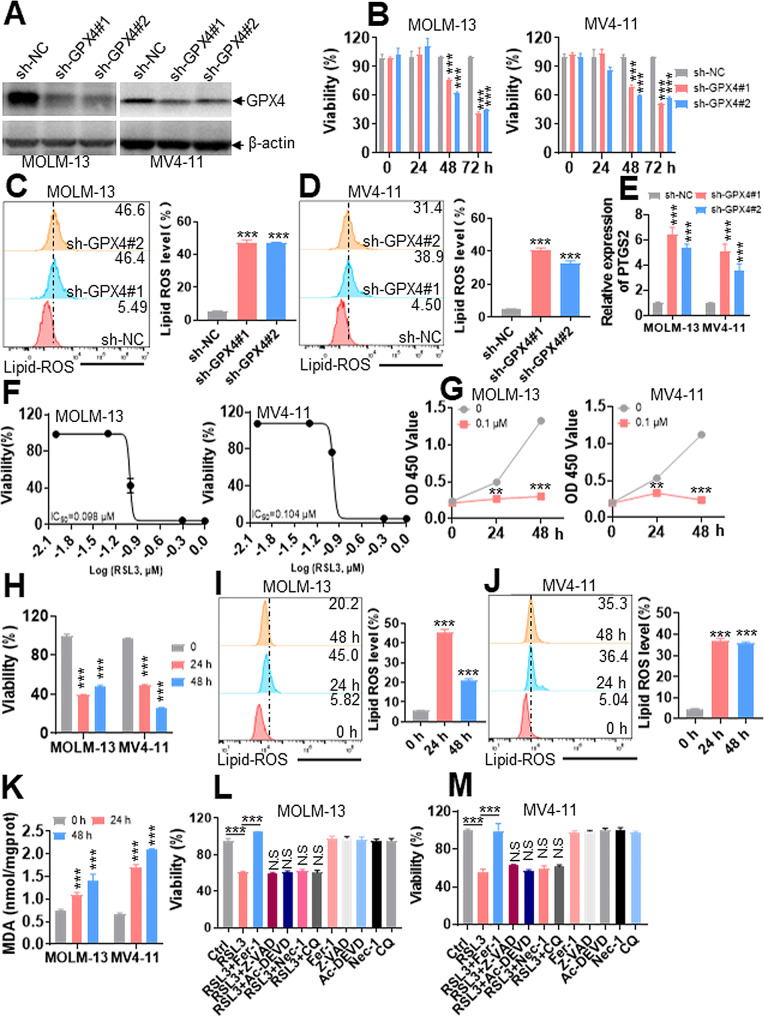
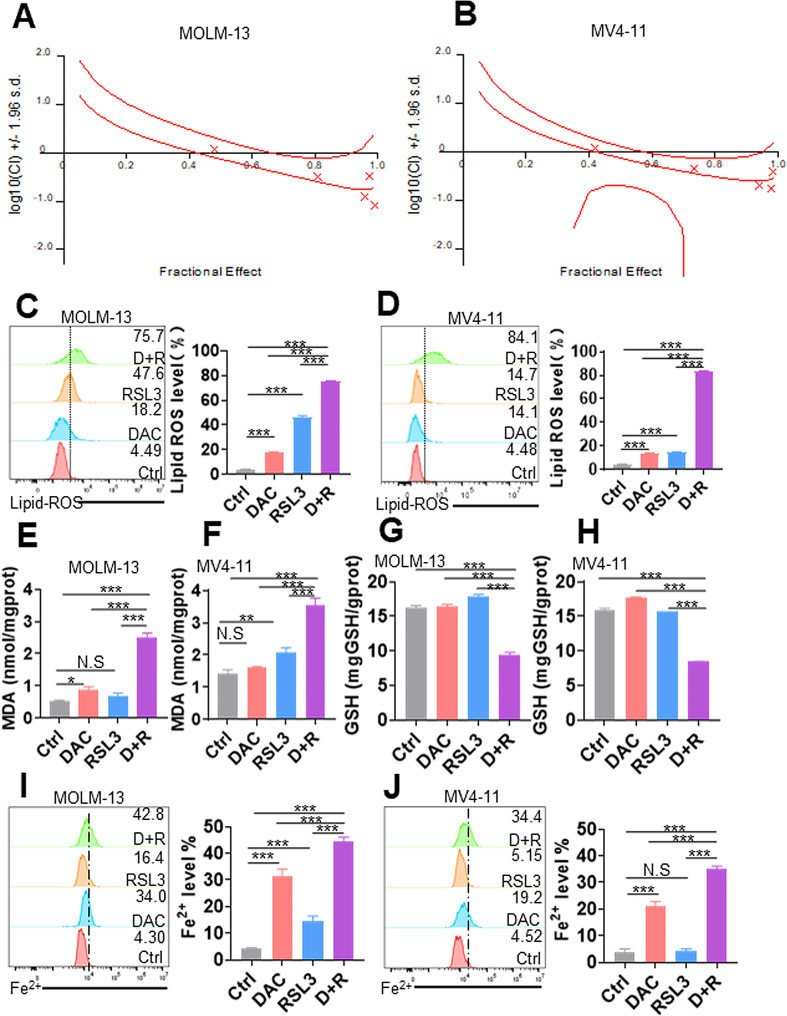
Methods: Lipid reactive oxygen species (ROS), malondialdehyde (MDA), and glutathione (GSH) assays were used to assess ferroptosis in AML cells treated with the hypomethylating agent (HMA) decitabine (DAC), ferroptosis-inducer (FIN) RAS-selective lethal 3 (RSL3), or their combination. Combination index (CI) analysis was used to assess the synergistic activity of DAC + RSL3 against AML cells. Finally, we evaluated the synergistic activity of DAC + RSL3 in murine AML and a human R/R-AML-xenografted NSG model in vivo.

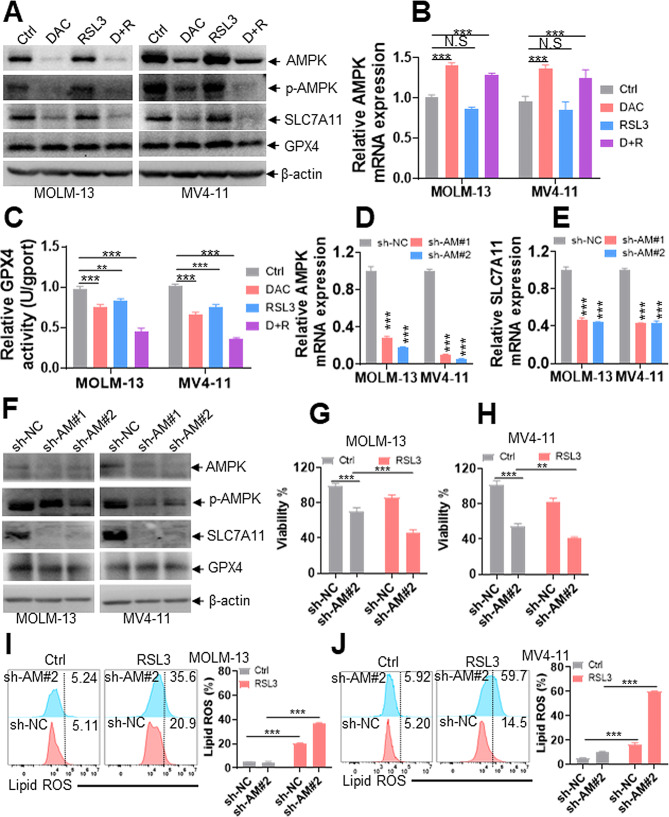
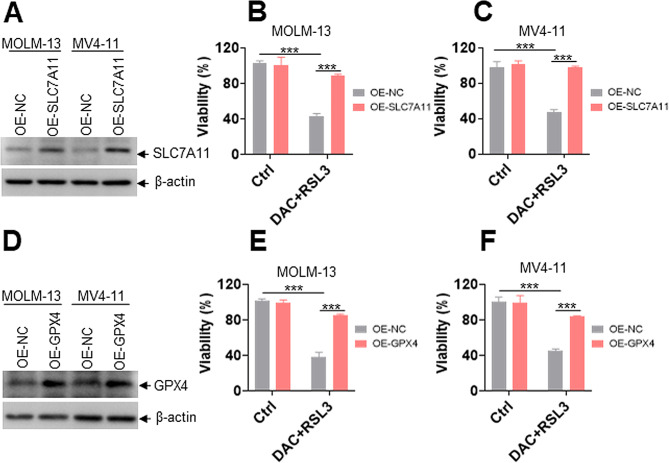
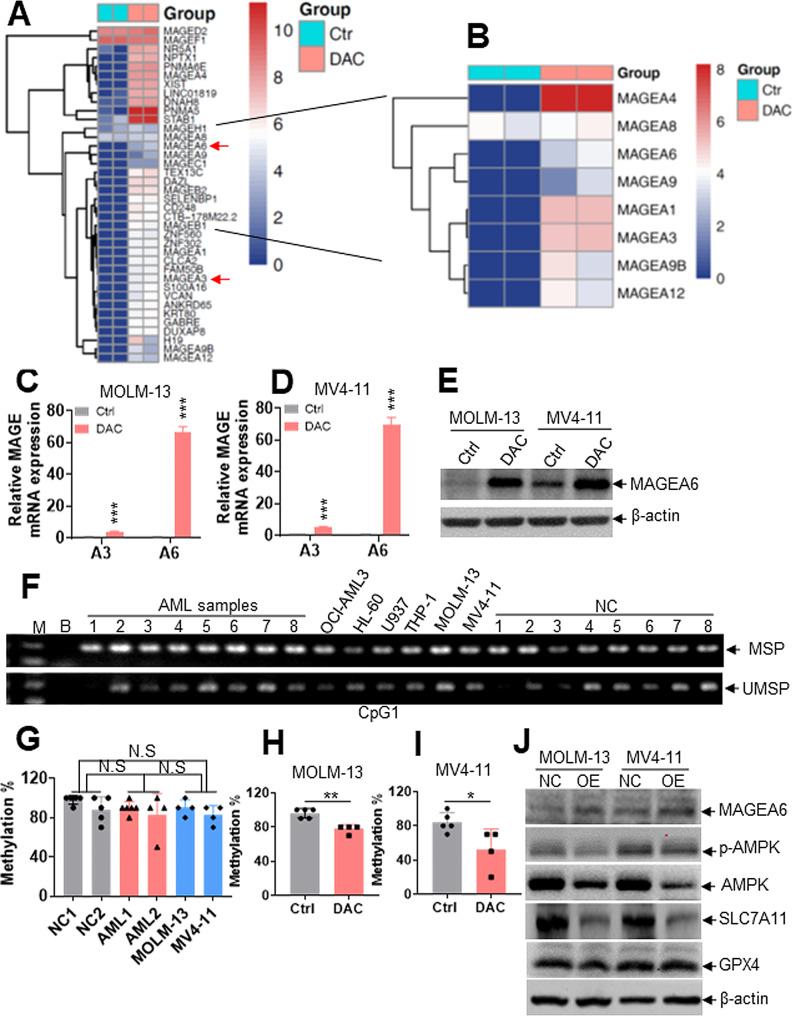
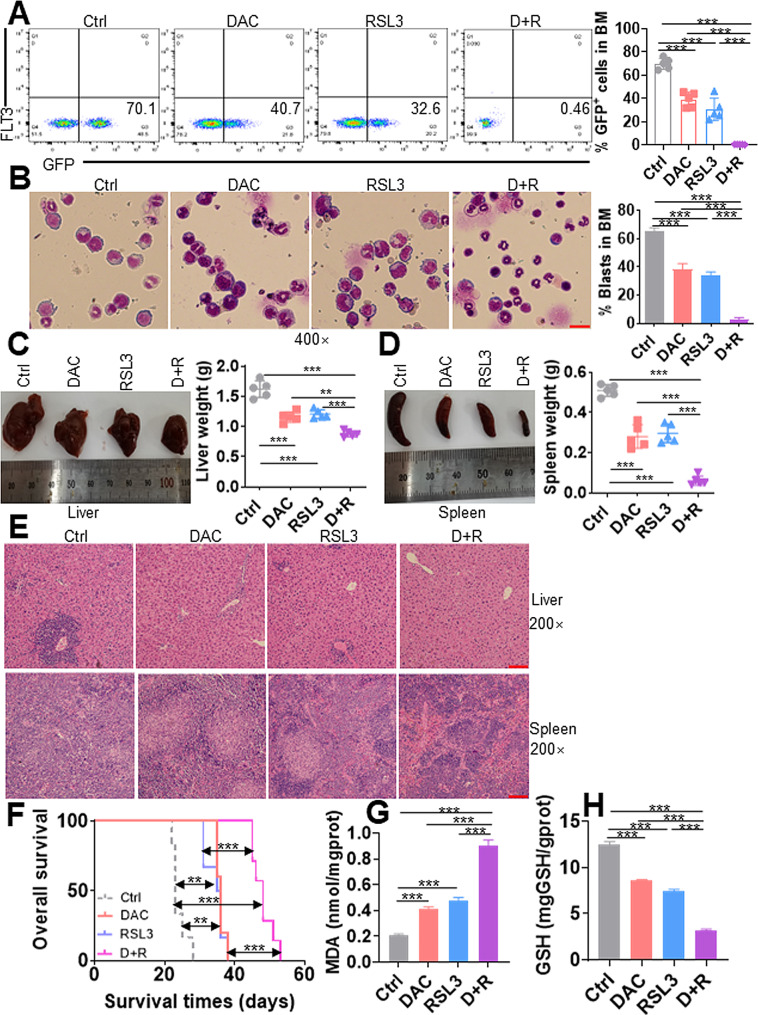
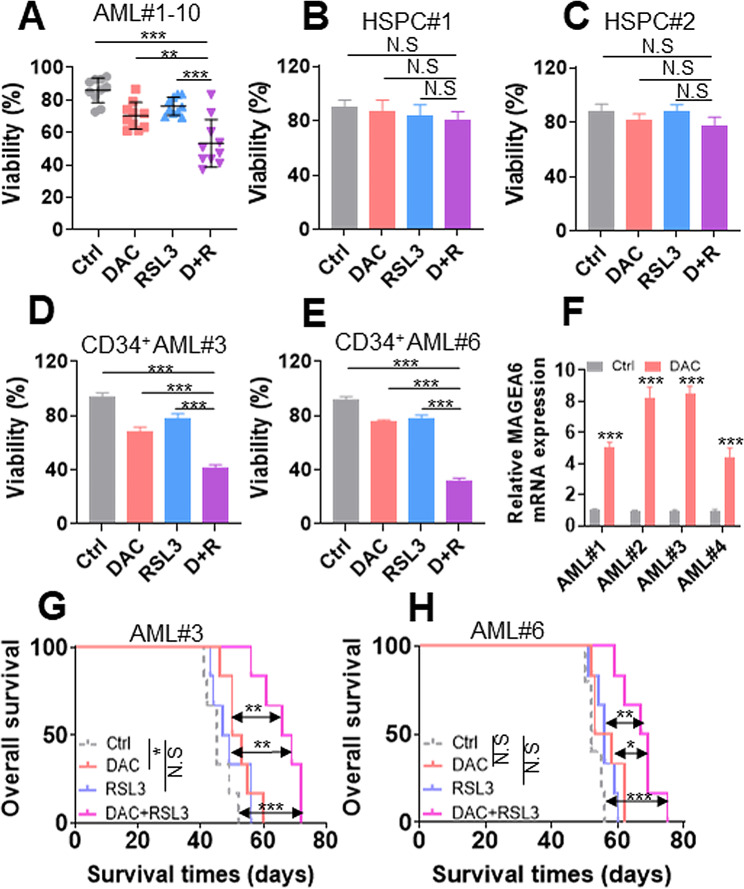
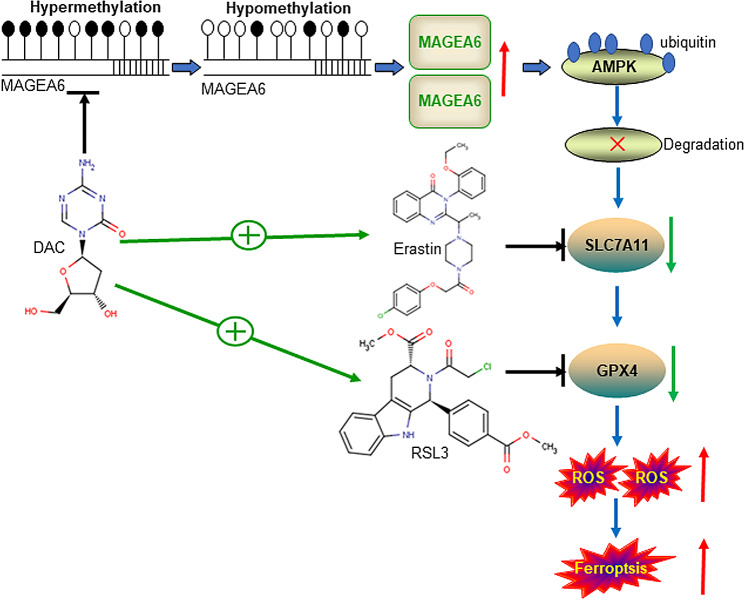
Results: We first assessed GPX4 expression and found that GPX4 levels were higher in AML cells, especially those with MLL rearrangements, than in NCs. Knockdown of GPX4 by shRNA and indirect inhibition of GPX4 enzyme activity by RSL3 robustly induced ferroptosis in AML cells. To reduce the dose of RSL3 and avoid side effects, low doses of DAC (0.5 µM) and RSL3 (0.05 µM) synergistically facilitate ferroptosis by inhibiting the AMP-activated protein kinase (AMPK)-SLC7A11-GPX4 axis. Knockdown of AMPK by shRNA enhanced ferroptosis, and overexpression of SLC7A11 and GPX4 rescued DAC + RSL3-induced anti-leukemogenesis. Mechanistically, DAC increased the expression of MAGEA6 by reducing MAGEA6 promoter hypermethylation. Overexpression of MAGEA6 induced the degradation of AMPK, suggesting that DAC inhibits the AMPK-SLC7A11-GPX4 axis by increasing MAGEA6 expression. In addition, DAC + RSL3 synergistically reduced leukemic burden and extended overall survival compared with either DAC or RSL3 treatment in the MLL-AF9-transformed murine model. Finally, DAC + RSL3 synergistically reduced viability in untreated and R/R-AML cells and extended overall survival in two R/R-AML-xenografted NSG mouse models.

Conclusions: Our study first identify vulnerability to ferroptosis by regulating MAGEA6-AMPK-SLC7A11-GPX4 signaling pathway. Combined treatment with HMAs and FINs provides a potential therapeutic choice for AML patients, especially for R/R-AML.

Keywords: AMPK; Acute myeloid leukemia; Ferroptosis; Glutathione peroxidase-4; Hypomethylating agent.


Conflict of interest statement

The authors declare no competing interests.

Figures

Fig. 1
Fig. 1
GPX4 expression is higher in AML blasts than in normal controls (NCs). (A) The relative expressions of GPX4 were assessed in AML blasts and normal hematological stem and progenitor cells (HSPCs) as normal controls (NCs) from the BloodSpot database. (B) The relative expressions of GPX4 were determined in AML blasts with different chromosome karyotypes from the BloodSpot database. (C) The relative expressions of GPX4 were assessed in AML cells with t(11q23) arrangement and NCs based on the GSE13159 database. (D) The relative expressions of GPX4 were assessed in PB and BM cells from AML patients and NCs based on the GSE9476 database. (E) The relative expressions of GPX4 were assessed in healthy BM as NC and AML patients from database of Leukemia Mile study. (F) The relative expressions of GPX4 were assessed in different AML karyotype from Leukemia Mile study database. NK: normal karyotype. (G) The protein levels of GPX4 were measured in four NCs and four AML samples. (H) GPX4 enzyme activities were measured in four NCs and ten AML samples. (I) GPX4 enzyme activities were analyzed in three R/R-AML and seven non-R/R-AML cells. (J and K) The overall survival of AML patients with higher expression of GPX4 (above median) and lower expression of GPX4 (below median) was assessed in the GSE1729 (J) and TCGA databases (K). *P < 0.05; **P < 0.01; ***P < 0.001 versus NCs. N.S: not significant
Fig. 2
Fig. 2
Knockdown of GPX4 and indirect inhibition of GPX4 activity by RSL3 trigger ferroptosis in AML cells. (A) MOLM-13 and MV4-11 cells were transduced with two specific shRNAs for GPX4 (sh-GPX4) or negative control (sh-NC) to inhibit GPX4 expression, and the protein levels of GPX4 were measured. (B) Viability was measured in MOLM-13 and MV4-11 cells after transduction with sh-GPX4 or sh-NC for 24, 48, and 72 h. (C and D) Lipid ROS levels were measured by flow cytometry in MOLM-13 and MV4-11 cells with knockdown of GPX4 or NC. Representative plots (left) and statistical analysis of lipid ROS levels (right) are shown. (E) Relative PTGS2 levels were measured in MOLM-13 and MV4-11 cells after transduction with sh-GPX4 or sh-NC. (F) Cell viability was measured by CCK-8 assay in MOLM-13 and MV4-11 cells treated with the indicated concentrations of RSL3 for 24 h, and the IC50 was calculated. (G and H) Cell proliferation and viability were measured in MOLM-13 and MV4-11 cells treated with or without RSL3 (0.1 µM) for 24 and 48 h. (I and J) Lipid ROS levels were measured in MOLM-13 and MV4-11 cells treated with RSL3 (0.1 µM) for 24 and 48 h. Shown are the representative plots (left) and statistical analysis of lipid ROS levels (right). (K) MDA amounts were measured in MOLM-13 and MV4-11 cells treated with or without RSL3 (0.1 µM) for 24 and 48 h. (L and M) Viability was measured in MOLM-13 and MV4-11 cells, which were preincubated with Fer-1 (2 µM), Z-VAD (20 µM), Ac-DEVD (20 µM), CQ (10 µM), or Nec-1 (50 µM) for 1 h and then treated with RSL3 (0.1 µM) for 24 h. **P < 0.01; ***P < 0.001 versus negative control or untreated cells. N.S (not significant) compared with RSL3 treatment
Fig. 3
Fig. 3
DAC and RSL3 synergistically induce ferroptosis in AML cells in vitro. (A and B) AML cells were treated with different concentrations of DAC (0.25 µM, 0.5 µM, 0.75 µM, 1.0 µM, 2.5 µM) for 48 h, RSL3 (0.025 µM, 0.05 µM, 0.075 µM, 0.1 µM, 0.25 µM) for 24 h, or their combination. CalcuSyn was used to assess the possible synergistic effects. CI < 1.0 is considered a synergistic effect. (C and D) Lipid ROS levels were measured in MOLM-13 and MV4-11 cells treated with DAC (0.5 µM) for 48 h, RSL3 (0.05 µM) for 24 h, or their combination. Representative plots (left) and statistical analysis of lipid ROS levels (right) are shown. (EH) MDA (E and F) and GSH amounts (G and H) were measured in MOLM-13 and MV4-11 cells treated with DAC, RSL3, or DAC + RSL3 cotreatment. (I and J) The intracellular iron assay was performed by flow cytometry in MOLM-13 and MV4-11 cells treated with Ctrl, DAC, RSL3, or DAC + RSL3 cotreatment. Representative plots (left) and statistical analysis of Fe2+ levels (right) are shown. *P < 0.05; **P < 0.01; ***P < 0.001. N.S: not significant
Fig. 4
Fig. 4
DAC enhances RSL3-induced ferroptosis by regulating the AMPK-SLC7A11-GPX4 signaling pathway. (A) AMPK, p-AMPK, SLC7A11, and GPX4 protein levels were measured in MOLM-13 and MV4-11 cells treated with DAC (0.5 µM) for 48 h, RSL3 (0.05 µM) for 24 h, or their combination DAC (0.5 µM) + RSL3 (0.05 µM) (D + R). (B and C) AMPK transcript level (B) and GPX4 enzyme activity (C) were measured in MOLM-13 and MV4-11 cells treated with Ctrl, DAC, RSL3, or D + R cotreatment. (D and E) AMPK and SLC7A11 transcripts were measured in MOLM-13 and MV4-11 cells transduced with shRNAs for AMPK (sh-AM#1 and #2) or negative control (sh-NC). (F) AMPK, p-AMPK, SLC7A11, and GPX4 protein levels were measured in MOLM-13 and MV4-11 cells transduced with sh-AM or sh-NC. (G and H) Viability was measured in MOLM-13 and MV4-11 cells transduced with sh-AM#2 or sh-NC, which were further treated with RSL3 (0.05 µM) or Ctrl for 24 h. (I and J) Lipid ROS levels were measured in MOLM-13 and MV4-11 cells transduced with sh-AM#2 or sh-NC, which were further treated with RSL3 or Ctrl for 24 h. **P < 0.01; ***P < 0.001. N.S: not significant
Fig. 5
Fig. 5
Overexpression of SLC7A11 or GPX4 rescues DAC + RSL3-induced decrease in viability. (A) Western blot was performed in MOLM-13 and MV4-11 cells, which were overexpressed with SLC7A11 or NC. (B and C) Viability was measured in Ctrl- or DAC + RSL3-treated MOLM-13 and MV4-11 cells, which were further overexpressed with SLC7A11 or NC. (D) Western blot was performed in MOLM-13 and MV4-11 cells, which were overexpressed with GPX4 or NC. (E and F). Viability was measured in Ctrl or DAC + RSL3-treated MOLM-13 and MV4-11 cells overexpressing GPX4 or NC. ***P < 0.001
Fig. 6
Fig. 6
DAC induces AMPK degradation by increasing MAGEA6 expression and reducing MAGEA6 promoter hypermethylation. (A and B) RNA-seq analysis of DAC- and Ctrl-treated MOLM-13 cells. (C and D) MAGEA3 and A6 transcript levels were measured in MOLM-13 and MV4-11 cells treated with or without DAC (0.5 µM) for 48 h. (E) MAGEA6 protein level was measured in MOLM-13 and MV4-11 cells treated with DAC (0.5 µM) for 48 h. (F) Methylation-specific PCR (MSP) and unmethylation-specific PCR (UMSP) were performed to measure the methylation level of CpG island 1 in eight AML samples, six AML cell lines, and eight NCs. M: DNA Marker; B: Blank. (G) Bisulfite-genomic sequencing was performed to measure the methylation status of CpG island 1 in two NCs, two AML samples, and two AML cell lines. (H and I) MOLM-13 and MV4-11 cells were incubated with or without DAC (0.5 µM) for 48 h. DNA was extracted for bisulfite-genomic sequencing in Ctrl- or DAC-treated AML cells, and a summary of the frequencies of methylated CpG dinucleotides is shown. (J) The protein expression levels of MAGEA6, p-AMPK, AMPK, SLC7A11, and GPX4 were measured in MOLM-13 and MV4-11 cells transduced with pLVX-MAGEA6 overexpressing MAGEA6 (OE) or blank vector pLVX-NC (NC). *P < 0.05; **P < 0.01; ***P < 0.001 versus Ctrl cells. N.S: not significant
Fig. 7
Fig. 7
DAC and RSL3 synergistically exert antileukemic activity in the MLL-AF9-transformed murine AML model. (A) The frequencies of GFP+ cells were measured in BM mononuclear cells from Ctrl, DAC, RSL3, or DAC + RSL3 (D + R)-treated AML mice (n = 4 for each group). Representative plots (left) and statistical analysis of GFP+ cells (right) are shown. (B) The Wright-Giemsa stain showed BM blasts from Ctrl, DAC, RSL3, or D + R-treated AML mice. Representative pictures (left) and statistical analysis of the percentage of BM blasts (right) are shown. Bar scales represent 20 μm. (C and D) Liver and spleen tissues were isolated from Ctrl, DAC, RSL3, or D + R-treated AML mice (n = 4 for each group), and weights were calculated. Representative pictures (left) and statistical analysis of the liver and spleen weights (right) are shown. (E) Representative images of HE staining of liver and spleen tissues from Ctrl, DAC, RSL3, or D + R-treated leukemic mice. Bar scales represent 100 μm for spleen and liver tissues. (F) Overall survival was calculated in Ctrl (n = 6), DAC (n = 5), RSL3 (n = 6), or D + R (n = 7)-treated leukemic mice. (G and H) MDA (G) and GSH amounts (H) were measured in BM GFP+ cells isolated from AML mice treated with Ctrl, DAC, RSL3, or D + R (n = 3 for each group). **P < 0.01; ***P < 0.001
Fig. 8
Fig. 8
DAC and RSL3 synergistically have antileukemic effects in primary AML samples but not in normal HSPCs. (A) Cell viability was measured in 10 AML samples treated with Ctrl, DAC (1.0 µM) for 48 h, RSL3 (0.1 µM) for 24 h, or their combination in vitro. Each scatter plot represents mean value of one AML patient. (B and C) Cell viability was measured in two normal CD34+ HSPCs treated with Ctrl, DAC (1.0 µM) for 48 h, RSL3 (0.1 µM) for 24 h, or their combination. (D and E) Cell viability was measured in two CD34+ cells, which were isolated from two R/R AML patients, treated with Ctrl, DAC (1.0 µM) for 48 h, RSL3 (0.1 µM) for 24 h, or their combination. (F) MAGEA6 transcript levels were measured in four primary AML blasts treated with Ctrl or DAC (1.0 µM) for 48 h in vitro. (G and H) Overall survival was calculated in Ctrl (n = 6 for G and n = 5 for H), DAC (n = 6 for G and H), RSL3 (n = 6 for G and H), or DAC + RSL3 (n = 6 for G and H)-treated NSG mice transplanted with R/R AML cells. *P < 0.05; **P < 0.01; ***P < 0.001. N.S: not significant
Fig. 9
Fig. 9
Mechanistic scheme underlying the synergistic activity of DAC with erastin/RSL3. DAC increases MAGEA6 expression by reducing the frequency of methylation at the MAGEA6 promoter. Overexpression of MAGEA6 induces the degradation of AMPK protein and the inhibition of AMPK activation, leading to the decreased expression of SLC7A11 and attenuated GPX4 enzyme activity. Thus, DAC synergizes with erastin/RSL3 to augment ferroptosis in AML cells

Similar articles

Cited by

References

    1. Kogan AA, Lapidus RG, Baer MR, Rassool FV. Exploiting epigenetically mediated changes: Acute myeloid leukemia, leukemia stem cells and the bone marrow microenvironment. Adv Cancer Res. 2019;141:213–53. doi: 10.1016/bs.acr.2018.12.005. - DOI - PubMed
    1. Stahnke K, Fulda S, Friesen C, Strauss G, Debatin KM. Activation of apoptosis pathways in peripheral blood lymphocytes by in vivo chemotherapy. Blood. 2001;98:3066–73. doi: 10.1182/blood.V98.10.3066. - DOI - PubMed
    1. Hannun YA. Apoptosis and the dilemma of cancer chemotherapy. Blood. 1997;89:1845–53. doi: 10.1182/blood.V89.6.1845. - DOI - PubMed
    1. Ketley NJ, Allen PD, Kelsey SM, Newland AC. Mechanisms of resistance to apoptosis in human AML blasts: the role of differentiation-induced perturbations of cell-cycle checkpoints. Leukemia. 2000;14:620–8. doi: 10.1038/sj.leu.2401715. - DOI - PubMed
    1. Yang WS, SriRamaratnam R, Welsch ME, Shimada K, Skouta R, Viswanathan VS, et al. Regulation of ferroptotic cancer cell death by GPX4. Cell. 2014;156:317–31. doi: 10.1016/j.cell.2013.12.010. - DOI - PMC - PubMed

LinkOut - more resources