. 2024 Feb 20;15(1):1194.
doi: 10.1038/s41467-024-45248-5.

Phosphorylation of plasma membrane H+-ATPase Thr881 participates in light-induced stomatal opening

Affiliations

Phosphorylation of plasma membrane H+-ATPase Thr881 participates in light-induced stomatal opening

Yuki Hayashi et al. Nat Commun. .

Abstract

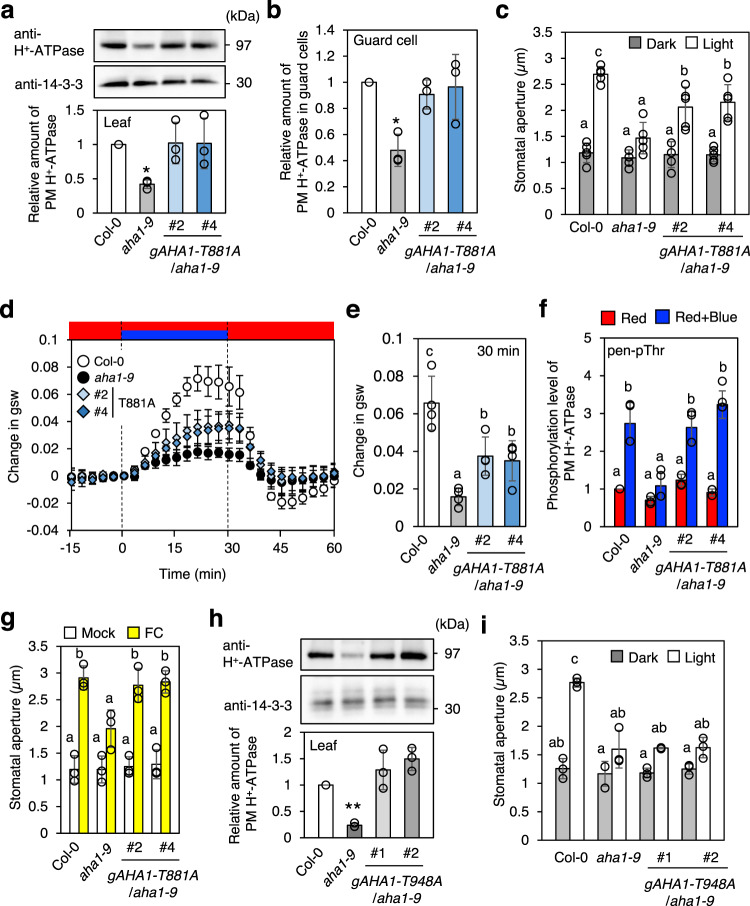
Plasma membrane (PM) H+-ATPase is crucial for light-induced stomatal opening and phosphorylation of a penultimate residue, Thr948 (pen-Thr, numbering according to Arabidopsis AHA1) is required for enzyme activation. In this study, a comprehensive phosphoproteomic analysis using guard cell protoplasts from Vicia faba shows that both red and blue light increase the phosphorylation of Thr881, of PM H+-ATPase. Light-induced stomatal opening and the blue light-induced increase in stomatal conductance are reduced in transgenic Arabidopsis plants expressing mutant AHA1-T881A in aha1-9, whereas the blue light-induced phosphorylation of pen-Thr is unaffected. Auxin and photosynthetically active radiation induce the phosphorylation of both Thr881 and pen-Thr in etiolated seedlings and leaves, respectively. The dephosphorylation of phosphorylated Thr881 and pen-Thr are mediated by type 2 C protein phosphatase clade D isoforms. Taken together, Thr881 phosphorylation, in addition of the pen-Thr phosphorylation, are important for PM H+-ATPase function during physiological responses, such as light-induced stomatal opening in Arabidopsis thaliana.


Conflict of interest statement

The authors declare no competing interests.

Figures

Fig. 1
Fig. 1. Immunohistochemical estimation of the phosphorylation levels in the guard cells of Arabidopsis PM H+-ATPase.
a Detection of PM H+-ATPase phosphorylation in Arabidopsis guard cells. Leaf epidermal tissues isolated from dark-acclimated Arabidopsis thaliana Col-0 plants were incubated in the basal buffer and kept in the dark for 30 min (Dk) or illuminated with red light and blue light. Red light (50 µmol m−2 s−1) was illuminated for 30 min (R), after which blue light (10 µmol m−2 s−1) was simultaneously illuminated with the red light for 2.5 min (R + B). The fungal toxin fusicoccin (FC) at 10 µM or DMSO (solvent control; Mock) was added to the basal buffer, and the epidermal tissues were incubated in the dark for 5 min. The phosphorylated PM H+-ATPase and PM H+-ATPase proteins were detected using anti-pThr881, anti-pen-pThr, and anti-H+-ATPase antibodies. Typical immunofluorescent images (top) and relative fluorescence intensities of fluorescent signals (bottom) are shown. Data represent averages of relative values from three independent experiments with standard deviation (SD). The asterisk indicates statistically significant difference (one-tailed Student’s t test: *, ** and n.s [not significant] indicate P < 0.05, P < 0.01 and P > 0.05, respectively). Bar = 10 µm. b Inhibition of red light-induced phosphorylation of Thr881 by photosynthesis inhibitor DCMU. Epidermal tissues were pretreated with 10 µM DCMU or EtOH (solvent control; Mock) for 20 min in the dark before light illumination. Daggers indicate that the phosphorylation levels are significantly higher than Dk of Mock set to 1 (two-tailed Student’s t test: , †† and n.s. indicate P < 0.05, P < 0.01, and P > 0.05). Asterisks indicate that the mean of RB are significantly higher than that of R within each experiment and that the averages of RB of DCMU are significantly lower than that of Mock (one-tailed Student’s t test: ***, P < 0.0001). Others are same as in a. c Suppression of the blue light-induced Thr881 and pen-Thr phosphorylation in a phot1 phot2 double mutant. Immunohistochemical methods were performed using phot1 phot2 and gl1, the background plant. Daggers indicate that the phosphorylation levels are significantly higher than Dk of gl1 set to 1 (two-tailed Student’s t test: , ††, n.s. indicate P < 0.05, P < 0.01, and P > 0.05, respectively). Asterisks indicate that the averages of RB are significantly higher than that of R within each genotype and that the averages of RB of phot1 phot2 are significantly lower than that of gl1 (one-tailed Student’s t test: * indicates P < 0.05). Others are same as in a.
Fig. 2
Fig. 2. Blue light-induced PM H+-ATPase phosphorylation in Col-0 and bhp-1 GCPs.
GCPs isolated from Arabidopsis thaliana Col-0 and bhp-1 were kept in the dark for 1 hr. Dark-adapted GCPs were illuminated by red light (R: 50 μmol m−2 s−1, 20 min), then blue light (RB: 10 μmol m−2 s−1, 2.5 min) was superimposed on the red light. The phosphorylated PM H+-ATPase and amount of PM H+-ATPase were detected by the immunoblot using anti-pThr881, anti-pen-pThr and anti-H+-ATPase antibodies. Black and white arrowheads show the positions of AHAs and BHP, respectively. The graphs on the right side show the relative phosphorylation level of PM H+-ATPase, which is calculated by dividing the signal intensities of the bands detected with anti-pThr881 or anti-pen-pThr by that of the band detected with anti-H+-ATPase antibody. The relative amount of PM H+-ATPase was calculated by normalizing against the amount of PM H+-ATPase in Red of Col-0. Data are mean ± SD of three independent experiments. Daggers indicate that the mean is statistically significantly higher than R of Col-0 (two-tailed Student’s t test: P < 0.05). n.s., Not significant (two-tailed Student’s t test: P > 0.05).
Fig. 3
Fig. 3. Effect of phospho-defective form of Thr881 and pen-Thr (Thr948) in PM H+-ATPase on stomatal responses.
a Expression of Thr881 phospho-defective form (T881A) of AHA1 in aha1-9 mutant (gAHA1-T881A/aha1-9). Immunoblots of PM H+- ATPase and 14-3-3 proteins were carried out using proteins obtained from rosette leaves of 4-week-old plants with specific antibodies. The 14-3-3 proteins were used as a loading control. Relative amounts of PM H+-ATPase were estimated from the total PM H+-ATPase signals normalized against that in Col-0. Data are mean ± SD of three independent experiments. Asterisk indicates a significant statistical difference relative to Col-0 (two-tailed Student’s t test: *P < 0.01). b Expression of PM H+-ATPase in guard cells of gAHA1-T881A plants. PM H+-ATPase in guard cells were detected by immunofluorescence method using the specific antibody. Relative amounts of PM H+-ATPase were normalized against that in Col-0. Data are mean ± SD of three independent experiments. Asterisk indicates a significant difference relative to Col-0 (two-tailed Student’s t test: *P < 0.01) c Light-induced stomatal opening in gAHA1-T881A plants. Leaf epidermal tissues from dark-acclimated plants in the basal buffer were incubated for 4 h with or without light (blue light at 10 µmol m−2 s−1 superimposed on red light at 50 µmol m−2 s−1). Values represent means ± SD (n = 5, independent experiments); measurement of 30 stomata in each experiment. Different letters indicate significant differences among means (ANOVA with Tukey’s test: P < 0.05). d Light-dependent changes in stomatal conductance. Leaves from dark-acclimated plants were illuminated with red light (Red: 600 µmol m−2 s−1) and/or blue light (60 µmol m−2 s−1) as indicated. Data are mean ± SD of four independent experiments. e Stomatal conductance at 30 min after starting blue light illumination. Data were obtained from d. Different letters indicate significant differences among means (ANOVA with Tukey’s test: P < 0.05). f Immunohistochemical detection of the pen-Thr phosphorylation in guard cells in response to blue light in gAHA1-T881A plants. Data are mean ± SD of three independent experiments. Different letters indicate statistically significant differences among means (ANOVA with Tukey’s test: P < 0.05). Others are the same as in Fig. 1a. g Stomatal opening in response to FC. Epidermal tissues from dark-acclimated plants in the basal buffer were treated with DMSO (Mock) or 10 µM FC (FC) in the dark for 4 h. Data are mean ± SD of three independent experiments. Different letters indicate statistically significant differences among means (ANOVA with Tukey’s test: P < 0.05). Other details are the same as in c. h Expression of Thr948 phospho-defective form (T948A) of AHA1 in aha1-9 mutant (gAHA1-T948A/aha1-9). Asterisk indicates a significant statistical difference relative to Col-0 (two-tailed Student’s t test: **P < 0.01). Other details are the same as in a. i Light-induced stomatal opening in gAHA1-T948A plants. Data are mean ± SD (n = 3, independent experiments); measurement of 30 stomata in each experiment. Different letters indicate significant differences among means (ANOVA with Tukey’s test: P < 0.05).
Fig. 4
Fig. 4. Phosphorylation of PM H+-ATPases in etiolated hypocotyl segments and leaves.
a Light-induced phosphorylation of PM H+-ATPase in rosette leaves. Leaf pieces from dark-acclimated 4-week-old Arabidopsis plants were illuminated with white light (50 µmol m−2 s−1; Lt) or kept in the dark (Dk) for 30 min. The phosphorylation level and amount of PM H+-ATPase were estimated by the immunoblot using anti-pThr881, anti-pen-pThr and anti-H+-ATPase antibodies. Arrowheads show the position of AHAs. Lower graphs show the relative phosphorylation level of PM H+-ATPase, which is calculated by dividing the signal intensities of the bands detected with anti-pThr881 or anti-pen-pThr by that of the band detected with anti-H+-ATPase antibody. Data are mean ± SD of three independent experiments. The asterisks indicate significant difference compared to DMSO (one-tailed Student’s t test: *P < 0.05). b Auxin-induced phosphorylation of PM H+-ATPase in etiolated hypocotyl segments. Hypocotyl segments excised from 3-day-old Arabidopsis etiolated seedlings were treated with DMSO (Mock) or 10 µM IAA (Auxin) in the dark for 30 min. Data are mean ± SD of three independent experiments. The asterisk indicates a significant difference (two-tailed Student’s t test: *P < 0.05; **P < 0.0001). Others are the same as in a. c Leaf pieces from dark-adapted Col-0, psy1r and psy1r pskr1 pskr2 triple mutant (TKO) were illuminated with white light. Others are same as in a.
Fig. 5
Fig. 5. Dephosphorylation of Thr881 in PM H+-ATPases by type-2C protein phosphatase (PP2C).
a In vitro dephosphorylation of PM H+-ATPase in the microsomes isolated from leaves. Microsomal membranes isolated from Col-0 leaves were used for the dephosphorylation (Untreated) and the reactions were carried out for 30 min at 24 °C (None). EDTA at 0.5 mM and 10 µM FC were added to the reaction buffer. Daggers indicate that the mean is significantly higher than Untreated set to 1 (two-tailed Student’s t test: P < 0.0001). Asterisk indicates a significant difference relative to None (Dunnett’s test: *P < 0.05; **P < 0.01). Others are same as in Fig. 2. b Transient expression of GFP-PP2Cs and GFP-SAUR19 in the mesophyll cell protoplasts. GFP-PP2Cs and GFP-SAUR19 were detected using anti-GFP antibody. Numbers at right indicate molecular weight markers. Others are same as in Fig. 2. Experiments were repeated on three occasions with similar results (Supplementary Fig. 6). c Light-induced phosphorylation of PM H+-ATPase in pp2c.d mutants. Leaf pieces from dark-adapted Col-0 and pp2c.d2d6 were illuminated with white light (Lt) or kept in the dark (Dk) for 30 min. Lower graphs show the phosphorylation level of PM H+-ATPase, which is calculated by dividing the signal intensities of the bands detected with anti-pThr881 or anti-pen-pThr by that of the band detected with anti-H+-ATPase antibody. Data are mean ± SD of three independent experiments. The asterisks indicate a statistically significant difference between Col-0 and pp2c.d2d6 (one-tailed Student’s t test: *P < 0.05; **P < 0.01; n.s., Not significant, P > 0.05). Others are the same as in Fig. 4a.
Fig. 6
Fig. 6. Schematic model of light-induced stomatal opening and contribution of Thr881 phosphorylation of PM H+-ATPase in guard cells.
Arrows and T-bars lines denote positive and negative regulation, respectively. The thickness of the arrows connecting “phosphorylation” and “PM H+-ATPase activation” reflects their contribution.

Similar articles

Cited by

References

    1. Shimazaki K, Doi M, Assmann SM, Kinoshita T. Light regulation of stomatal movement. Annu. Rev. Plant Biol. 2007;58:219–247. doi: 10.1146/annurev.arplant.57.032905.105434. - DOI - PubMed
    1. Inoue S, Kinoshita T. Blue light regulation of stomatal opening and the plasma membrane H+-ATPase. Plant Physiol. 2017;174:531–538. doi: 10.1104/pp.17.00166. - DOI - PMC - PubMed
    1. Wang Y, et al. Overexpression of plasma membrane H+-ATPase in guard cells promotes light-induced stomatal opening and enhances plant growth. Proc. Natl Acad. Sci. USA. 2014;111:533–538. doi: 10.1073/pnas.1305438111. - DOI - PMC - PubMed
    1. Toh S, et al. Identification and characterization of compounds that affect stomatal movements. Plant Cell Physiol. 2018;59:1568–1580. doi: 10.1093/pcp/pcy061. - DOI - PubMed
    1. Zhang M, et al. Plasma membrane H+-ATPase overexpression increases rice yield via simultaneous enhancement of nutrient uptake and photosynthesis. Nat. Commun. 2021;12:735. doi: 10.1038/s41467-021-20964-4. - DOI - PMC - PubMed

MeSH terms

Substances