. 2024 Feb 20;15(1):1564.
doi: 10.1038/s41467-024-45012-9.

Regulatory T cells use heparanase to access IL-2 bound to extracellular matrix in inflamed tissue

Affiliations

Regulatory T cells use heparanase to access IL-2 bound to extracellular matrix in inflamed tissue

Hunter A Martinez et al. Nat Commun. .

Abstract

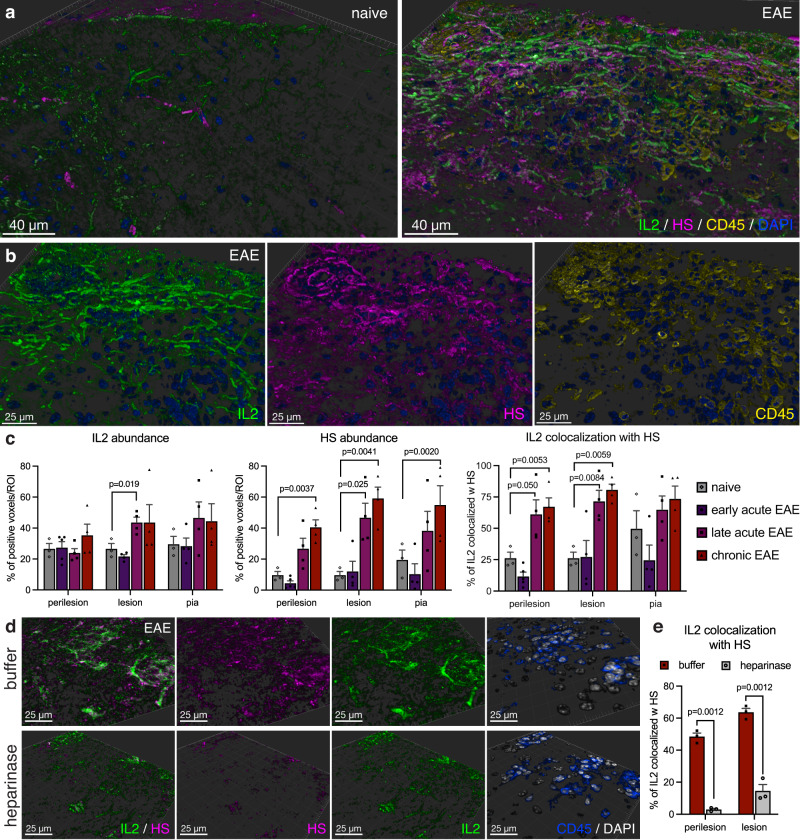
Although FOXP3+ regulatory T cells (Treg) depend on IL-2 produced by other cells for their survival and function, the levels of IL-2 in inflamed tissue are low, making it unclear how Treg access this critical resource. Here, we show that Treg use heparanase (HPSE) to access IL-2 sequestered by heparan sulfate (HS) within the extracellular matrix (ECM) of inflamed central nervous system tissue. HPSE expression distinguishes human and murine Treg from conventional T cells and is regulated by the availability of IL-2. HPSE-/- Treg have impaired stability and function in vivo, including in the experimental autoimmune encephalomyelitis (EAE) mouse model of multiple sclerosis. Conversely, endowing monoclonal antibody-directed chimeric antigen receptor (mAbCAR) Treg with HPSE enhances their ability to access HS-sequestered IL-2 and their ability to suppress neuroinflammation in vivo. Together, these data identify a role for HPSE and the ECM in immune tolerance, providing new avenues for improving Treg-based therapy of autoimmunity.


Conflict of interest statement

The authors declare no competing interests.

Figures

Fig. 1
Fig. 1. IL-2 and HS colocalize at sites of autoimmune neuroinflammation.
a Imaris surface rendering of immunofluorescent staining for IL-2 (green), HS (magenta) and CD45 (yellow) in naïve and EAE spinal cord tissue (29 days post immunization (dpi)). DAPI nuclear counterstain shown in blue. Representative of 3 separate EAE experiments. b Detail of IL-2 (green), HS (magenta) and CD45 (yellow) immunoreactivity in an EAE lesion. c Imaris quantification of abundance of IL-2 and HS immunoreactivity, and fraction of IL-2 colocalized with HS in naïve and EAE spinal cord tissue at different time points (early acute: 14 dpi, late acute: 29 dpi, chronic 40 dpi). Imaris colocalization analysis was done in areas surrounding CD45 cell infiltration (perilesion), areas with CD45 cell infiltration (lesion) and in the glia limitans underlying the meninges (pia). Shown are mean + SEM, n = 3 (naïve), 5 (early acute), 4 (late acute and chronic) separate areas analyzed. P values determined by unpaired two-tailed Welch’s t test with Benjamini, Krieger and Yekutieli correction for multiple comparisons. d Immunofluorescent staining for IL-2 (green) and HS (magenta) of a cerebellar EAE lesion that was treated with heparinase from Flavobacterium heparinum before immunofluorescent staining, or buffer treatment of a serial section as a control. CD45 (blue) staining is shown to depict areas with immune cell infiltration. Representative of 2 separate experiments. e Imaris quantification of IL-2 colocalized with HS before (red) and after heparinase (gray) treatment. Shown are mean + SEM, n = 3 separate areas analyzed. P values determined by two-way ANOVA with Sidak’s multiple-comparison correction.
Fig. 2
Fig. 2. HS-bound IL-2 supports Treg homeostasis.
a CTLL-2 proliferation, measured by resazurin reduction (arbitrary fluorescence units (AU)), in response to human recombinant IL-2 alone or pre-incubated with HS at a molecular ratio of 5:1. Equivalent doses of HS, not pre-incubated with IL-2, were used as a control. P values determined using two-way ANOVA. Shown is a representative of 4 independent experiments (mean +/− SEM of duplicate wells). b Schematic overview of CTLL-2 proliferation induced by heparin-coated beads pre-incubated with IL-2 or T51P-IL-2. c CTLL-2 proliferation in response to heparin-coated beads pre-incubated with IL-2 or T51P-IL-2. The concentration of IL-2 or T51P-IL-2 at which the beads were pre-incubated is depicted on the x-axis. Proliferation rate is shown as equivalent dose of soluble IL-2 or T51P-IL-2 at which a similar proliferative response is elicited as by the respective pre-incubated beads. Shown is a representative of 3 independent experiments (mean +/− SEM of triplicate wells). P value determined by two-way ANOVA. d Frequency and viability of FOXP3+ Treg induced from CD4+ T cells stimulated with anti-CD3/anti-CD28 in the presence of 50 ng/ml TGF-β and low-dose human recombinant IL-2 (20 IU/ml) alone, or IL-2 pre-incubated with HS (as described in Fig. 2a). e Viability of FOXP3- Tconv in the cultures described in (d). Cell frequencies and viability were measured by flow cytometry 72 hr after start of induction. Shown is a representative of 5 independent experiments (mean + SEM of triplicate samples), P values determined by one-way ANOVA with Tukey’s multiple comparison correction. f, g Viability of FOXP3+ Treg (f) and CD25+/FOXP3- Tconv (g) among CD25+-enriched CD4+ T cells cultured in the presence of heparin-coated beads pre-incubated with IL-2 or T51P-IL-2 (T51P). Cells were analyzed by flow cytometry 24 h after start of culture. Percentage of viable cells among (f) FOXP3+ or (g) FOXP3- cells is depicted, corrected for baseline viability of cells cultured in media only (control: without IL-2). All panels show representatives of 4 independent experiments (mean + SEM of triplicate wells with cells pooled from 3-5 animals per experiment); P values depict variation due to the cytokine that the beads were incubated with (IL-2 vs. T51P-IL-2), determined by two-way ANOVA. h Schematic overview of the assay designed to assess the effectiveness of Treg-mediated stripping of IL-2 from heparin-coated beads. i CTLL-2 proliferation in response to IL-2 and T51P-IL-2-pre-incubated beads cultured with or without Treg. Proliferation rate is shown as percentage of proliferation in response to control beads, that were incubated in media in the first pre-incubation step. Shown is a representative of 3 independent experiments (mean + SEM of 6 wells per sample, cells pooled from 3-5 animals per experiment). P value determined by two-way ANOVA with Sidak’s multiple comparison correction.
Fig. 3
Fig. 3. Treg differentially express HPSE after activation.
a HPSE mRNA expression in FACS-sorted murine FOXP3+ Treg and FOXP3 Tconv after in vitro activation with aCD3/aCD28 antibody (24 h). Shown are mean relative expression + SEM, compared to resting Tconv and normalized by 18S mRNA expression, n = 4 independent experiments performed with cells pooled from 5–10 animals per experiment, PCR ran with triplicate wells. Two-way ANOVA. b Western blot analysis and c, semi-quantitation of HPSE protein expression in murine Treg and Tconv after in vitro activation with aCD3/aCD28 antibody. Actin was used as a control to normalize quantitation. Shown are mean relative expression + SEM, compared to resting Tconv, n = 2 independent experiments, performed with cells pooled from 4 or 5 animals per experiment, single lanes ran per experiment. Two-way ANOVA with Dunnett’s multiple comparison correction. d HPSE mRNA expression in FACS sorted and in vitro activated human CD4+/CD25+/CD127 Treg and CD4+/CD25/CD127+ Tconv. Shown are mean relative HPSE expression + SEM of technical triplicates of a representative of 2 experiments, compared to Tconv and normalized by β-actin expression. P value determined by unpaired two-tailed t-test. e Volcano plot of statistical significance against fold change of genes differentially expressed between Treg and Teff isolated from human colon tissue. f HPSE mRNA expression in FACS sorted CD4+/CD25+/CD127 Treg and CD4+/CD25/CD127+ Tconv isolated from human colon tissue. Shown are mean relative HPSE expression +/− SD, n = 18–22 sorted samples from individual subjects. P value determined by unpaired two-tailed t-test.
Fig. 4
Fig. 4. HPSE expression supports FOXP3+ Treg homeostasis in vitro and in vivo.
a Western blot analysis of human HPSE overexpression and mouse HPSE basal expression in CTLL-2 cells transfected with HPSE construct (HPSEover), compared to untransfected CTLL-2 cells (WT). b Proliferation of WT CTLL-2 cells (WT, blue) and HPSE-overexpressing CTLL-2 cells (HPSEover, green) in response to heparin-coated beads that were pre-incubated with IL-2 (closed symbols) or T51P-IL-2 (T51P, open symbols). The concentration of IL-2 or T51P-IL-2 at which the beads were pre-incubated is depicted on the x-axis. Proliferation rate is depicted as equivalent dose of soluble IL-2 or T51P-IL-2 at which a similar proliferative response is elicited as by the beads. Shown is a representative of 3 independent experiments (mean +/− SEM of triplicate samples). P values of variation due to the genotype of the cells are shown, determined with two-way ANOVA with Tukey’s multiple comparison correction. c, d Viability of WT and HPSE-/- FOXP3+ Treg (c) and CD25+/FOXP3- Tconv (d) among CD4+ T cells cultured in the presence of heparin-coated beads pre-incubated with IL-2. Viability was measured by flow cytometry 24 h after start of culture. Shown are representatives of 4 independent experiments (mean + SEM of triplicate samples); P values depict variation due to the genotype (WT vs. HPSE-/-), determined by two-way ANOVA. e, Quantification of STAT5 phosphorylation by flow cytometry in WT and HPSE-/- FOXP3+ Treg after stimulation with IL-2 that was sequestered by plate-bound HS. Shown are mean +/− SEM of technical triplicates of a representative of 4 experiments. P values determined by two-way ANOVA with Sidak’s multiple comparison correction. f Percentage of pSTAT5+ cells among CD4+/FOXP3+ Treg isolated from naïve WT and HPSE-/- spleen tissue. Shown are mean + SEM, n = 6-8 animals per group. P value determined by unpaired two-tailed t-test. g Representative flow cytometry plots depicting FOXP3+ Treg frequencies among CD4+ T cells in spleen tissue of WT and HPSE-/- mice. h Quantification of FOXP3+ Treg frequencies among CD4+ T cells in lymphoid (left panel) and non-lymphoid (right panel) tissues of WT and HPSE-/- mice. BM, bone marrow; LI, large intestine. Show are mean + SEM, n = 3-6 animals per group. P values determined by unpaired two-tailed t-test with Holm-Sidak multiple comparison correction. i Linear regression analysis of Foxp3+ Treg frequencies among CD4+ T cells in the spleens (left panel) and inguinal lymph nodes (right panel) of WT and HPSE-/- mice during aging. P value shown comparing slopes, n = 44, 38 (WT spleen, LN), and 61, 60 (HPSE-/- spleen, LN) individual mice. j Schematic overview of competitive bone marrow transplantation of WT and HPSE-/- donors. k Representative flow cytometry plots depicting FOXP3+ Treg frequencies among transferred CD4+ T cells recovered from spleen and LN tissue of mice engrafted with bone marrow from WT and HPSE-/- mice. n = 1 representative mouse for each group. l Frequencies of FOXP3+ cells among WT and HPSE-/- bone marrow-derived CD4+ T cells in lymphoid tissues of irradiated recipient mice. n = 3 (spleen, LN) and 2 (thymus) individual mice. m Schematic overview of competitive Treg transfer of WT and HPSE-/- donor mice. n Representative flow cytometry plots depicting CD45.1+ and CD45.2+ cell frequencies among transferred Treg recovered from spleen and LN tissue of recipient mice. n = 1 representative mouse. o Frequencies of CD45.1+ WT and CD45.2+ HPSE-/- among Treg in lymphoid tissues of recipient mice. n = 5 individual mice per group. l, o Shown are mean + SEM, P values determined by two-way ANOVA with Sidak’s multiple comparison correction.
Fig. 5
Fig. 5. HPSE expression supports FOXP3+ Treg function in vitro and in vivo.
a Schematic overview of experiments designed to assess the ability of mouse Treg to utilize IL-2 bound to U87-MG astrocytes or whole spinal cord (CNS) tissue in an HPSE-dependent manner. b, c Viability of WT and HPSE-/- murine (b) FOXP3+ Treg and (c) CD25+/FOXP3- Tconv among CD4+ T cells co-cultured with human U87-MG cells that were pre-incubated with IL-2 or media alone as a control. d, e Viability of WT and HPSE-/- (d) FOXP3+ Treg and (e) CD25+/FOXP3- Tconv among CD4+ T cells co-cultured with mouse spinal cord tissue that was pre-incubated with IL-2 or media alone as a control. be Percent of viable cells among FOXP3+ or FOXP3- cells is depicted, corrected for baseline viability of cell cultured in media alone. All panels show mean + SEM (n = 3 (b, c) and 6 (d, e) separate wells) of a representative of 4 (b, c) or 3 (d, e) independent experiments using pooled cells from 3–5 animals per experiment. b, c P values determined by unpaired two-tailed t-test with Holm-Sidak multiple comparison correction. d, e P values depict variation due to genotype (WT vs. HPSE-/-), determined by two-way ANOVA. f In vitro suppression of WT effector (FOXP3) T cells (Teff) by WT and HPSE-/- FOXP3+ Treg. The rate of division of Teff is plotted as percentage of unsuppressed Teff. Shown are mean +/− SEM (n = 3 separate wells) of a representative of 2 independent experiments, using pooled cells from 3–5 animals per experiment. P value determined by two-way ANOVA between WT and HPSE-/- Treg. g Schematic overview of transfer of in vivo expanded, CD4+/CD25+ sorted, Treg into WT recipients and subsequent EAE induction. h In vivo suppression of EAE by WT, and HPSE-/- FOXP3+ Treg that were transferred 1 day prior to induction of EAE (arrow). Control mice were injected with saline. Shown is average disease severity +/− SEM of all animals, n = 14 (control), 8 (WT Treg) and 7 (HPSE-/- Treg) animals, for one representative of 2 independent experiments. P value determined by Friedman test with Dunn’s correction for multiple comparisons. i Frequency and (j) expression levels of Treg functional markers of FOXP3+ cells among total CD4+ cells transfected with HPSE-mAbCAR after 72 h culture with IL-2-incubated heparin beads. Shown are mean + SEM (n = 3 separate wells) of the fold change of percentage FOXP3+ cells, relative to control mAbCAR cultured without IL-2, and of geometric MFI of each marker. k Expression levels of Treg functional markers on FOXP3+ cells recovered 3 days after adoptive transfer into CD45.2 recipients. Shown are mean + SEM (n = 2 independent experiments with 3–4 animals per group). i P values determined by unpaired two-tailed t-test, and (j, k) two-way ANOVA with Sidak’s multiple comparison correction. l In vivo suppression of EAE by control MOG-mAbCAR, and HPSE-overexpressing MOG-mAbCAR Treg that were transferred on day 14 after induction of EAE (arrow). Control mice were injected with saline. Shown is a representative of 2 independent experiments. Shown is average disease severity +/− SEM of all animals, n = 7 (control), 5 (MOG-mAbCAR) and 6 (HPSE-MOG-mAbCAR) animals per group. P value determined by Friedman test with Dunn’s correction for multiple comparisons.

Update of

References

    1. Sakaguchi S, Miyara M, Costantino CM, Hafler DA. FOXP3+ regulatory T cells in the human immune system. Nat. Rev. Immunol. 2010;10:490–500. doi: 10.1038/nri2785. - DOI - PubMed
    1. Dominguez-Villar M, Baecher-Allan CM, Hafler DA. Identification of T helper type 1–like, Foxp3+ regulatory T cells in human autoimmune disease. Nat. Med. 2011;17:673–675. doi: 10.1038/nm.2389. - DOI - PMC - PubMed
    1. Haas J, et al. Reduced suppressive effect of CD4+CD25high regulatory T cells on the T cell immune response against myelin oligodendrocyte glycoprotein in patients with multiple sclerosis. Eur. J. Immunol. 2005;35:3343–3352. doi: 10.1002/eji.200526065. - DOI - PubMed
    1. Venken K, et al. Compromised CD4+ CD25(high) regulatory T-cell function in patients with relapsing-remitting multiple sclerosis is correlated with a reduced frequency of FOXP3-positive cells and reduced FOXP3 expression at the single-cell level. Immunology. 2008;123:79–89. doi: 10.1111/j.1365-2567.2007.02690.x. - DOI - PMC - PubMed
    1. Viglietta V, Baecher-Allan C, Weiner HL, Hafler DA. Loss of functional suppression by CD4+CD25+ regulatory T cells in patients with multiple sclerosis. J. Exp. Med. 2004;199:971–979. doi: 10.1084/jem.20031579. - DOI - PMC - PubMed