. 2024 Feb 20;8(1):39.
doi: 10.1038/s41698-024-00536-7.

Selpercatinib combination with the mitochondria-targeted antioxidant MitoQ effectively suppresses RET-mutant thyroid cancer

Affiliations

Selpercatinib combination with the mitochondria-targeted antioxidant MitoQ effectively suppresses RET-mutant thyroid cancer

Wenjing Chen et al. NPJ Precis Oncol. .

Abstract

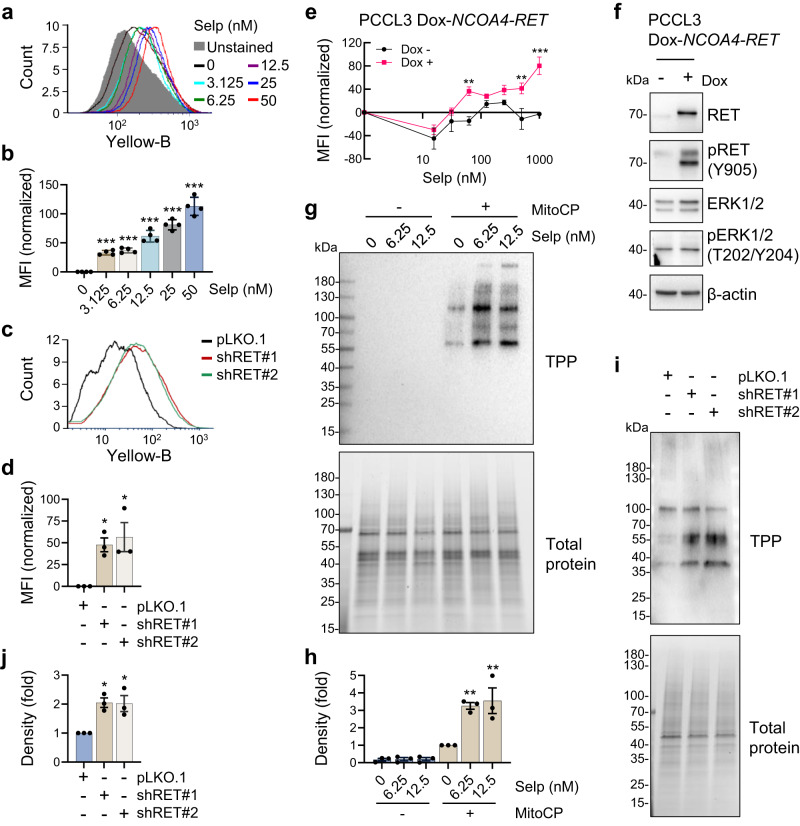
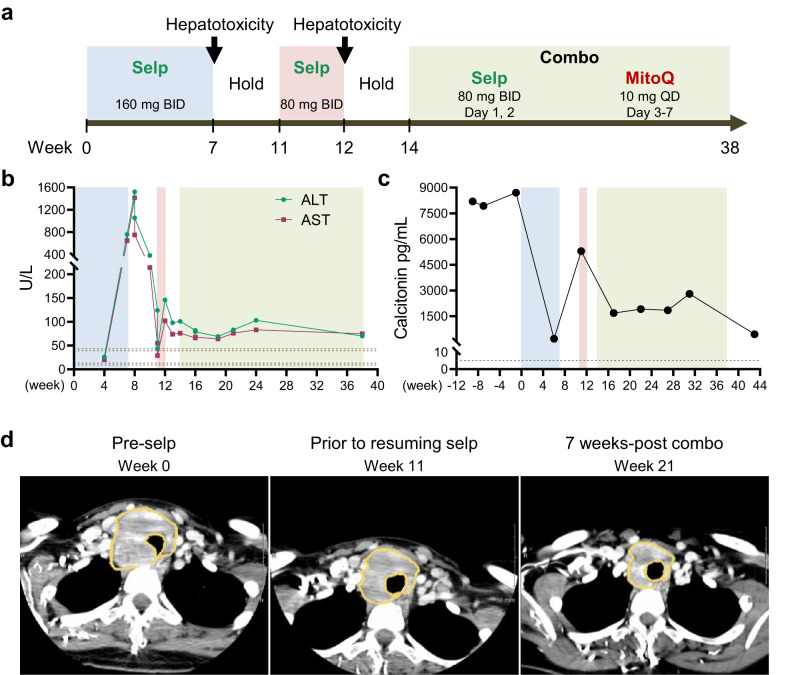
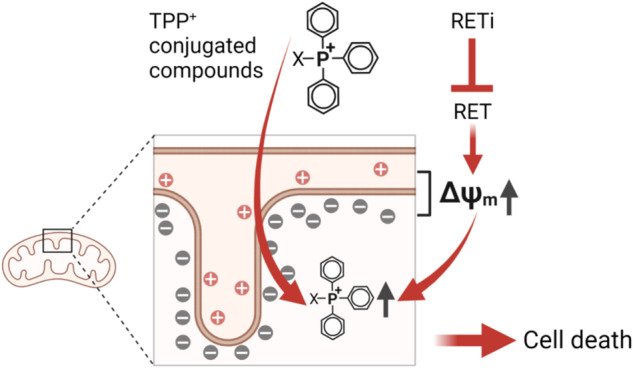
Genetic alternation of REarranged during Transfection (RET) that leads to constitutive RET activation is a crucial etiological factor for thyroid cancer. RET is known to regulate mitochondrial processes, although the underlying molecular mechanisms remain unclear. We previously showed that the multi-kinase inhibitors vandetanib and cabozantinib increase the mitochondrial membrane potential (Δψm) in RET-mutated thyroid tumor cells and that this effect can be exploited to increase mitochondrial enrichment of Δψm-sensitive agents in the tumor cells. In this study, we hypothesized that the RET-selective inhibitor, selpercatinib, can increase Δψm and, subsequently, tumor cell uptake of the mitochondria-targeted ubiquinone (MitoQ) to the level to break the mitochondrial homeostasis and induce lethal responses in RET-mutated thyroid tumor cells. We show that selpercatinib significantly increased Δψm, and its combination with MitoQ synergistically suppressed RET-mutated human thyroid tumor cells, which we validated using RET-targeted genetic approaches. Selpercatinib and MitoQ, in combination, also suppressed CCDC6-RET fusion cell line xenografts in mice and prolonged animal survival more effectively than single treatments of each agent. Moreover, we treated two patients with CCDC6-RET or RETM918T thyroid cancer, who could not take selpercatinib at regular doses due to adverse effects, with a dose-reduced selpercatinib and MitoQ combination. In response to this combination therapy, both patients showed tumor reduction. The quality of life of one patient significantly improved over a year until the tumor relapsed. This combination of selpercatinib with MitoQ may have therapeutic potential for patients with RET-mutated tumors and intolerant to regular selpercatinib doses.


Conflict of interest statement

The authors declare no competing interests.

Figures

Fig. 1
Fig. 1. Selpercatinib alters mitochondrial membrane potential in cells expressing RET fusion.
a TPC1 cells, treated with selpercatinib (selp) in a 3.125 to 50 nM dose range for 2 days, were stained with TMRM. Cellular TMRM retention was analyzed by flow cytometry measuring yellow fluorescence. b Mean fluorescence intensities (MFI) of TMRM-stained cells in a quantified by FCS Express software. Data are mean ± SEM (N = 4). ***P < 0.001 (compared with no treatment), one-way ANOVA with Bonferroni post-tests. c TPC1 cells, infected with lentiviral pLKO.1-shRET#1 and shRET#2 for 2 days, were stained with TMRM. Cellular TMRM retention was analyzed by flow cytometry measuring yellow fluorescence. d MFI of TMRM-stained cells in c quantified by FCS Express software. Data are mean ± SEM (N = 3). *P < 0.05 (compared with pLKO.1), one-way ANOVA with Bonferroni post-tests. e PCCL3 cells stably expressing a doxycycline (Dox)-inducible NCOA4-RET were treated with different doses of selpercatinib for 48 hours in the presence or absence of 0.5 µg/mL doxycycline. MFI of TMRM-stained cells was quantified by FCS Express software. Data are mean ± SEM (N = 4). **P < 0.005, ***P < 0.001 (compared with no doxycycline), two-way ANOVA with Bonferroni post-tests. f Western blot analysis of total lysates of PCCL3 cells with or without 48-hour doxycycline treatment. g TPC1 cells pretreated with selpercatinib for 2 days were treated with 2 μM MitoCP for 1 hour. Mitochondrial lysates of these cells were analyzed by western blotting to detect the formation of TPP-adducts using an antibody specific to the TPP moiety of MitoCP. Total proteins were visualized in the stain-free gel as the control for equal protein loading. h Densitometry of the Western blot signals collected from three independent experiments performed as described in g. Signals were normalized for total protein intensity. Data are mean ± SEM (N = 3). **P < 0.005 (compared with no treatment), one-way ANOVA with Bonferroni post-tests. i Western blotting to detect TPP-adducts in the mitochondrial lysates of TPC1 cells, infected with pLKO.1-shRET#1 and shRET#2 for 2 days, and then treated with 2 μM MitoCP for 1 hour. Total proteins visualized in the stain-free gel are the control for equal protein loading. j Densitometry of the Western blot signals collected from three independent experiments performed as described in i. Data are mean ± SEM (N = 3). *P < 0.05 (compared with pLKO.1), one-way ANOVA with Bonferroni post-tests.
Fig. 2
Fig. 2. Selpercatinib synergizes with MitoQ to suppress the viability of RET-mutated thyroid tumor cells.
a TPC1 cells in 12 well plates were treated with increasing doses of MitoQ, CoQ10, and TPP for 48 hours prior to crystal violet viability assay. Data are expressed as the percentage of untreated controls. Data are mean ± SEM (N = 3). b TPC1 cells, pretreated with different concentrations of selpercatinib, were treated with different doses of MitoQ for 48 hours prior to crystal violet viability assay. Data are mean ± SEM (N = 4). c SynergyFinder-generated plot of the viability data in b. The ZIP (zero interaction potency) score is indicated for the most synergistic area. d TPC1 cells, infected with lentiviral pLKO.1-shRET#1 for 24 hours, were treated with MitoQ for 48 hours prior to crystal violet viability assay. Data are expressed as the percentage of percentage of untreated controls. Data are mean ± SEM (N = 3). e Chou-Talalay plot of the data in d. CI was determined as a function of effect level (Fa). f Western blotting analysis of TPC1 cells cultured under hypoxia. β-actin is the control for equal protein loading. g TPC1 cells pretreated with selpercatinib were treated with MitoQ for 48 hours under the hypoxic condition prior to crystal violet viability assay. Data are mean ± SEM (N = 3). h SynergyFinder plot of the viability data in g. The ZIP score is indicated for the most synergistic area. i TT and MZ-CRC-1 cells pretreated with selpercatinib were treated with MitoQ for 48 hours prior to crystal violet viability assay. Data are mean ± SEM (N = 4). j SynergyFinder plot of the viability data in i. The ZIP score is indicated for the most synergistic area. All data are mean ± SEM (N ≥ 3). *P < 0.05, **P < 0.005, ***P < 0.001, Two-Way ANOVA with Bonferroni post-tests.
Fig. 3
Fig. 3. Selpercatinib and MitoQ combination effectively suppresses TPC1 xenografts in mice.
a Treatment schedule for a cycle in total four cycles. Detailed information is in Materials and Method. b Changes in tumor sizes at the indicated time points (N = 5). *P < 0.05, **P < 0.005, ***P < 0.001 (relative to the vehicle); #P < 0.05 (combination therapy versus selpercatinib monotherapy). Two-way ANOVA with Bonferroni post-tests. c Survival probability plot. Tumor size over 1200 mm3 was the endpoint. *P < 0.05, **P < 0.005, Log-rank test. d Body weights measured during the treatment. e Western blot analysis of tumor homogenates. β-actin is the control for equal protein loading.
Fig. 4
Fig. 4. Treatment of the patient with CCDC6-RET fusion metastatic PTC.
a Treatment timeline. b Blood pressure changes during the treatment. Dotted line indicates normal range of blood pressure. c CT scans of lung metastasis (orange arrows) prior to lenvatinib treatment (left), after stopping lenvatinib (middle), and after receiving 7 weeks of the selpercatinib and MitoQ combination therapy (right). Colors in b indicate the same treatment schedule shown in a. d Images of chest wall skin metastasis prior to lenvatinib treatment (left), after stopping lenvatinib (middle), and after receiving 3 weeks of the combination therapy (right).
Fig. 5
Fig. 5. Treatment of the patient with locally advanced, unresectable RETM918T MTC.
a Treatment timeline. b Changes in ALT and AST. c Changes in serum calcitonin levels. Dotted lines in b, c indicate normal range of tests; colors indicate the same treatment schedule shown in a. d CT scans of right 7 cm MTC with mass effects on the trachea and esophagus (orange circle) prior to initiating selpercatinib treatment (left), prior to resuming reduced dosage of selpercatinib (middle), and after 7 weeks of the selpercatinib and MitoQ combination therapy (right).
Fig. 6
Fig. 6. Graphic summary of the combination therapy concept.
An increase in Δψm facilitates the mitochondrial accumulation of TPP cations. Because RET inhibition increases Δψm, a RET inhibitor can enhance mitochondrial enrichment of a TPP-conjugated agent beyond a level to disrupt mitochondrial homeostasis and induce cell death. The image was generated with BioRender.com.

Similar articles

Cited by

References

    1. Santoro M, Carlomagno F. Central role of RET in thyroid cancer. Cold Spring Harb. Perspect. Biol. 2013;5:a009233. doi: 10.1101/cshperspect.a009233. - DOI - PMC - PubMed
    1. Qian Y, et al. KIF5B-RET fusion kinase promotes cell growth by multilevel activation of STAT3 in lung cancer. Mol. Cancer. 2014;13:176. doi: 10.1186/1476-4598-13-176. - DOI - PMC - PubMed
    1. Bongarzone I, et al. Molecular characterization of a thyroid tumor-specific transforming sequence formed by the fusion of ret tyrosine kinase and the regulatory subunit RI alpha of cyclic AMP-dependent protein kinase A. Mol. Cell Biol. 1993;13:358–366. - PMC - PubMed
    1. Tong Q, Xing S, Jhiang SM. Leucine zipper-mediated dimerization is essential for the PTC1 oncogenic activity. J. Biol. Chem. 1997;272:9043–9047. doi: 10.1074/jbc.272.14.9043. - DOI - PubMed
    1. Grieco M, et al. PTC is a novel rearranged form of the ret proto-oncogene and is frequently detected in vivo in human thyroid papillary carcinomas. Cell. 1990;60:557–563. doi: 10.1016/0092-8674(90)90659-3. - DOI - PubMed

LinkOut - more resources