. 2024 Feb 20;15(1):1541.
doi: 10.1038/s41467-024-45829-4.

A mutational atlas for Parkin proteostasis

Affiliations

A mutational atlas for Parkin proteostasis

Lene Clausen et al. Nat Commun. .

Abstract

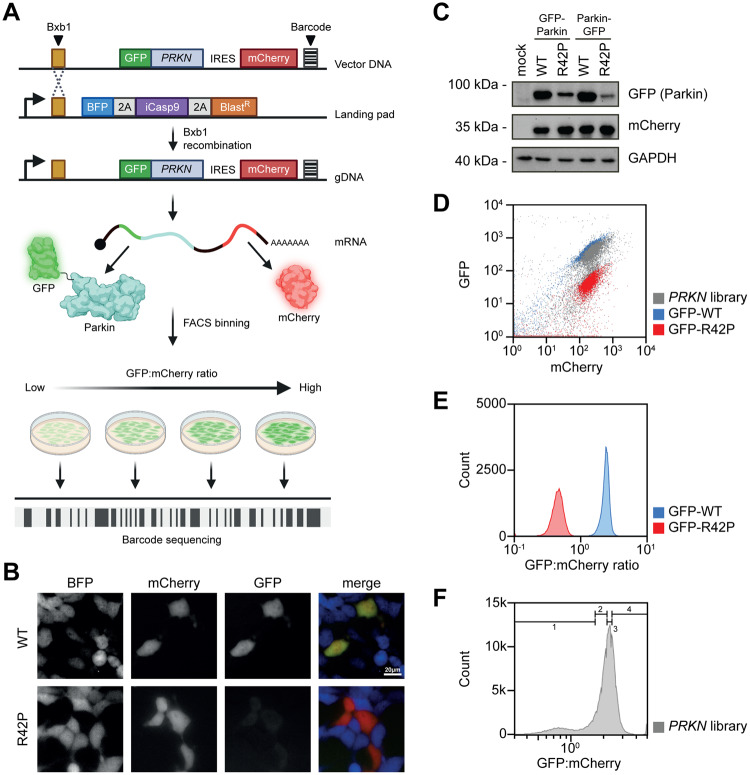
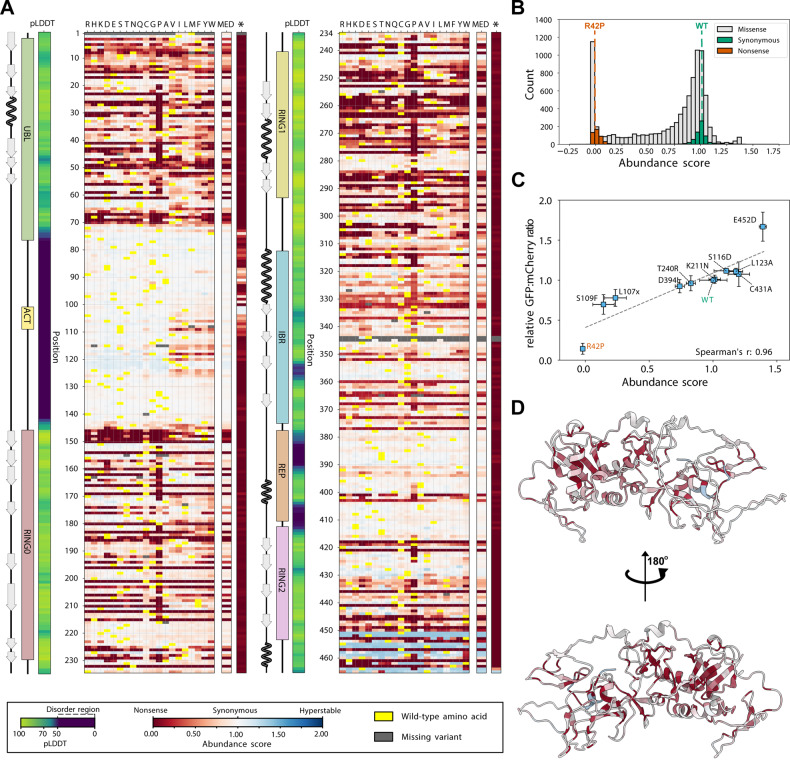
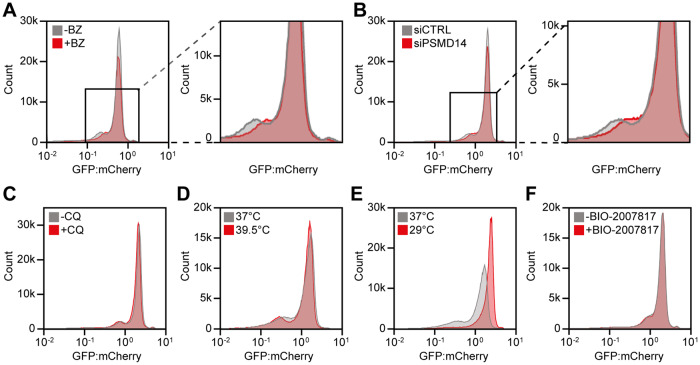
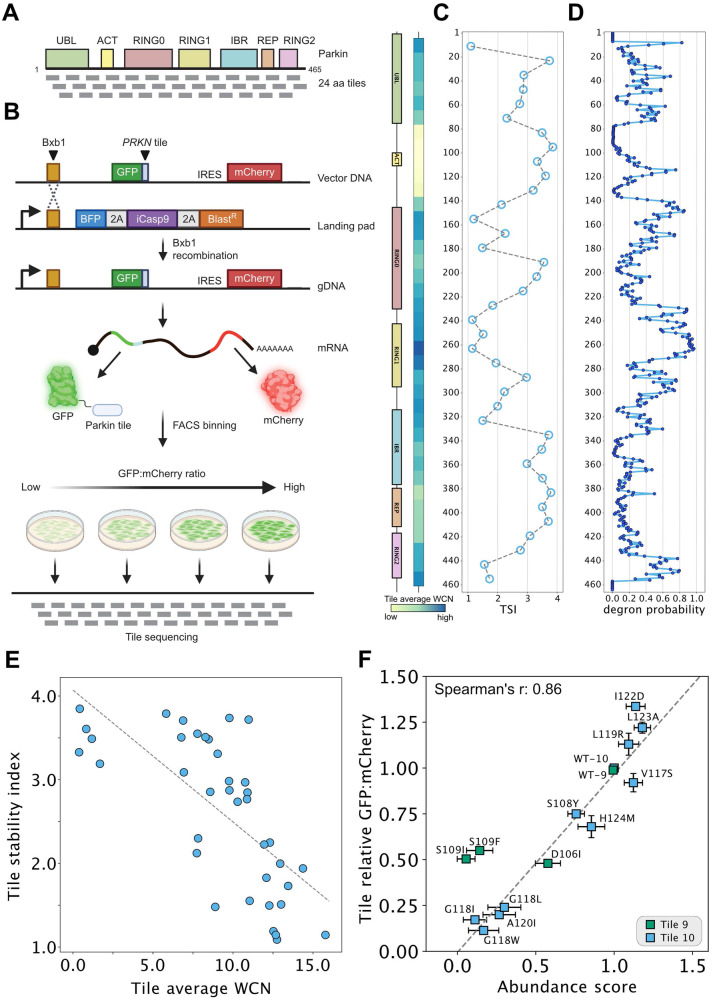
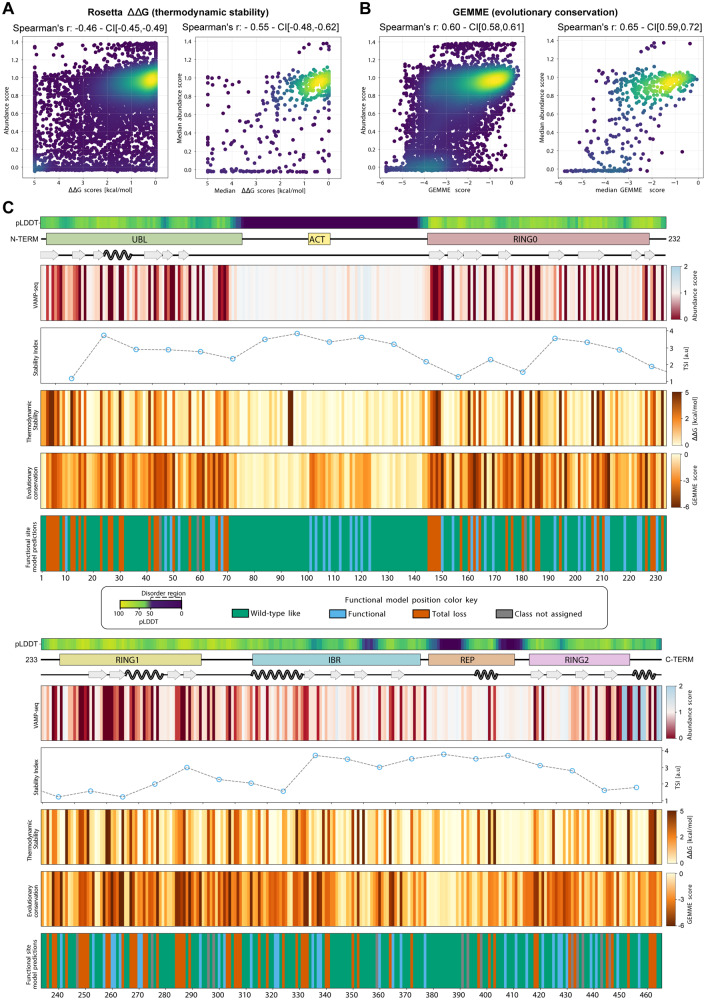
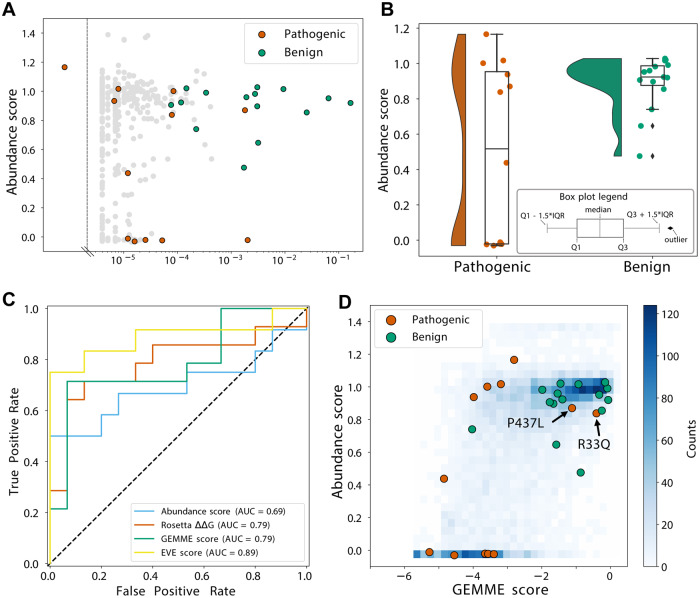
Proteostasis can be disturbed by mutations affecting folding and stability of the encoded protein. An example is the ubiquitin ligase Parkin, where gene variants result in autosomal recessive Parkinsonism. To uncover the pathological mechanism and provide comprehensive genotype-phenotype information, variant abundance by massively parallel sequencing (VAMP-seq) is leveraged to quantify the abundance of Parkin variants in cultured human cells. The resulting mutational map, covering 9219 out of the 9300 possible single-site amino acid substitutions and nonsense Parkin variants, shows that most low abundance variants are proteasome targets and are located within the structured domains of the protein. Half of the known disease-linked variants are found at low abundance. Systematic mapping of degradation signals (degrons) reveals an exposed degron region proximal to the so-called "activation element". This work provides examples of how missense variants may cause degradation either via destabilization of the native protein, or by introducing local signals for degradation.


Conflict of interest statement

K.L.-L. holds stock options in and is a consultant for Peptone Ltd. The remaining authors declare no competing interest.

Figures

Fig. 1
Fig. 1. Assessment of Parkin variant abundance.
A Schematic illustration of VAMP-seq applied to a site-saturated library of PRKN variants. The PRKN plasmid DNA library (Vector DNA) comprises a Bxb1-specific recombination site, a PRKN variant fused to GFP, an internal ribosomal entry site (IRES), mCherry and a unique barcode. The barcoded PRKN library is introduced into HEK293T cells containing a landing pad locus. The landing pad contains a Bxb1 recombination site downstream of a Tet-on promotor (bent arrow) that drives the expression of BFP, inducible Caspase 9 (iCasp9) and a blasticidin resistance gene (BlastR) separated with a parechovirus 2A-like translational stop-start sequence (2 A). The cells are co-transfected with the barcoded PRKN library and a plasmid encoding the Bxb1 recombinase that catalyzes site-specific recombination. After correct integration, GFP-Parkin and mCherry are expressed from the same mRNA. Using fluorescence-activated cell sorting (FACS) cells are sorted into four different and equally populated bins and the Parkin variants in each bin can be identified by sequencing the barcode. Figure created with BioRender.com. B Live fluorescence microscopy images showing BFP, GFP and mCherry signal intensities in stable transfected landing pad cells expressing N-terminal GFP-tagged wild-type (WT) or low abundance variant R42P Parkin. C The protein levels of GFP-tagged Parkin in whole cell lysates from stable transfected landing pad cell lines expressing N- or C-terminally GFP-tagged wild-type (WT) or R42P Parkin determined using SDS-PAGE and Western blotting with an antibody against GFP. The protein level of mCherry and GAPDH served as a control for cell-to-cell fluctuations and as a loading control, respectively. D Representative flow cytometry scatter plots of landing pad cells expressing GFP-WT (blue, n = 52,023), GFP-R42P (red, n = 52,245) or the PRKN variant library (grey, n = 5.46×10⁵). E Representative histogram plots for stable transfected landing pad cells expressing N-terminal GFP-tagged wild-type Parkin (GFP-WT) or R42P (GFP-R42P). Each histogram was created from at least 46,500 cells. F A representative flow cytometry profile for landing pad cells expressing the PRKN library (grey, n = 4.95×10⁵). Bin thresholds used to sort the library into four (1-4) equally populated bins (25% in each bin) are shown by black horizontal range gates.
Fig. 2
Fig. 2. A variant effect map of Parkin protein abundance.
A Heat-map of Parkin abundance scores determined by VAMP-seq. The asterisk (*) indicates nonsense variants. Median abundance scores (MED) based on missense variants were only calculated for the residues where we measured at least 17 abundance-scores. Scores range from low abundance (red) over WT-like abundance (white) to increased abundance (blue). Dark grey indicates missing variants. Yellow indicates the wild-type residue. We show the pLDDT (confidence score) from the AlphaFold prediction as a measure of the disorder propensity. The linear organization of Parkin domains and secondary structure elements across the sequence are indicated. B Histogram displaying the distribution of Parkin abundance scores for all missense (grey), synonymous (silent) wild-type (green) and nonsense (orange) variants determined by VAMP-seq. For comparison, the abundance scores of WT and R42P Parkin are marked with dashed lines. C Scatterplot comparing Parkin abundance scores derived from VAMP-seq and the GFP:mCherry ratios determined individually in low throughput by flow cytometry (n = 3 biological replicates). WT (green) and R42P (orange) Parkin were included for comparison. Error bars display standard deviations for both abundance scores and relative GFP:mCherry ratios determined in low throughput. x denotes a stop codon. D Cartoon representation of the Parkin structure (AF-O60260-F1) predicted by AlphaFold colored by the median abundance scores corresponding to panel A.
Fig. 3
Fig. 3. The majority of low abundance Parkin variants are thermolabile proteasome targets.
Representative histograms for landing pad cells expressing the PRKN library untreated (-) (n = 559,000 cells) or treated (+) (n = 436,000 cells) with (A) 15 μM bortezomib (BZ) for 16 hours, (B) 25 nM siRNA against PSMD14 (siPSMD14) (n = 426,000 cells) or 25 nM control siRNA (siCTRL) (n = 506,000 cells) for 48 hours, or (C) without (-CQ) (n = 495,000 cells) or 20 μM chloroquine ( + CQ) (n = 516,000 cells) for 16 hours. Zoom ins, defined by black squares, are shown for the BZ and siPSMD14 histograms. (DE) Flow cytometry profiles for landing pad cells expressing the PRKN library and grown at (D) 37 °C (n = 516,000 cells) or 39.5 °C (n = 511,000 cells) for 16 hours, or (E) 37 °C (n = 516,000 cells) or 29 °C (n = 511,000 cells) for 16 hours. F Representative flow cytometry profiles for landing pad cells expressing the PRKN library untreated (-) (n = 407,000 cells) or treated (+) (n = 426,000 cells) with 10 μM Parkin activator BIO-2007817 for 24 hours.
Fig. 4
Fig. 4. Assessment of tile stability index to map degrons in Parkin.
A Schematic illustration of the linear architecture of Parkin divided into 38 tiles of 24 residues, each tile partially overlapping by 12 residues. B Schematic diagram of an adapted VAMP-seq approach applied to the 38 Parkin tiles as illustrated in panel A. Note that the approach is similar to that presented in Fig. 1A, except full-length Parkin variants were replaced with the 24-mer tiles. Moreover, the tile library is not barcoded hence tile sequencing is performed instead of barcode sequencing after sorting. Figure created with BioRender.com. C Tile stability index (TSI) assigned to the central position of each 24-mer tile. The two diagrams (left) show Parkin domains and average weighted contact numbers (WCN) with colors ramping from pale yellow (low WCN, corresponding to more exposed regions in the protein structure) to dark blue (high WCN, corresponding to more buried positions in the protein structure). D Predicted probabilities of 17-mer tiles being quality control degrons assigned to the central amino acid. E Scatterplot comparing the average WCN for each tile and TSI. Spearman’s r: −0.76. F Scatterplot comparing GFP:mCherry ratios determined individually for Parkin tile missense variants in low-throughput by flow cytometry (n = 3 biological replicates) and abundance scores derived from the VAMP-seq experiment for full-length Parkin variants. Spearman’s r: 0.86. The error bars indicate the standard deviation.
Fig. 5
Fig. 5. Parkin abundance scores correlate with thermodynamic stability and evolutionary conservation.
A Density scatter plots comparing all Rosetta ΔΔG scores and abundance scores for missense Parkin variants derived from VAMP-seq (left) or median Rosetta ΔΔG and abundance scores (right). Colors ramping from purple (low density) to yellow (high density). B Identical to panel A, except GEMME scores are compared to VAMP-seq-derived abundance scores. C The figure depicts three diagrams (top); displaying the AlphaFold confidence score, pLDDT, as a measure of predicted disorder, the linear organization of Parkin domains and motifs and secondary structure elements across the Parkin sequence. Furthermore, the figure shows four maps and one line plot based on median scores; First, the abundance map and a line plot for tile stability index scores. Below the in silico maps based on evolutionary conservation scores by GEMME and thermodynamic stability ΔΔG values determined by Rosetta. Finally, a position effect map illustrating the classification obtained using a functional site predictor. Colors indicate the position classification. Green, wild-type-like positions (variants predicted as stable and functional); blue, functional sites (variants predicted as stable, but non-functional); red, total-loss sites (variants predicted as unstable and non-functional); grey, positions where a functional class could not be assigned.
Fig. 6
Fig. 6. Identifying and analyzing pathogenic variants.
A Scatterplot comparing abundance scores for missense Parkin variants generated by VAMP-seq and the allele frequency of pathogenic (orange), benign (green) or variants of unknown significance (grey) PRKN variants annotated in the Genome Aggregation Database (gnomAD). B Plots illustrate the abundance scores distribution for 12 pathogenic (orange) and 15 benign (green) Parkin variants. Dots are scattered horizontally to limit overlap, illustrating both the distribution and abundance score. The black diamonds indicate outliers. Boxplots are defined as indicated in the insert. C ROC curves for abundance score (blue), Rosetta ΔΔG (orange), GEMME score (green), and EVE scores (yellow). D Density scatterplot comparing GEMME scores and abundance scores for all variants (blue), variants classified as pathogenic (orange) or benign (green).

References

    1. Poewe W, et al. Parkinson disease. Nat. Rev. Dis. Prim. 2017;3:1–21. - PubMed
    1. Kitada T, et al. Mutations in the parkin gene cause autosomal recessive juvenile parkinsonism. Nature. 1998;392:605–608. doi: 10.1038/33416. - DOI - PubMed
    1. Lücking CB, et al. Association between early-onset Parkinson’s disease and mutations in the parkin gene. N. Engl. J. Med. 2000;342:1560–1567. doi: 10.1056/NEJM200005253422103. - DOI - PubMed
    1. Shimura H, et al. Familial Parkinson disease gene product, parkin, is a ubiquitin-protein ligase. Nat. Genet. 2000;25:302–305. doi: 10.1038/77060. - DOI - PubMed
    1. Panicker N, Ge P, Dawson VL, Dawson TM. The cell biology of Parkinson’s disease. J. Cell Biol. 2021;220:e202012095. doi: 10.1083/jcb.202012095. - DOI - PMC - PubMed